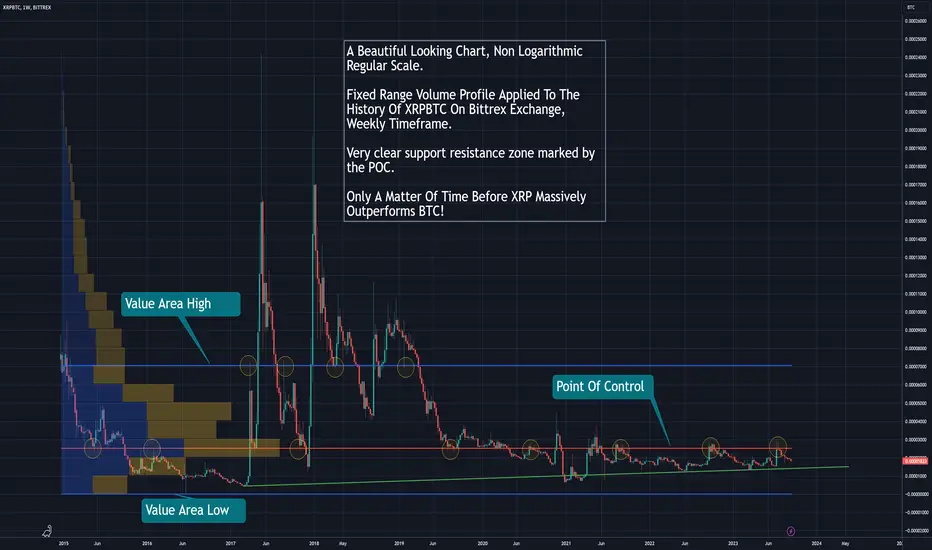
I applied the fixed range volume profile tool to the history of XRPBTC pair on Bittrex on a weekly timeframe. It shows a very well defined clear level of support and resistance formed by the POC.
This has to be the most bullish chart out there. No doubt once XRPBTC breaks out of this zone, it will significantly outperform BTC.
This is a regular scale / nonlogarithmic chart, which I think gives you a better image of what XRP can do once it breaks out of this range.
This has to be the most bullish chart out there. No doubt once XRPBTC breaks out of this zone, it will significantly outperform BTC.
This is a regular scale / nonlogarithmic chart, which I think gives you a better image of what XRP can do once it breaks out of this range.

منشورات ذات صلة
إخلاء المسؤولية
لا يُقصد بالمعلومات والمنشورات أن تكون، أو تشكل، أي نصيحة مالية أو استثمارية أو تجارية أو أنواع أخرى من النصائح أو التوصيات المقدمة أو المعتمدة من TradingView. اقرأ المزيد في شروط الاستخدام.
منشورات ذات صلة
إخلاء المسؤولية
لا يُقصد بالمعلومات والمنشورات أن تكون، أو تشكل، أي نصيحة مالية أو استثمارية أو تجارية أو أنواع أخرى من النصائح أو التوصيات المقدمة أو المعتمدة من TradingView. اقرأ المزيد في شروط الاستخدام.