
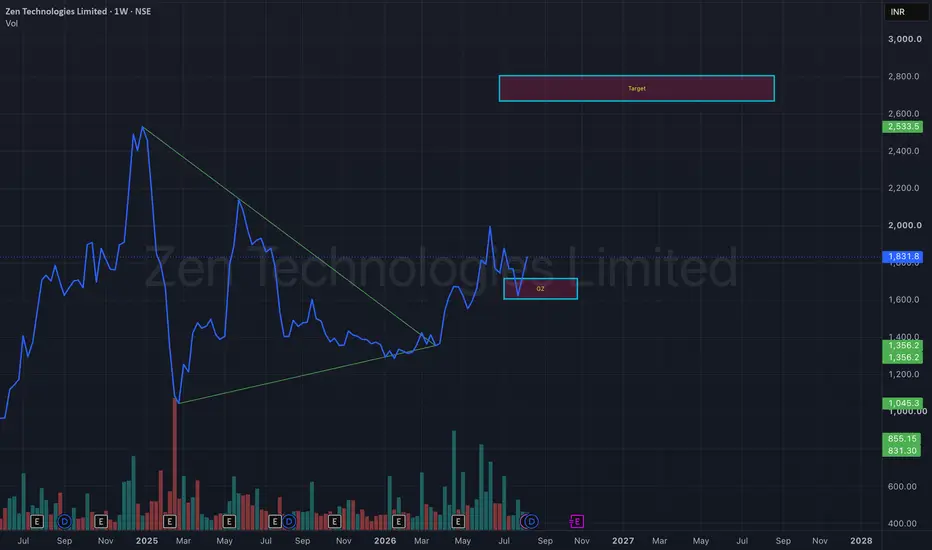
Zen Technologies has been consolidating within a Symmetrical Triangle on the weekly timeframe, following a sharp rally and subsequent correction. The narrowing price range indicates that both buyers and sellers are reaching equilibrium, often leading to a strong directional move once the pattern resolves.
The recent breakout above the upper trendline suggests buyers are attempting to regain control, while the former resistance zone now acts as a key demand area.
📊 Technical Highlights
✅ Symmetrical Triangle breakout
✅ Higher lows indicate improving buying interest
✅ Breakout backed by strong weekly momentum
✅ Price holding above the breakout zone
✅ Volume expansion supports the bullish outlook
📍 Key Levels
Breakout Zone: ₹1,650–1,700
Immediate Support: ₹1,600
Major Support: ₹1,350–1,400
🎯 Bullish Scenario
If price sustains above the breakout zone with continued buying interest, the next leg of the uptrend could unfold.
Potential Targets:
🎯 Target 1: ₹2,100
🎯 Target 2: ₹2,350
🎯 Target 3: ₹2,700–2,800
⚠️ Risk
A weekly close back below ₹1,600 would invalidate the breakout and could lead to a retest of the ₹1,350–1,400 demand zone.
Technical Summary
Pattern: Symmetrical Triangle Breakout
Trend: Long-Term Bullish
Timeframe: Weekly
Confirmation: Weekly close above ₹1,700 with strong volume
Bias: Bullish while above the breakout level
Disclaimer:
This analysis is for educational purposes only and should not be considered investment advice. Always perform your own research and use proper risk management before making investment decisions.
The recent breakout above the upper trendline suggests buyers are attempting to regain control, while the former resistance zone now acts as a key demand area.
📊 Technical Highlights
✅ Symmetrical Triangle breakout
✅ Higher lows indicate improving buying interest
✅ Breakout backed by strong weekly momentum
✅ Price holding above the breakout zone
✅ Volume expansion supports the bullish outlook
📍 Key Levels
Breakout Zone: ₹1,650–1,700
Immediate Support: ₹1,600
Major Support: ₹1,350–1,400
🎯 Bullish Scenario
If price sustains above the breakout zone with continued buying interest, the next leg of the uptrend could unfold.
Potential Targets:
🎯 Target 1: ₹2,100
🎯 Target 2: ₹2,350
🎯 Target 3: ₹2,700–2,800
⚠️ Risk
A weekly close back below ₹1,600 would invalidate the breakout and could lead to a retest of the ₹1,350–1,400 demand zone.
Technical Summary
Pattern: Symmetrical Triangle Breakout
Trend: Long-Term Bullish
Timeframe: Weekly
Confirmation: Weekly close above ₹1,700 with strong volume
Bias: Bullish while above the breakout level
Disclaimer:
This analysis is for educational purposes only and should not be considered investment advice. Always perform your own research and use proper risk management before making investment decisions.

إخلاء المسؤولية
لا يُقصد بالمعلومات والمنشورات أن تكون، أو تشكل، أي نصيحة مالية أو استثمارية أو تجارية أو أنواع أخرى من النصائح أو التوصيات المقدمة أو المعتمدة من TradingView. اقرأ المزيد في شروط الاستخدام.
إخلاء المسؤولية
لا يُقصد بالمعلومات والمنشورات أن تكون، أو تشكل، أي نصيحة مالية أو استثمارية أو تجارية أو أنواع أخرى من النصائح أو التوصيات المقدمة أو المعتمدة من TradingView. اقرأ المزيد في شروط الاستخدام.