EURUSD upside target: 1.1868On the daily chart, EURUSD has formed a double bottom pattern, indicating that bulls have the upper hand in the short term. Currently, the market presents opportunities to buy on pullbacks, with support around 1.167 and an upside target around 1.1868. This level is a potential shorting entry point for a bearish bat pattern and is also within a previous supply zone.
Bat
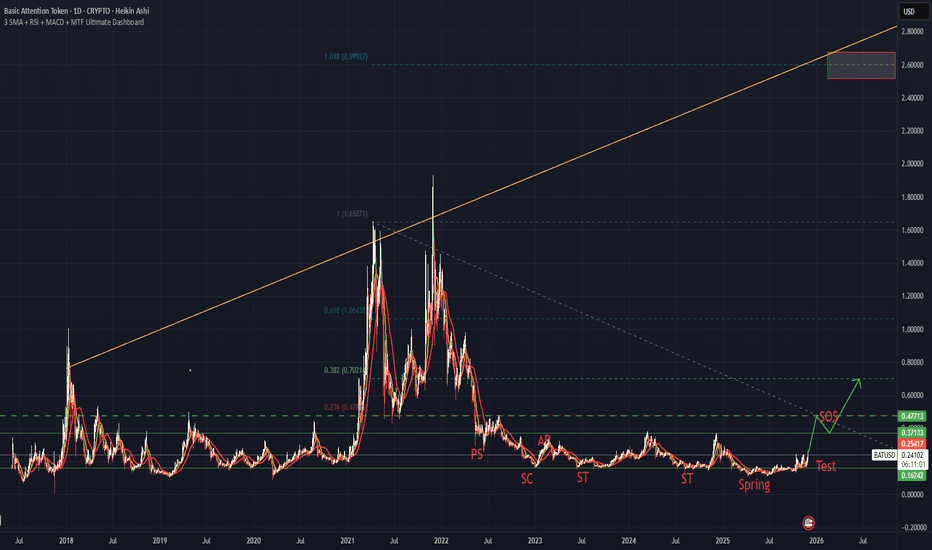
BAT is getting close to the buyers' zone (3D)After multiple drops, it seems that BAT is getting close to a strong support level. In this zone, it is possible to buy gradually in spot.
The targets are indicated on the chart.
The closure of a daily candle below the invalidation level will invalidate this analysis.
Do not enter the position without capital management and stop setting
Comment if you have any questions
thank you
CADCHF - Potential Bearish BatCAD/CHF is completing a clean Bearish Bat pattern at 0.58658.
Price is entering a major supply zone, forming RSI bearish divergence, and pushing above the value area into a low-volume rejection area. These conditions create a high-probability sell setup.
Entry:
Sell 0.58550 – 0.58800 (after confirmation)
Stop Loss:
0.58950 – 0.59100 above X and liquidity
Targets:
TP1: 0.576–0.577 (0.382 retracement + POC zone)
TP2: 0.570–0.571 (0.618 retracement + VAL)
TP3: 0.563–0.565 (macro structure)
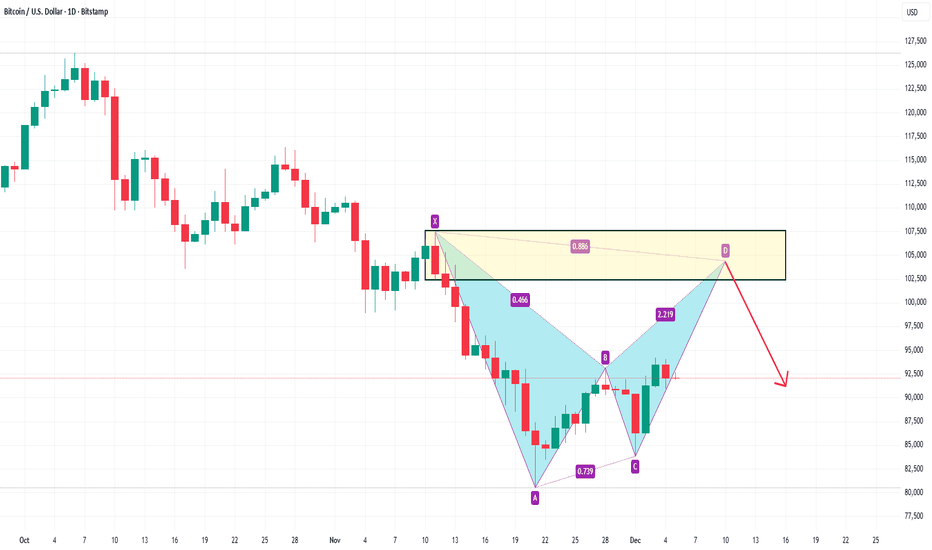
BTCUSD SELL 104400On the daily chart, ETHUSD has stabilized and rebounded, with bulls holding the upper hand in the short term. Currently, attention should be paid to the resistance around 104400, a potential shorting entry point for a bearish bat pattern, which also falls within the previous supply zone.
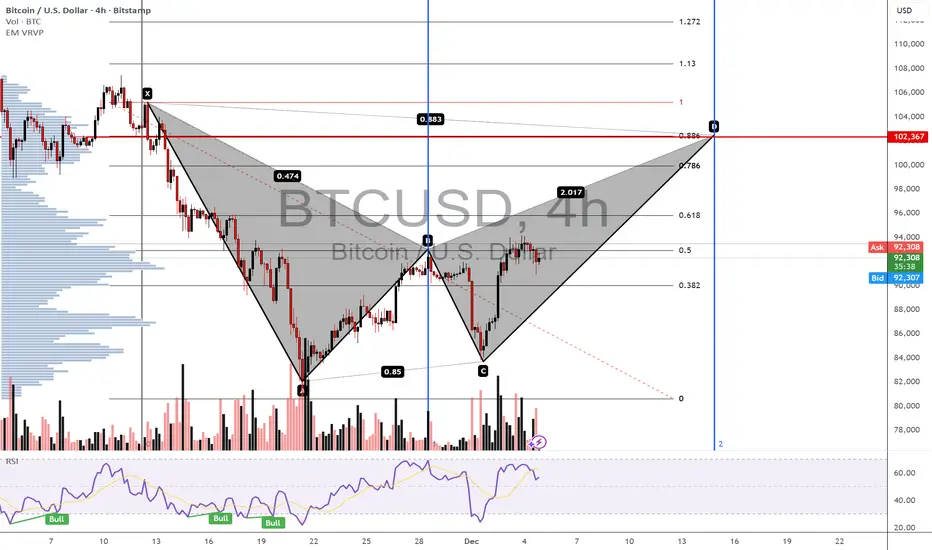
BTCUSD - Potential Bearish BatBTCUSD forming a Bearish Bat pattern completing at 102,367, aligned with major supply, fib confluence, and momentum divergence.
Expectation: Price to reach PRZ, sweep liquidity, and reject lower.
Entry:
Short 101,500–103,000 (aggressive)
or
Wait for bearish confirmation.
Stop Loss:
103,500–104,500 above X and liquidity pool.
Targets:
TP1: 95,000–96,000
TP2: 90,000–91,000
TP3: 82,000–84,000 (runner)
Reasoning:
Harmonic symmetry + fib clustering + low-volume node + RSI divergence all point
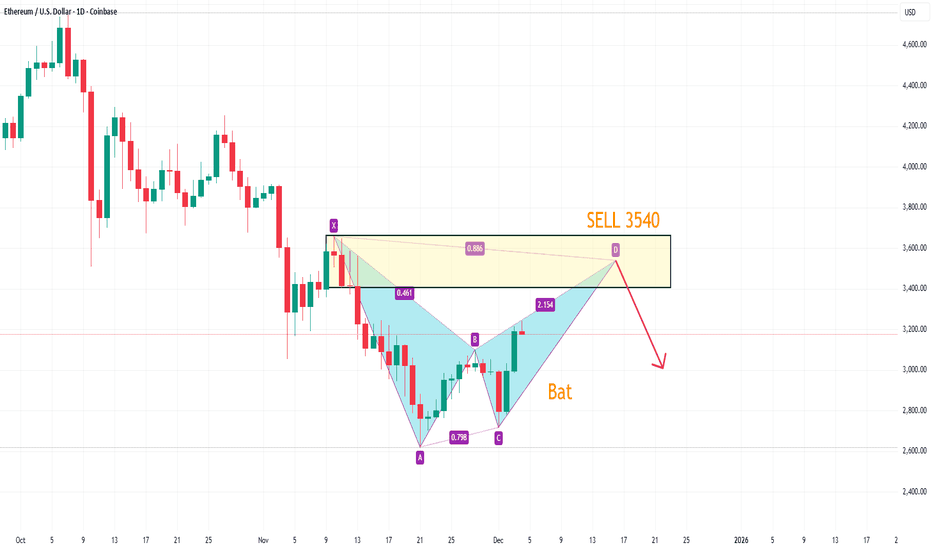
ETHUSD Bearish BatETH is completing a Bearish Bat pattern at the 0.886 retracement near 3,476, coinciding with prior supply, bearish RSI divergence, and a low-volume node overhead. The harmonic pattern aligns with structural liquidity and fib extensions that indicate likely exhaustion.
Prediction:
Expect rejection and reversal from the 3,450–3,500 PRZ, with downside targets toward 3,150, 3,000, and potentially 2,800.
Entry:
Short at 3,450–3,500 (aggressive) or after confirmation (conservative).
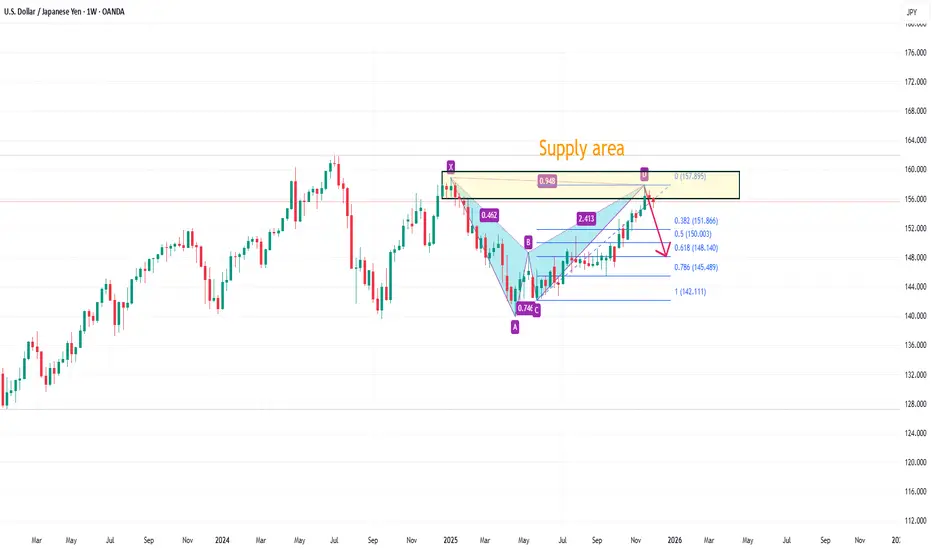
USDJPY TP 148.14On the weekly chart, USD/JPY encountered resistance after testing the previous supply zone, and the current price action has formed a bearish bat pattern. The current downside target is the 0.382 Fibonacci retracement level (151.86), with a second target at the 0.618 Fibonacci retracement level (148.14).
BAT – Decision Point Ahead as Structure TightensBAT is approaching a critical decision zone as price moves within a tightening structure. After a strong impulsive leg upward, the market is now forming a potential topping pattern while sitting directly on the trendline support.
The current behaviour shows two possible scenarios depending on how price reacts around this region. The market has respected this ascending support multiple times, making it an important level to watch closely.
Key Observations:
• The recent high has created a pot
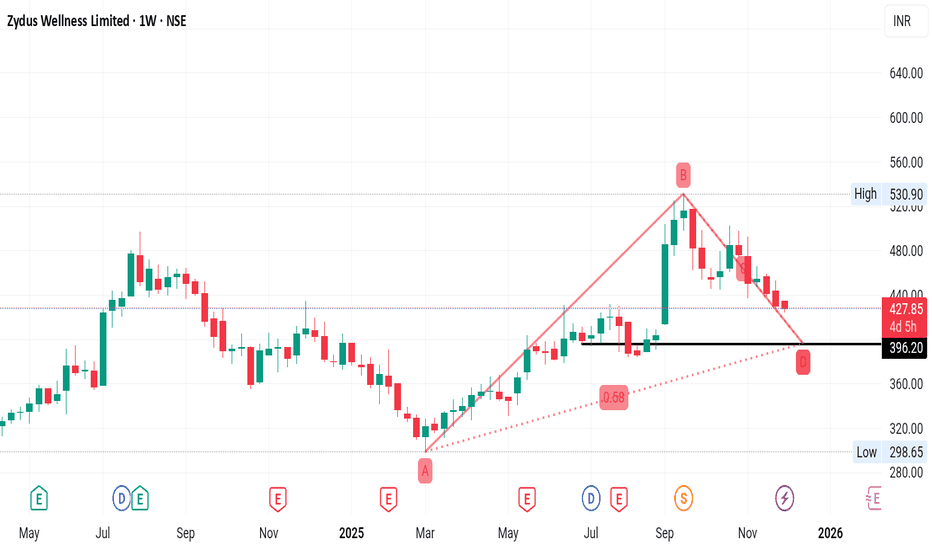
ZYDUSWELLNESSNSE:ZYDUSWELL
In weekly time frame bat pattern fomed.
for educational purpose only
information provided is for informational purposes only and should not be construed as investment advice or an offer to buy or sell securities. Investors are advised to carefully review all materials and consult with a financial advisor considering their own financial situation and risk tolerance before making investment decisions. The disclaimer also often includes statements about no guarantees or warranti
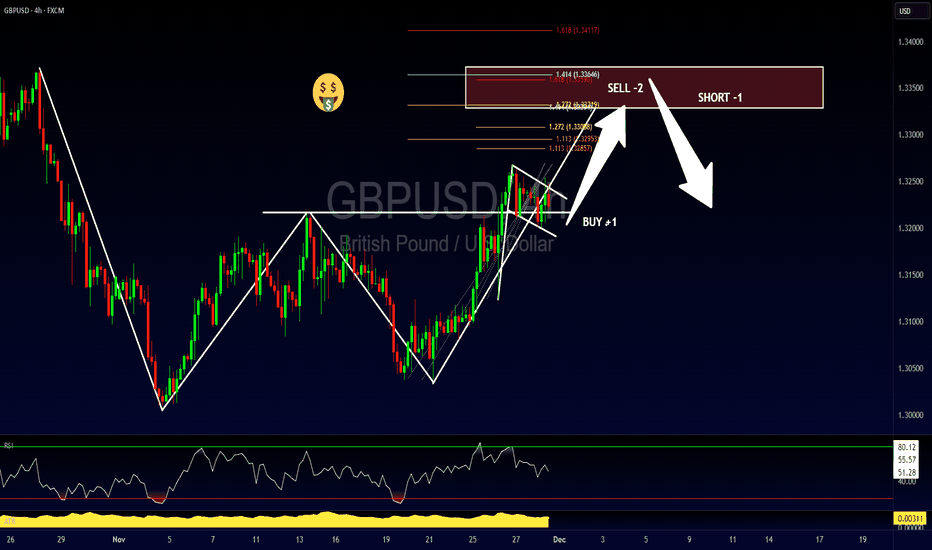
GBPUSD - Flag + Bat= SARMy top trading idea of the week comes on GBPUSD, and it’s a unique scenario packed with multiple setups working together. The first is a potential bearish Bat pattern forming at higher prices. The second is a potential bullish flag pattern that develops before the Bat completes, offering an early opportunity to get involved on the long side.
The third setup ties everything together using a technique called the “Stop and Reverse.” This approach allows traders to transition directly from the bull
XAUUSD SELL 4217On the 4-hour chart, XAUUSD has stabilized and is trending upwards, with bulls holding the upper hand in the short term. Currently, attention should be paid to the resistance around 4217, which is a potential shorting entry point for a bearish bat pattern and is also within a previous supply zone. If the price breaks through the resistance around 4245, it will continue to rise.
SOLUSD Bullish Bat Pattern Thesis – 4H & DailyI'm monitoring SOL for a potential bullish Bat harmonic reversal pattern developing on both the 4H and Daily timeframes. The Bat pattern is a high-probability harmonic formation that can signal trend exhaustion and a reversal, especially when confirmed at the D leg, which typically completes between the 0.886–0.9 retracement of the X-A move.
4H Chart
Structure: The price is currently correcting after a local top, with recent lower lows forming potential A, B, and C legs in sequence.
Key Bat Le
EURUSD downside target: 1.154On the 4-hour chart, EURUSD encountered resistance and fell back after testing the previous supply zone, forming a bearish bat pattern in the short term. Currently, watch for resistance around 1.162; consider shorting if it rebounds and encounters resistance. Support is around 1.154, and a break below that level would target the 1.147-1.150 area.