Bat
XAUUSD SELL 4217On the 4-hour chart, XAUUSD has stabilized and is trending upwards, with bulls holding the upper hand in the short term. Currently, attention should be paid to the resistance around 4217, which is a potential shorting entry point for a bearish bat pattern and is also within a previous supply zone. If the price breaks through the resistance around 4245, it will continue to rise.
SOLUSD Bullish Bat Pattern Thesis – 4H & DailyI'm monitoring SOL for a potential bullish Bat harmonic reversal pattern developing on both the 4H and Daily timeframes. The Bat pattern is a high-probability harmonic formation that can signal trend exhaustion and a reversal, especially when confirmed at the D leg, which typically completes between the 0.886–0.9 retracement of the X-A move.
4H Chart
Structure: The price is currently correcting after a local top, with recent lower lows forming potential A, B, and C legs in sequence.
Key Bat Levels:
X-A: Local swing high to low, establishing the pattern's root.
A-B: Retrace to ~0.382–0.5 of X-A.
B-C: Moves higher, ideally hitting around 0.382–0.886 of A-B.
C-D: Final leg down, targeting the 0.886 retracement of the X-A origin.
Criteria:
Watch for a bullish reaction in price and supporting indicators (volume spike, bullish candle formation, positive divergence) at/near the 0.886 retracement.
Confirmation from order flow or divergence indicators adds confluence.
Daily Chart (D)
Pattern Fractal: The Daily shows a broader corrective move that could echo the 4H pattern, with a larger-scale Bat formation possibly in play.
Entry/Trigger Level: The ideal buy zone is at or just below 0.886 of the key X-A swing.
Risk Controls: Set stop losses slightly below X to minimize risk if the harmonic invalidates.
Targets:
Initial: Return to point C (~0.5–0.618 retracement of A–D)
Ultimate: Approach point A swing high for full pattern completion.
Thesis & Market Context
SOL remains structurally bullish on higher timeframes despite the local correction.
Bat completions often coincide with liquidity sweeps and value zones, strengthening the reversal thesis.
If D completes as drawn, expect a rapid reaction as short liquidation and fresh bids enter the market.
EURUSD downside target: 1.154On the 4-hour chart, EURUSD encountered resistance and fell back after testing the previous supply zone, forming a bearish bat pattern in the short term. Currently, watch for resistance around 1.162; consider shorting if it rebounds and encounters resistance. Support is around 1.154, and a break below that level would target the 1.147-1.150 area.
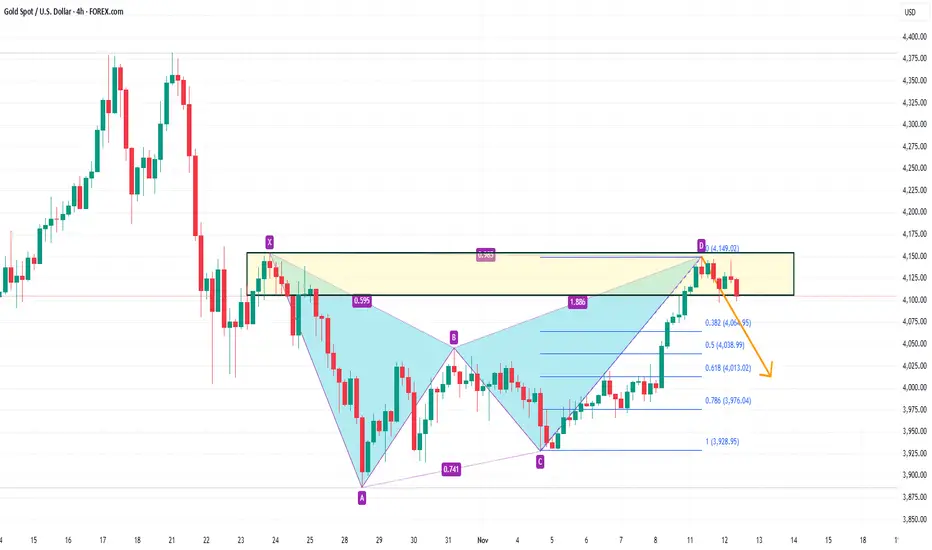
XAUUSD downside target: 4013On the 4-hour chart, XAUUSD encountered resistance and fell back after testing the previous supply zone, forming a bearish bat pattern in the short term. Currently, attention should be paid to the resistance around 4149. If the rebound fails to break through, the short-selling strategy should be maintained, with a target of around 4065 (0.382 of CD) and a second target of around 4013 (0.618 of CD).
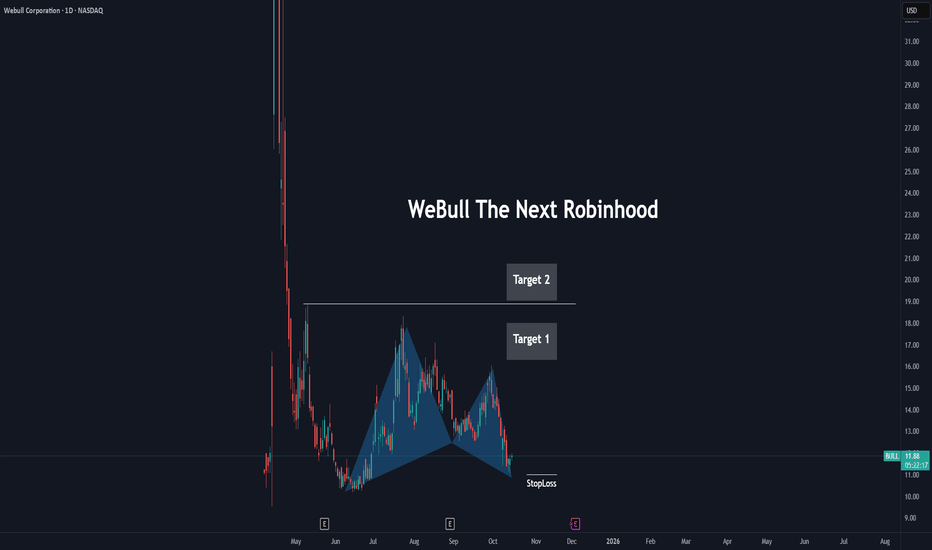
$CLSK: short term bullish Gartley NASDAQ:CLSK : bullish Gartley Harmonic has XD = 78.6%. NASDAQ:CLSK has exceeded this ratio slightly. Bullish Bat's XD ratio is 88.6%, this week's low aligns with this ratio.
The bullish Gartley appears to have completed and prices should start to recover.
If the broader market drops, AB = CD can target $13.50, which would present an excellent opportunity to add. I'll be adding to my position in the buy zone if the opportunity presents itself.
Additionally, the buy zone aligns with the last triangle congestion area, which gives more confidence that this area has strong support.
I added some today. If it goes down more tomorrow, I plan to add more.
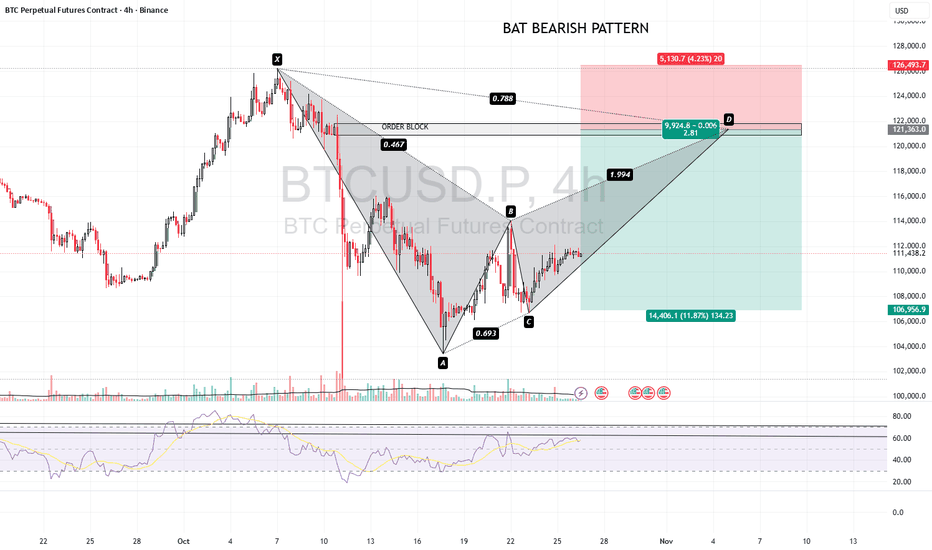
BTCUSD SELL 109730On the 4-hour chart, BTCUSD has stabilized and rebounded, and the short-term trend is expected to continue upward. Currently, pay attention to the area around 109730, which is a potential shorting entry point for a bearish bat pattern, and it also falls within the previous supply zone.
USDJPY SELL 156.70On the daily chart, USD/JPY is trending upwards, with bulls holding the upper hand in the short term. Currently, attention should be paid to the resistance level around 156.70, which is a potential shorting entry point for a bearish bat pattern and is also within the previous supply zone.
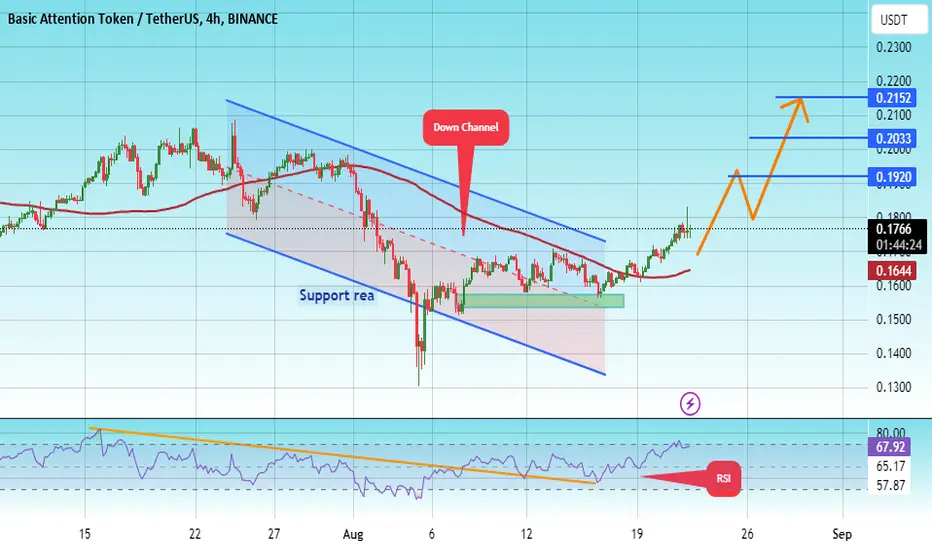
#BAT/USDT#BAT
The price is moving in a descending channel on the 4-hour frame and is sticking to it very well and is expected to break it upwards
We have a bounce from a major support area in green at 0.1550
We have a downtrend on the RSI indicator that was broken upwards which supports the rise
We have a trend to stabilize above the 100 moving average which supports the rise
Entry price 0.1700
First target 0.1920
Second target 0.2033
Third target 0.2152
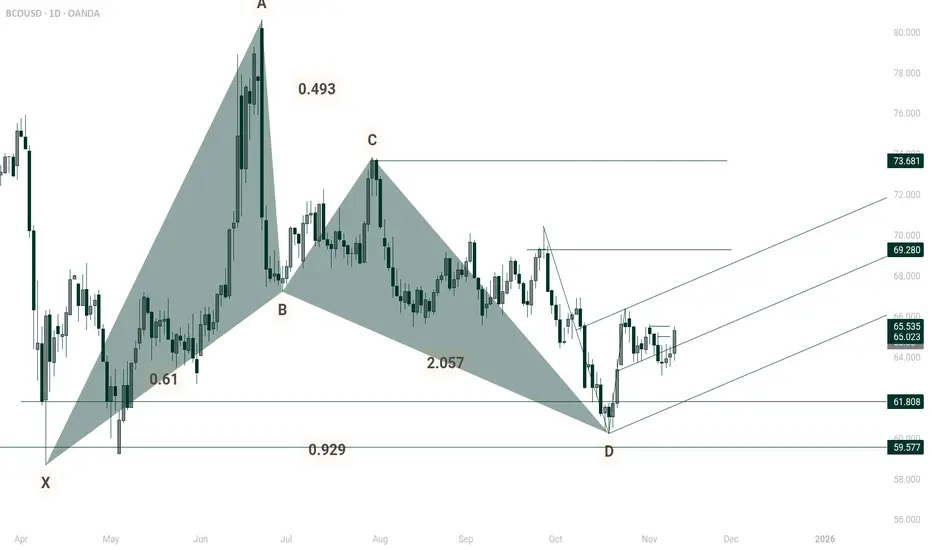
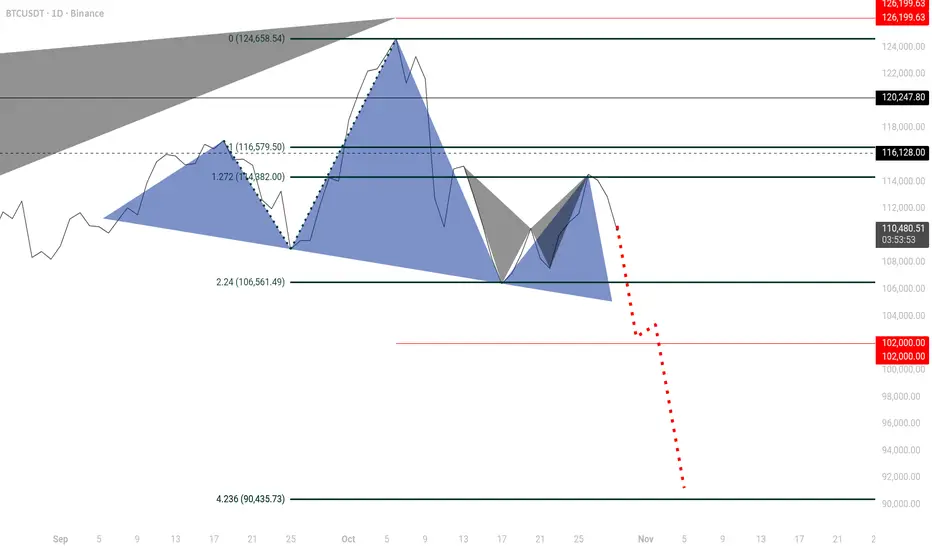
Btc head shouldersSometimes you have to switch off the noise to begin to hear with more clarity. The same goes with price action, candle wicks are loud and in your face. Daily open, and in this case, daily close, line drawings can give you a clearer less obstructed view. The W pattern is a harmonic bat on the right shoulder.
The fib extension is a projection, not fact, but points to a round number 90k ish.