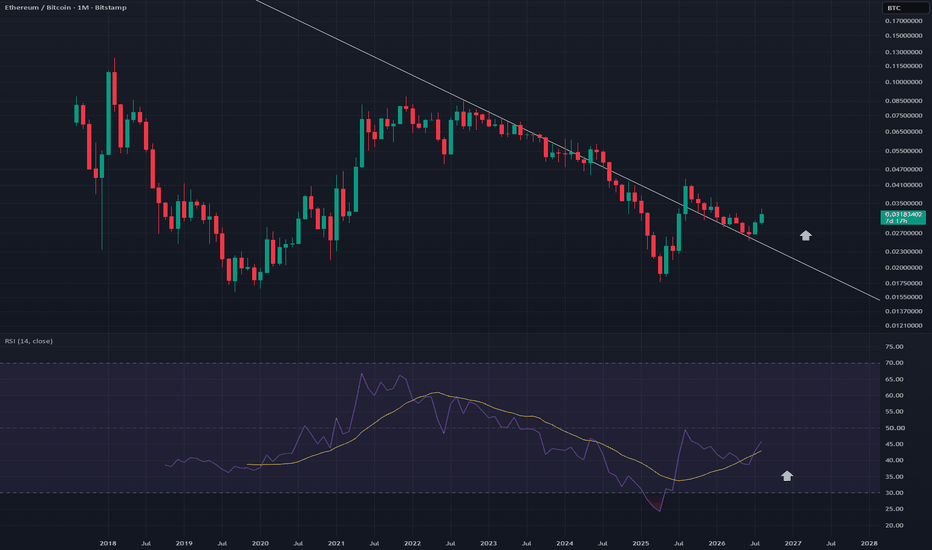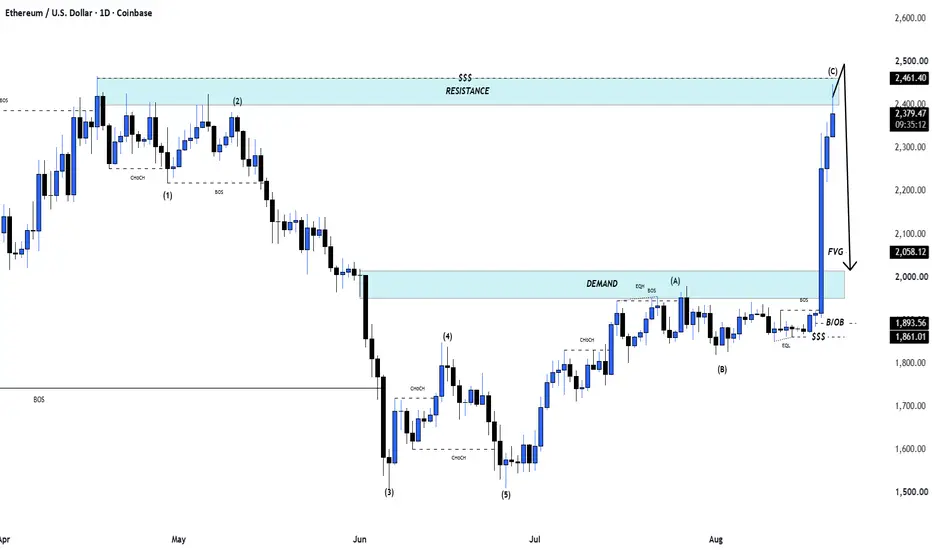
THE KEY QUESTION: CAN IT ESCAPE THE SHORT-TERM BOTTOM ZONE?
Hello, traders.
If you follow me, you can stay updated with my latest market analysis and trading insights.
Have a great trading day.
━━━━━━━━━━━━━━━━━━━━━━━━━━━━━━━━━━
【 ETH ENTERS A VOLATILITY WINDOW 】
ETH is currently within a volatility window, which is expected to continue through August 28.
However, BTC's volatility window is expected to run from August 27 to August 29.
Therefore, it may be necessary to monitor ETH's price action through August 29 as well.
ETH is currently tradi
Bill Williams Indicators
ETH Breaks Higher — Is Ethereum Preparing for the Next Leg Up?Market Structure
Ethereum remains in a strong bullish market structure following its explosive breakout above the long-term consolidation range. The sharp impulsive rally established a new higher high, while the recent price action has transitioned into a healthy consolidation near the highs. As long as higher lows continue to hold, the primary trend remains bullish.
Market Sentiment - Bullish
Overall sentiment remains constructive. Despite short-term profit-taking, buyers continue defendi
Crypto: Fear disappeared too fastCMC Crypto Fear & Greed Index jumped to 81 — Extreme Greed, the highest level of the year.
Just one month ago, sentiment was still in Fear at 36. Last week it was only Neutral at 41.
Now the crowd is suddenly confident again.
That is a huge emotional shift.
The danger is not that crypto is strong.
The danger is that traders may start feeling safe exactly after the market has already moved.
When fear disappears too fast, FOMO usually gets louder.
This does not mean the rally must end immediate
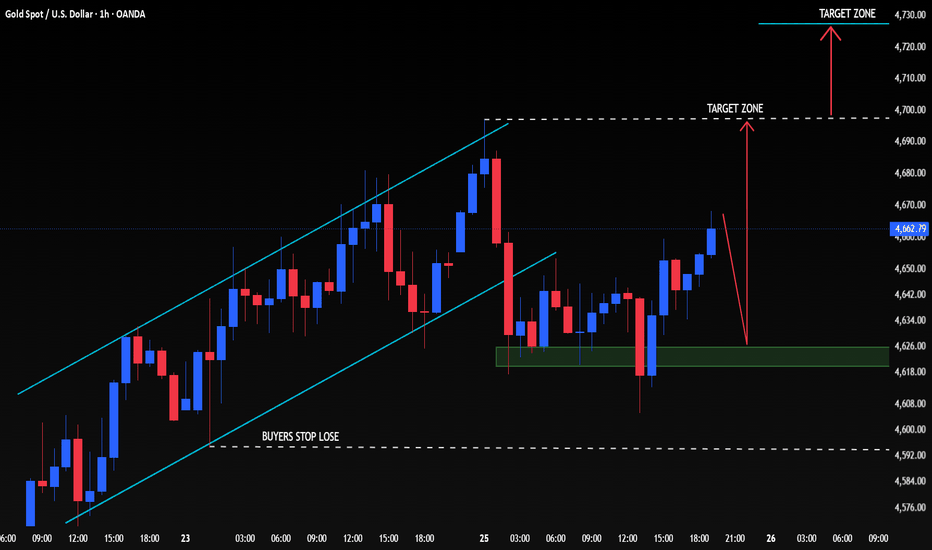
XAUUSD | GOLD | BUY SETUP....🥇 XAUUSD | GOLD | BUY SETUP
📍 Buy Zone: 4620–4628
📊 Current Price: ~4666
🎯 Target Levels:
➊ TP1: 4695–4700
➋ TP2: 4720
➌ TP3: 4730
🛡️ Stop Loss: Below 4592
📈 Technical Analysis:
Gold continues to hold a bullish structure within the ascending trend channel. Price has respected the 4620–4628 support zone and is now pushing higher toward the previous resistance around 4695–4700. A clean breakout and sustained hold above 4700 could provide further bullish momentum toward 4720–4730.
The bullish setup
ETHUSDT 25/AUGEthereum – A Stronger Move, But More Downside Ahead?
Ethereum has recently shown stronger price momentum, reinforcing my belief that it could be one of the most interesting assets to watch in the next crypto cycle.
If the next cycle develops as expected, I believe Ethereum could potentially offer 10x+ upside from a future cycle bottom. However, before thinking about those targets, I believe the market may still have a significant bearish phase ahead.
Ethereum is currently trading around $2,50
Can Ethereum turn $2,430 into a launchpad? ETH is consolidating near $2,450 after a powerful rally from the $1,900 area. The price remains above the EMA 9 at $2,449 and SMA 50 at $2,430, while the volume profile shows strong activity around $2,424.
Institutional demand remains a key driver: U.S. spot Ethereum ETFs attracted approximately $697M over the week—the strongest weekly result of 2026.
▲ Holding $2,423–2,430 keeps the bullish structure intact and opens another attempt at $2,500–2,525.
▼ Losing $2,423 could send ETH toward $2,4
ETH/USD (1H) – Bullish Structure Intact, Eyeing Major ResistanceEthereum continues to respect bullish market structure on the 1H, with price holding above the recent demand zone (DZ) near $1,900 after a clean BOS. Price is now testing the $1,919–1,922 zone just below Major Resistance at ~$1,938.
Key level: Major resistance ~$1,938 — a break and hold above opens room toward $1,948+
TP1: ~$1,868
TP2: ~$1,835 (invalidation zone if structure breaks down)
Ethereum has turned super bullish! (1D)The father of altcoins, Ethereum, seems to have finally woken up from its winter sleep and is forming a triangle.
The recent rally appears to be Wave D of the triangle. After a move back down and a slight correction within the green zone, we expect Wave E to form and complete, followed by a bullish move toward the red box.
The buyers’ activity and momentum after such a long correction have been excellent. This rebound looks different from the previous ones, showing signs that the bullish move
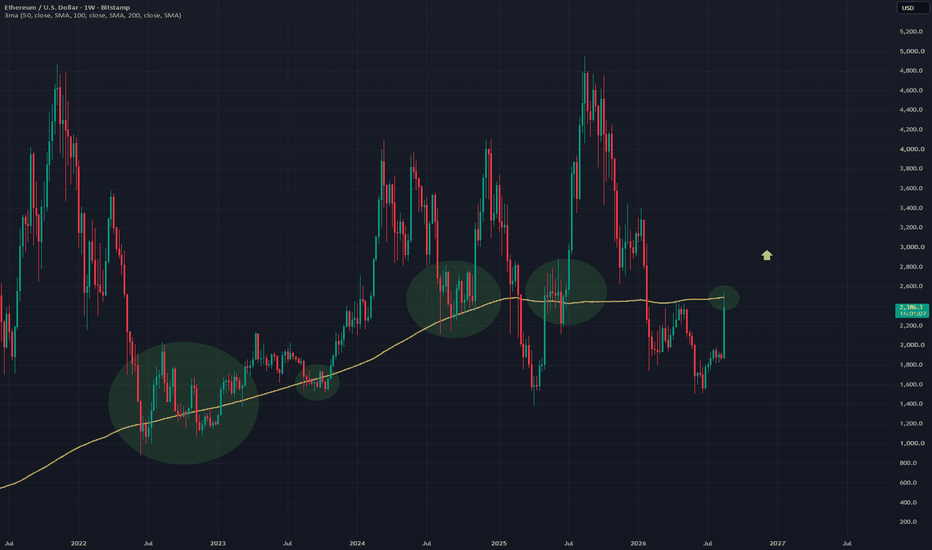
$ETH is showing a major shift in structure.Ethereum has broken out aggressively from its multi-month base and reclaimed a key former resistance zone. The move also pushed through the long-term moving average with strong volume, adding weight to the breakout.
The main thing I’m watching now is whether ETH can hold this reclaimed area on a pullback. A clean retest would turn previous resistance into support and strengthen the bullish continuation case.
The volume profile also shows a thinner area above the current range, meaning price co
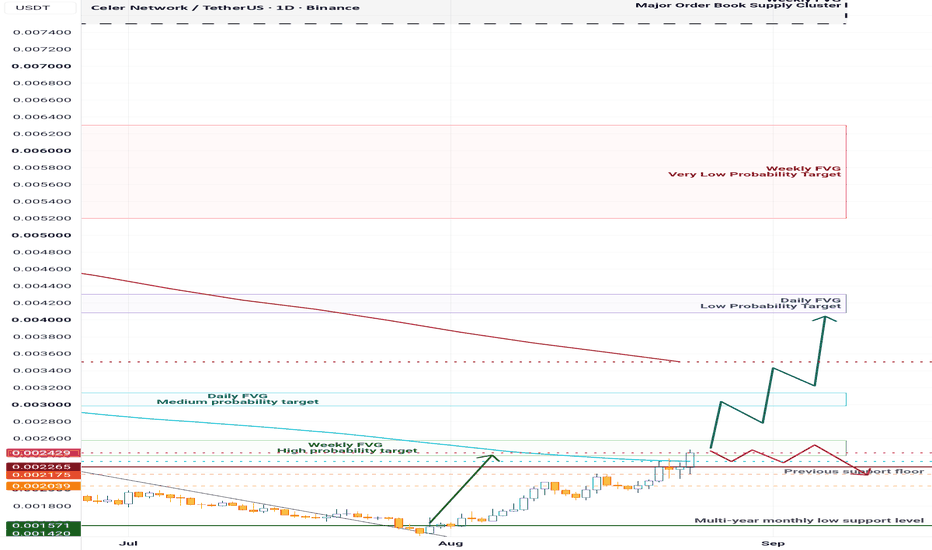
CELR Weekly Update: Downtrend breakout daily view.For the 5th weekly update tracking this idea I shall begin by reminding everyone to be cautious . The Celer Network Token (CELR) has experienced 4 weeks of uptrend reaching the High Probability Target Area ( HPTA ) with volume remaining within normal trading parameters for the token across exchanges.
With BTC sitting right below a key resistance level, caution, some profit taking and defensive posturing remains the wise choice. We return to a daily candle view as the time window available re
ETH: Does the 2,550 Breakout Really Support a 2,685 TP?I considered a long above the ascending channel midpoint and 2,550 resistance, using 2,560 entry, 2,685 TP, and 2,520 SL. But the evidence revealed hidden risk in where those levels sat, so I reassessed the setup and moved the entry, target, and stop.
The decisive flaw I found was structural: the 2,560 entry sits 10.6 above the unbroken 2,549.4 4h/1h resistance zone and the 15m trend extreme high, with no retrieved support or confirmed BOS to anchor the original setup.
I moved the entry to 2,4
Can Ethereum turn the short squeeze into a real breakout?Can Ethereum turn the short squeeze into a real breakout? 🚀
Ethereum has surged from below $1,900 to around $2,305, briefly gaining more than 20% and leaving late short sellers trapped. The first explosive phase is over; now ETH must prove that buyers are willing to defend the new price range.
🚀 Three catalysts behind the rally
▫️ Trump met with senior crypto executives and urged Congress to advance digital-asset legislation, strengthening expectations of a more supportive regulatory enviro
ETHUSD with support at 2387-2220 on dipsEthereum has seen a sharp reversal lower over the last two days from 2,546, which could mean that Ethereum has stepped into a new counter-trend movement. It could be another fourth wave, but of course, we have to be aware of a potentially deeper retracement here. We see some nice support around 2,338–2,220, where the market could stabilize and later see another jump higher for wave five. Also, when comparing the duration of wave two with the current wave four, there is a chance that the market c
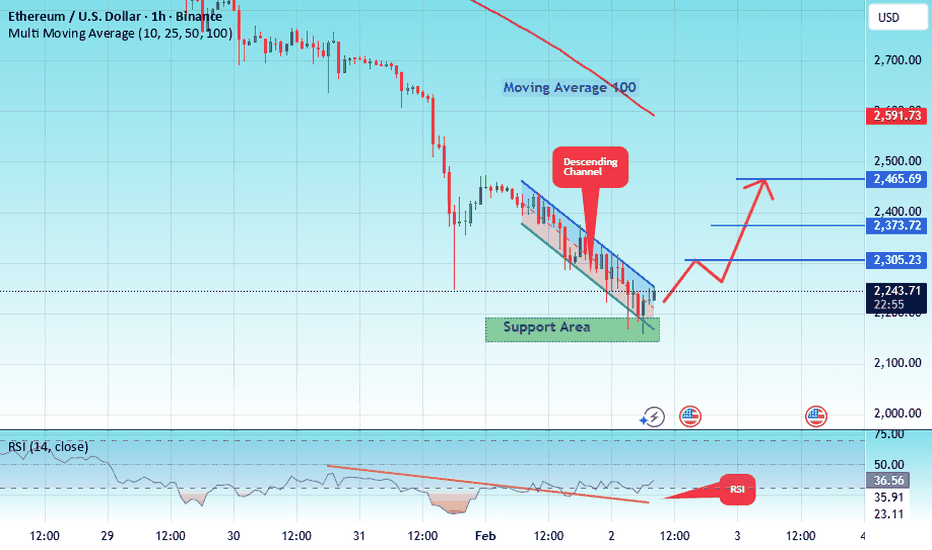
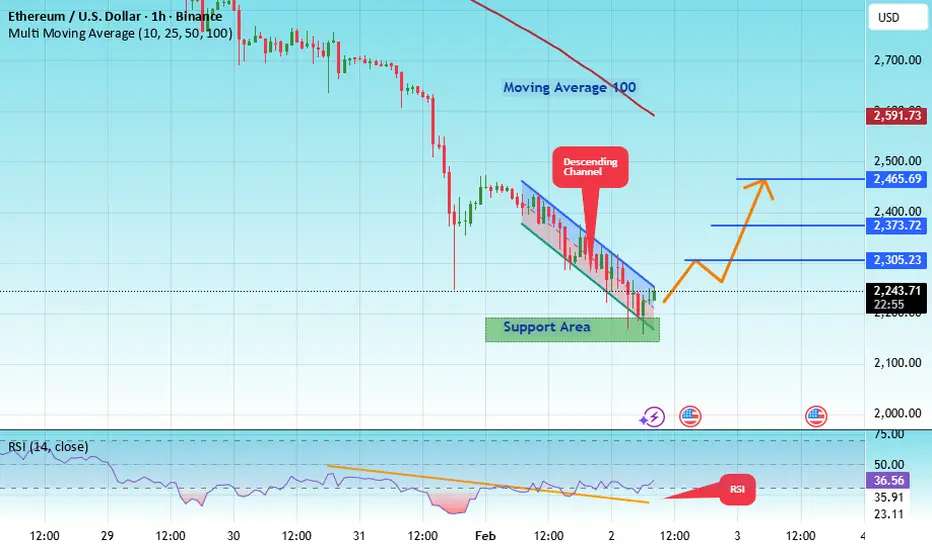
#ETH/USDT — Descending Wedge & High R/R Zone#ETH
The price is moving within a descending channel on the hourly timeframe. It has reached the lower boundary and is heading towards a breakout, with a retest of the upper boundary expected.
The Relative Strength Index (RSI) is showing a downward trend, approaching the lower boundary, and an upward bounce is anticipated.
There is a key support zone in green at 2164, and the price has bounced from this level several times. Another bounce is expected.
The indicator is showing a trend towards
#ETH/USDT may continue its trend after correction
#ETH
The price is moving within an ascending channel on the hourly timeframe. It has reached the lower boundary and is heading towards a breakout. A retest of this boundary is expected.
The Relative Strength Index (RSI) indicates a downward trend, and this trend is likely to continue due to the overbought condition.
There is a key resistance zone in green at 1882, and the price has bounced off this zone several times, making it a strong support level.
A consolidation trend is observed abov
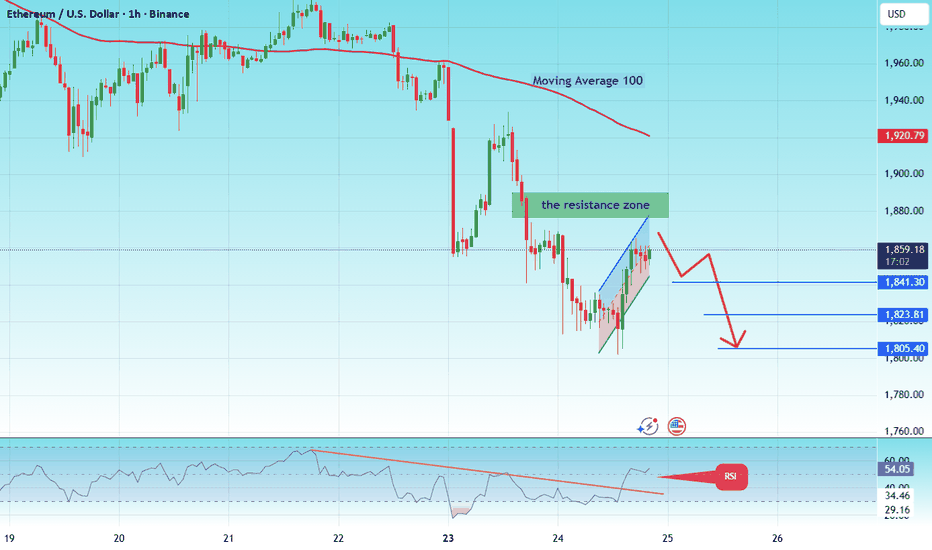
#ETHUSDT — Descending Wedge & High R/R Zone#ETH
The price is moving within a descending channel on the 1-hour timeframe and has reached the lower boundary. It is now poised for a bounce and is expected to retest this boundary.
The Relative Strength Index (RSI) indicates a downward trend, which is likely to continue given the overbought conditions.
There is a key support zone (in green) at 2253, and the price has bounced off this zone several times, making it a strong support level.
The price is trending towards the 100-period moving
$ETH Bullish Reversal: Ascending Triangle Breakout Target $3,300Description:
Ethereum ($ETH/USD) has broken out from a major ascending triangle pattern on the 1D chart after consolidating above key support near $1,950–$2,230. Following a sharp impulsive move upward, price is currently testing intermediate resistance around $2,430.
A healthy pullback/retest toward the $2,230–$2,400 horizontal support region would offer a high-probability entry for buyers. A confirmed hold of this retest zone opens the door for a continuation move toward primary overhead resi
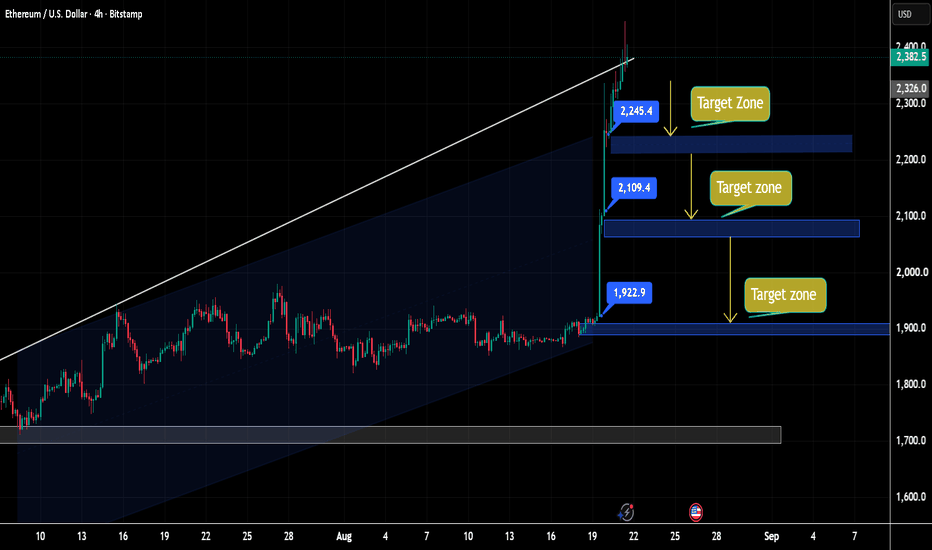
itle:** ETH/USD Bullish Breakout – Upside Targets in Focus**Title:** ETH/USD Bullish Breakout – Upside Targets in Focus
**Targets:**
🎯 Target 1: **$1,923**
🎯 Target 2: **$2,109**
🎯 Target 3: **$2,245**
ETH is showing strong bullish momentum after breaking above the previous resistance zone. As long as price holds above the breakout area, these levels can act as potential upside targets.
Ethereum Looking Good But Resistance Ahead!Trading Fam,
As I mentioned in my previous Bitcoin post, there are a couple of indicators I track closely to follow these longer-term 4-year cycles. One of them is the Pi Cycle Bottom indicator. When the faster-moving 150-day avg. (blue) crosses below the slower-moving 471-day avg. (red), the indicator triggers, and a bottom is likely near. On both Bitcoin and Ethereum, this indicator has always nailed the bottom within weeks or months.
For additional confirmation, I like to see a touch of the
Technical Analysis | Key Levels & Targets...Technical Analysis | Key Levels & Targets 📊
Price is currently around 198.61 JPY. The chart shows price holding above the marked support while trading inside a broader descending trendline structure.
📌 Resistance Levels
• R1: 199.00–199.10
• Major Resistance: 199.50–199.60
📌 Support Levels
• S1: 198.00–198.10
• S2 / Target Zone: 196.70–197.10
🎯 Bullish Targets
If price breaks and holds above 199.00–199.10:
• Target 1: 199.10 🎯
• Target 2: 199.50 🎯
• Target 3: 199.60 — Major trendline resist