GOLD - Local correction before growth ICMARKETS:XAUUSD is making new highs, but toward the end of Friday’s trading session, the market entered a local correction phase amid profit-taking. The market remains in a local bullish phase
The dollar is stagnating again after its sharp decline, with no change in market structure. Technically, the bearish move could continue
Gold is forming a correction within its bullish phase. The current liquidity-hunting phase could soon give way to another bullish impulse.
Next week, the main focu
Bullish Divergence
BITCOIN - Correction before a rally to 83000BINANCE:BTCUSDT.P , amid the current market euphoria and a shift from consolidation to distribution, is testing the 80K resistance area. Locally, there are bullish conditions, but strong resistance lies ahead
The market entered a rally phase following the crypto summit held at the White House. Is Trump once again engaging in pre-election manipulation???
Technically, Bitcoin is breaking out of its year-long bearish trend, with news acting as the main catalyst for the move.
The 67,200–60,000
How will gold perform in the new week?Based on the new chart, the XAU/USD structure is still strongly bullish, but price has entered an area where risk management is important because there is a clear combination of resistance + Fibonacci Extension above.
🔴 Resistance
1. 4,580 – 4,600
This is the nearest short-term resistance above the current price.
Price is currently reacting around this area and showing signs of consolidation.
If price breaks out clearly and closes above this zone → the probability of continuing toward the 4,7
USOIL 4H — Market Structure & Key Reaction ZonesUSOIL is currently showing a recovery from the broader support area, with price recently breaking above short-term structure and moving back toward the 86.60 region.
The chart highlights several important liquidity and imbalance areas that may influence upcoming price action.
🔹 Key Technical Levels:
Current Area: Price is testing a key resistance/liquidity region near 86.60.
LQ Sweep & BOS: The recent structure shows a liquidity sweep followed by a bullish break of structure, supporting the c
XAUUSD 4H — Bullish Structure with Key Reaction ZonesXAUUSD remains supported by a bullish 4H market structure after breaking above the previous descending trendline and printing multiple BOS (Break of Structure) signals.
Price is currently trading near a short-term premium area after a strong bullish expansion. The 4H FVG around 4,360–4,420 is an important reaction zone, while the 4H OB around 4,320–4,360 and the broader 4H Demand Zone around 4,230–4,280 remain key areas below.
🔹 Bullish Scenario: If buyers defend the current structure and pric
Will there be a correction?🔴 Resistance
1. 4,575 – 4,585
This is the nearest short-term resistance zone above the current price.
Price has already shown signs of rejection around this area.
If price breaks out decisively and closes above this zone, the probability of further upside will increase.
2. 4,595 – 4,610 — Strong Resistance
This is the Resistance Zone marked on the chart.
The main target of the current bullish structure is around 4,600.5.
If price reaches this area, it is better to observe the reaction rather
XAUUSD: ABC Correction After Wave 5
Gold has reached the upper Elliott wave 5 area after a strong bullish recovery. From Kelly’s view, the main trend is still strong, but price may need an ABC correction before the next clean bullish setup appears.
⟡ Market structure
The chart shows gold pushed sharply from the lower base and is now reacting near 4,600.
This area is close to the End wave 5 zone around 4,640–4,670, so short-term hesitation or rejection is normal.
If gold cannot break higher directly, price may start an ABC co
XAUUSD: Pullback Before Wave 5 Rally
Gold is still holding a bullish Elliott structure after a strong recovery from the lower zone. From Kelly’s view, the current move suggests that XAUUSD may be preparing for wave 5 continuation, but price may need a short correction first before the next upside leg becomes cleaner.
⟡ Market structure
The chart shows gold pushed strongly from the 4,320 area and broke higher into the 4,500 region. Price is now reacting near 4,488 after slowing below the short-term resistance around 4,515–4,525.
HYPEUSDT - ATH Retest. Consolidation Before a Rally?BINANCE:HYPEUSDT.P is testing its ATH (all-time high), while the market is becoming increasingly euphoric. The main catalyst is the crypto summit at the White House. Another pre-election move by Trump?
The cryptocurrency market is in a state of euphoria. Bitcoin has most likely completed its bearish cycle. However, a strong rally could be followed by a correction, and a short squeeze — for example, in the 80K–83K area — could trigger a 30–40% pullback.
HYPE is outperforming the broader mar
GOLD - The Hunt for Liquidity Ahead of the Rally ICMARKETS:XAUUSD , within a news-driven distribution phase, is testing the 4,525 D1 level and is bouncing back toward support in search of liquidity
The Dollar Index continues to decline sharply, providing support for gold. However, caution is warranted given the current fundamental and geopolitical backdrop.
Gold’s bullish bias should remain intact unless we see a sharp rise in oil prices or a hawkish shift from the Fed.
The nearest areas of interest and liquidity are 4,480 (4,472)–4,450
$ETH Bullish Reversal: Ascending Triangle Breakout Target $3,300Description:
Ethereum ($ETH/USD) has broken out from a major ascending triangle pattern on the 1D chart after consolidating above key support near $1,950–$2,230. Following a sharp impulsive move upward, price is currently testing intermediate resistance around $2,430.
A healthy pullback/retest toward the $2,230–$2,400 horizontal support region would offer a high-probability entry for buyers. A confirmed hold of this retest zone opens the door for a continuation move toward primary overhead resi
FLT — Bullish Divergence at a Key Support ZoneFLT is setting up nicely on the 1H chart. Price has pulled back into a tightening wedge right around the 0.618 Fibonacci retracement at ~$12.46, while forming bullish RSI divergence. There’s also good confluence from the rising trendline and the previous breakout/resistance area around $12.45–$12.65.
For the shorter-term trade, I’m watching for price to hold this area, form a higher low and break the descending wedge. A confirmed break would put $12.73 and then $12.99 in play initially, with th
GBPUSD 1H | Bullish Structure & FVG RetestGBPUSD continues to print a bullish 1H market structure, with multiple BOS formations and a rising trendline supporting the current directional bias.
🔎 Structure
• 🟢 Multiple BOS formations confirm higher-high / higher-low development
• 💧 Previous liquidity sweeps provided fuel for the upside expansion
• 🚀 Price recently displaced above the 1.3620–1.3630 structural area
• 📈 The bullish trendline remains respected
🟩 1H FVG + OB
The 1.3600–1.3625 area is the nearest marked 1H FVG + OB.
A contr
XAUUSD — 4,591 Breakout, 4,646 Next Test?
Gold is showing a very strong bullish structure after breaking above the previous resistance area.
Price is now trading around 4,590 - 4,600, right above the 1.0 Fibo zone near 4,591.
This is a powerful breakout.
But after a strong move, I still do not want to chase the candle blindly.
The simple read
The key level now is 4,591.
If gold holds above 4,591, buyers may try to continue toward the next Fibo extension zone around 4,646.
That 4,646 area is important because it can become the f
XAGUSD 1H — Market Structure & Liquidity AnalysisMarket Structure 📊
Silver is currently showing a bullish 1H structure following a strong displacement from the 62.60–63.00 area. Price has formed multiple BOS (Break of Structure) events, confirming continued bullish order flow.
The recent expansion pushed price toward the 69.40–69.60 area, so chasing the move may carry higher risk. A retracement into the marked imbalance zones could provide a cleaner area to observe price reaction.
Key Areas of Interest 🎯
1H FVG + Order Block
68.00–68.37
T
XAUUSD — 4,500 Is the Gate to 4,650?
Gold is showing a strong bullish structure after breaking above the previous resistance zone.
The market pushed sharply from the lower support area and is now trading around 4,480 - 4,500, right under the short-term breakout line.
This is where the chart becomes very interesting.
The trend is bullish.
But after a strong move, I still do not want to chase the candle.
I want to see if buyers can defend the new structure.
The simple read
4,500 is the first important gate today.
If gold br
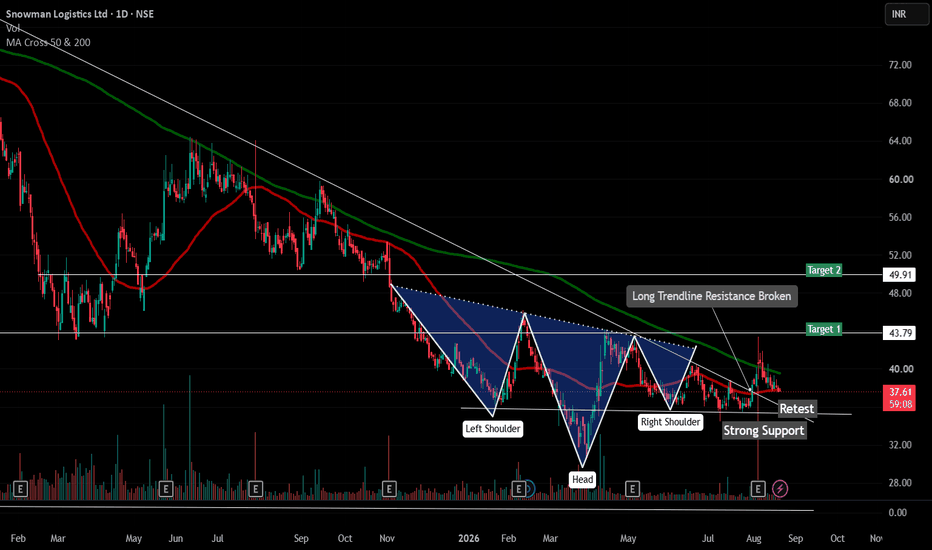
Snowman Logistics: Technical Setup Looking InterestingSnowman Logistics has formed an **Inverse Head & Shoulders** pattern and has broken above a long-term trendline resistance, followed by a retest of the breakout zone.
The stock is also showing a **higher-high and higher-low structure**, which keeps the technical setup constructive.
For a swing-trading perspective, I have identified **two reasonable upside targets**, with a potential timeframe of around **15 days to 2 months**.
This is **only my personal view and not a buy/sell recommendation*
HYPEUSDT - A Pullback Before a Bull Run BINANCE:HYPEUSDT.P is forming a local bullish setup. The altcoin is outperforming the broader market, including Bitcoin, and for this reason, the coin has further upside potential
Bitcoin, meanwhile, remains neutral within a consolidation that has been developing for several months as part of the broader global bearish market.
HYPE maintains its global bullish trend, within which a 53.0–75.0 trading range is forming. The range is relatively wide, and the bounce from support opens up a medi
USD/JPY Bearish Triangle Breakdown | Sellers Target 155.48
USD/JPY on the **1-hour timeframe** has confirmed a **bearish breakdown** from a symmetrical triangle pattern after multiple tests of converging trendlines. The rejection at the triangle apex signals weakening bullish momentum and increasing selling pressure.
The sharp move below the lower trendline confirms the breakout, shifting market sentiment in favor of the bears. If price remains below the broken support, the next downside objective is **155.48**, which aligns with the projected measure
EURUSD: Bullish Breakout & Retest towards 1.1800 TargetOverview:
EUR/USD has recently shown strong bullish momentum, breaking out above a key horizontal resistance level near 1.1650. The overall daily structure continues to form higher highs and higher lows along an ascending trendline.
Technical Key Points:
Trend : Strong bullish continuation supported by a rising trendline starting from the July lows.
Breakout Level: The pair has pushed past the immediate horizontal level around 1.1650.
Support : Former resistance around 1.1600–1.1650 is ex
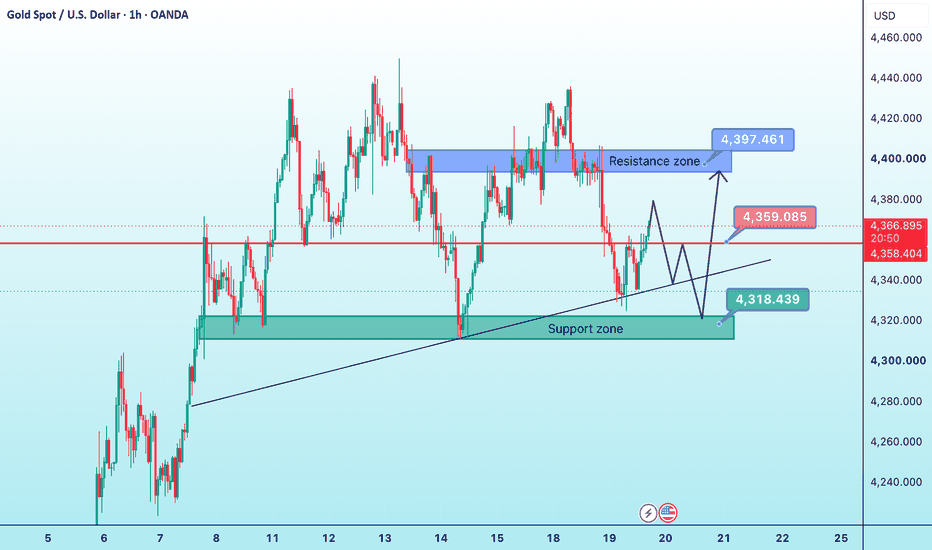
How Will Gold Perform Ahead of the FOMC Announcement?XAUUSD – H1 | Technical Update
Current Price: ~4,367
* 🔵 Major Resistance: 4,395–4,400 — Strong supply zone where price has been rejected multiple times.
* 🔴 Key Level: 4,358–4,360 — Short-term pivot; price is currently holding above this zone.
* 🟢 Major Support: 4,310–4,320 — Demand zone + ascending trendline confluence.
* 📈 Trendline: Still valid, but price is currently recovering after the decline from 4,400.
Main Scenarios
🟢 Bullish:
If price holds 4,358–4,360, then breaks and closes an
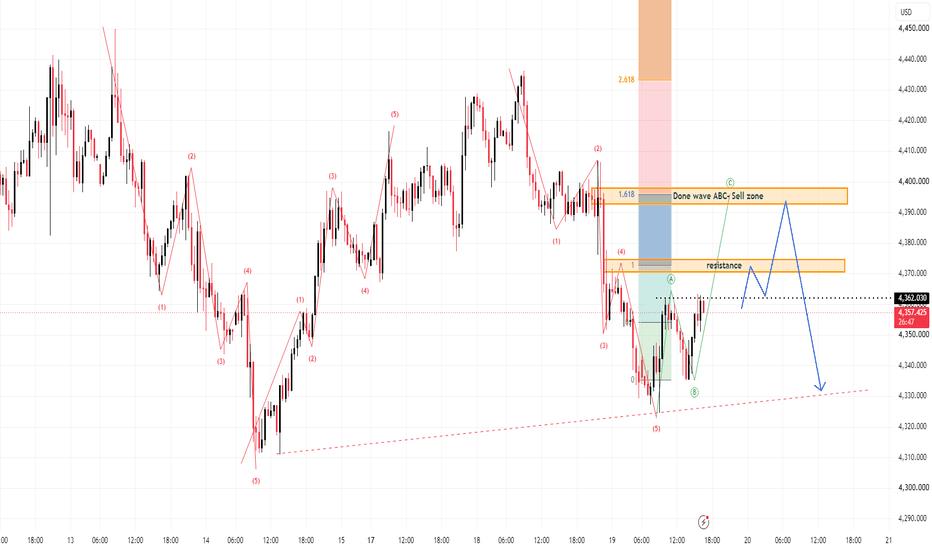
XAUUSD – ABC Rebound Before Bearish RotationGold is holding a short-term recovery structure after bouncing from the 4,320 area, but this move still looks more like an A-B-C rebound than a full bullish reversal. From Kelly’s view, price may continue pushing higher first into resistance, then face renewed selling pressure once the corrective structure is completed.
⟡ Market structure
The chart shows a completed selloff into the 4,320–4,330 region, followed by a rebound forming an A-B-C pattern.
Wave A has already pushed price back above 4