Bullish Trend Line
Microsoft Tests New Highs Near $514Market View - Microsoft Tests New Highs Near $514: Breakout Continuation or an Overextended Advance?
Microsoft is in a bullish structure on the four-hour chart. After forming a major low near $350 in late June, price recovered through a sequence of higher lows and higher highs. The advance accelerated at the end of July, when price moved sharply above the previous $400–$430 range and established a new trading area above $480.
The short-term trend is also bullish. The pullback from approximate
Gold is currently trading with a well-defined bullish frame workXAUUSD (Gold) – 1H Technical Analysis
Market Structure: Bullish Bias from Key Support Zone
Gold is currently trading within a well-defined bullish framework on the 1-hour timeframe. Price has retraced into a significant demand area around 4455–4460, where horizontal support converges with an ascending trendline. This technical confluence increases the probability of a bullish reaction should buyers successfully defend the zone.
Technical Indicators
EMA 20: 4484.33
EMA 50: 4493.74
EMA 200: 45
INTC – What Price and Volume Are Telling Us ?INTC - CURRENT PRICE : 37.40 - 37.60
INTC is currently undergoing a controlled pullback within a broader rising structure, as indicated by the rising trendline support (white dashed line). Notably, the recent price decline is accompanied by diminishing volume, which suggests that selling pressure is losing momentum rather than aggressive distribution.
This type of price-down / volume-down behavior typically reflects profit-taking and short-term exhaustion by sellers, often seen during health
CADCHF Channel Rise in Motion: Buyers Target 0.5790CadChf price has been moving cleanly inside this rising channel, showing strong bullish structure with consistent higher highs and higher lows.
Buyers are now testing the resistance zone and momentum remains in their favor.
I expect a continuation toward 0.57900, the next projected level near the top of the channel.
As long as the structure holds above the midline of the channel, buyers remain in control, driving the next leg of the uptrend.
Demand Zone in Focus: MSS Shift Signals Potential LongHello Traders,
Wishing everyone a productive week ahead! Today, price action is sitting at a clearly defined demand zone, and we’ve just seen a shift in market structure (MSS). Based on this, I’m looking to go long from the potential demand area.
However, keep in mind there’s still a strong external bearish trend. For added confirmation, consider waiting for a break of the last lower high (LH) before entering a long position.
Stay sharp and trade safe! 💪
$VIX We only just started! Volmageddon 2.0Zoom out on the VIX and you'll find that there is A LOT more runway. Study the VIX for the last 30 years and you'll find that it bottoms out and explodes. We are not at a turning point in the markets with ultra high "hot air balloons" that will come down with a correction that is long overdue. The VIX hasn't been this low in a very long time, so you want to keep the proxy CBOE:UVIX in your radar. Happy trading! Always look to make lemonade out of lemons :)
Bullish Breakout on CAMS: Buy Opportunity Above TrendlineBuy: ₹4,015–₹4,020 (above breakout candle and 200 EMA)
Target: ₹4,270 (September 2025 price target with bullish technicals)
Stoploss: ₹3,940 (below 200 EMA and recent support)
Technical Highlights
CAMS has broken above a major descending trendline and the 200 EMA, signaling a bullish breakout.
RSI is 62, indicating momentum but still below overbought levels.
Volume confirms the breakout strength, with the price supported by analyst targets for September 2025 at ₹4,269.
BTC/USD 4H Chart Review1. Growth channel (orange lines)
• The price moves inside the growing channel.
• Currently testing the upper part of this channel → potential resistance.
2. Horizers of support and resistance (red and green lines)
• Support:
• $ 111 632
• 110 019 $ (key support, breaking down can deny an upward trend).
• resistance:
• $ 113 255 (local, currently tested).
• 115 197 $
• 117 416 $ (strong target resistance in the channel).
3. STOCHASTIC RSI (bottom of the chart)
• The oscill
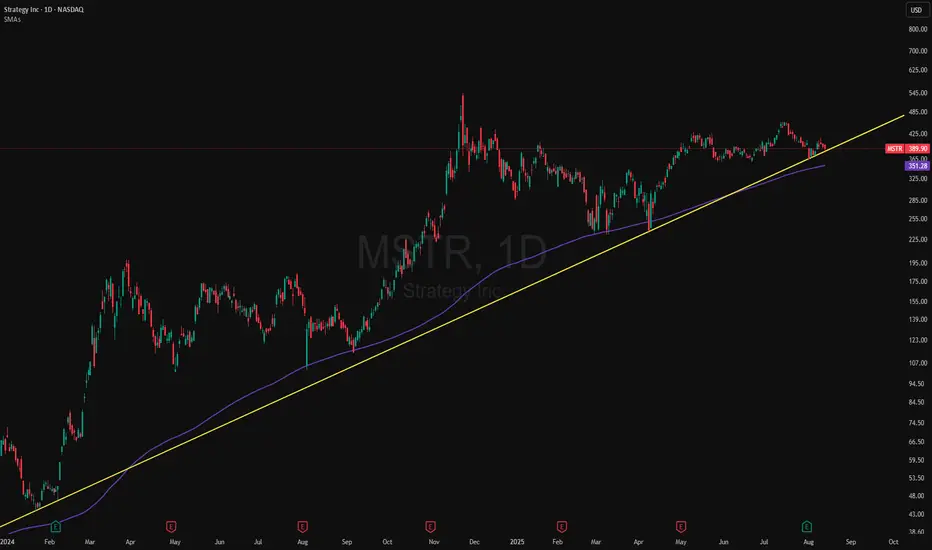
MSTR Holding the Line: Support Tested AgainMSTR (MicroStrategy) continues to respect its ascending trendline, a bullish sign showing buyers remain in control.
Technical Points:
Price tapped the trendline support for the fourth time and bounced, confirming its strength.
Volume remains stable during pullbacks, suggesting these dips are being absorbed by buyers rather than panic selling.
As long as MSTR holds above $1,400 (trendline + previous support zone), the bullish structure remains intact.
Next targets: $1,600, then $1,750, with
DXY Targeting Liquidity Zones & Gap Fill Before Potential ReversThe U.S. Dollar Index (DXY) is showing a strong bullish push, climbing steadily along an ascending trendline. Price appears to be heading toward key liquidity levels and a visible Fair Value Gap (FVG) near the previous New York high. The chart also highlights an unfilled gap above, which aligns with a potential liquidity sweep scenario.
Once these upper zones are tapped — including the liquidity and imbalance areas — a significant rejection could follow, especially considering ongoing strength
$FET Ascending Triangle Incoming PUMP? 1 Hour Time FraNYSE:FET 1Hr Time Frame
📝 Technical Analysis:
FET is currently forming an ascending triangle pattern, a typically bullish continuation structure. This pattern is developing after a clear retest of the demand zone between $0.7038 and $0.7390, which previously acted as a strong support area.
✅ Key confirmations:
- Two clear rejections from the lower boundary of the ascending triangle, suggesting strong buying interest.
-A break of the previous bearish trendline, shifting market sentimen
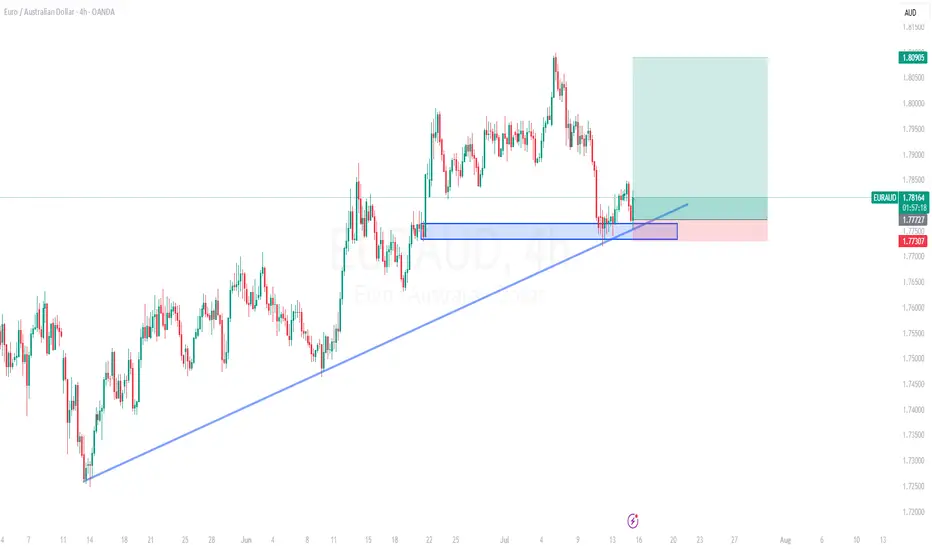
CADCHF- Another way to Look at BULLISH BIAS - 5 Strong Reasons Strong confluences on 1D time frame for the Bullish BIAS on this pair.
1- RSI divergence
2- Formation of HH and HL
3- Bullish Trend Line
4- Hammer Candle stick pattern formation
5- Double Bottom
we anticipate the market to remain in Bull phase.
Entry point is market with TP1 and TP2 as R:R of 1:1 and 1:2 respectively. Keep you Stop loss slightly below the Double Bottom (Support line)
KRDI Egypt is expected to target 0.65 then 0.75Daily chart,
the stock EGX:KRDI has been trading above a rising trend line since Oct 2024. I see the price will rebounce from the current level 0.600 to test the resistance line R1.
After crossing R1 line at around 0.650 - 0.658, the next target will be R2 (around 0.750 - 0.760).
Technical indicators: RSI and MACD still need confirmation for a new entry (buy)
Note: A Resistance level at 0.670
Consider Stop Loss below 0.600 (closing)
Road to 3200Gold had a strong 4hr timeframe rejection from the 2960-2980 zone.
Also had a triple bottom in the same area.
Showing super strong signs of another bullish run.
Gold is making the strong move up to the 3140 area once 3100 is broke.
Should get a small rejection off the 3140 zone before a strong push up to a new all time high.
Next all time high goal is 3200 🚀
Short Notes:
•Run up to 3140 (Small rejection/load up zone)
•Then Load up zone 3110-3100
•Take Profit area 3200
A
#1000CHEEMSUSDT is setting up for a breakout Long BINANCE:1000CHEEMSUSDT.P from $0,0014000
🛡 Stop loss $0,0013740
1h Timeframe
⚡ Plan:
➡️ POC is 0,0013254
➡️ Waiting for consolidation near resistance and increased buying activity before the breakout.
➡️ Expecting an impulsive upward move as buy orders accumulate.
🎯 TP Targets:
💎 TP 1: $0.0014380
💎 TP 2: $0.0014700
🚀 BINANCE:1000CHEEMSUSDT.P is setting up for a breakout—preparing for an upward move!
1Long
#1000XUSDT is setting up for a breakout📉 Long BYBIT:1000XUSDT.P from $0,05470
🛡 Stop loss $0,05297
1h Timeframe
⚡ Plan:
➡️ POC is 0,04229
➡️ Waiting for consolidation near resistance and increased buying activity before the breakout.
➡️ Expecting an impulsive upward move as buy orders accumulate.
🎯 TP Targets:
💎 TP 1: $0,05640
💎 TP 2: $0,05775
🚀 BYBIT:1000XUSDT.P is setting up for a breakout—preparing for an upward move!
1Long
Gold (XAUUSD) Breakout Setup – Targeting $3,014Gold is showing strong bullish momentum on the 1H timeframe, forming a breakout structure with a well-defined resistance and support zone.
Key Levels:
📌 Resistance: Around $2,940 (previous rejection zone)
📌 Support: Around $2,900 (previous consolidation zone)
📌 Target: $3,014 (+3.16% move)
Technical Analysis:
🔹 Gold recently broke out of a bullish flag pattern after a strong uptrend.
🔹 Price successfully retested the support zone and is now pushing higher.
🔹 A breakout above $2,940 could t
#STPTUSDT maintains bullish momentum📈 LONG BYBIT:STPTUSDT.P from $0.10355
🛡 Stop Loss: $0.10226
⏱ 1H Timeframe
✅ Overview:
➡️ BYBIT:STPTUSDT.P is showing strong bullish momentum after consolidating at lower levels, indicating buyer presence.
➡️ Volume Profile suggests that the main liquidity (POC) is positioned significantly below the current price, confirming demand dominance.
➡️ A breakout above $0.10355 and holding above this level will validate the bullish continuation.
➡️ The nearest resistance zone is between $0.10540
SLong
#APEUSDT remains bullish📈 LONG BYBIT:APEUSDT.P from $0.7715
🛡 Stop Loss: $0.7640
⏱ 1H Timeframe
✅ Overview:
➡️ BYBIT:APEUSDT.P is showing strong upward momentum, breaking through resistance levels and heading toward a new liquidity zone.
➡️ POC (Point of Control) at $0.6958 – a key volume area that acted as an accumulation zone before this move.
➡️ The price has broken out of consolidation and is approaching $0.7820 – $0.7910, where resistance was previously observed.
⚡ Plan:
➡️ Enter long after a breakou