Doji Candle: Why Indecision Only Matters in the Right PlaceImagine you are long. The market has climbed for six straight days, from 65,000 to 73,000. Today’s candle opens and closes at almost the same price, a thin cross with shadows on both sides. Every beginner’s guide you have read says this is a reversal warning. You close the long, or worse, open a short. Tomorrow price is 75,000 and the rally continues without you.
The doji did not lie. It said exactly one thing, that buyers and sellers ended the day in balance, and you heard a second thing it nev
Candlestick Analysis
EURAUD: Bearish Continuation 🇪🇺🇦🇺
EURAUD looks bearish after a retest of the recently broken horizontal structure.
A double top pattern formation on an hourly time frame indicates strong selling pressure.
Expect a retracement to 1.59215
❤️Please, support my work with like, thank you!❤️
I am part of Trade Nation's Influencer program and receive a monthly fee for using their TradingView charts in my analysis.
GBPNZD: Confirmed Liquidity Sweep 🇬🇧🇳🇿
I see a valid sell-side liquidity sweep on GBPNZD on an hourly time frame.
The pair will likely continue rising after a confirmed bullish change of character.
Goal - 2.3496
❤️Please, support my work with like, thank you!❤️
I am part of Trade Nation's Influencer program and receive a monthly fee for using their TradingView charts in my analysis.
Nikkei 225 Bears Eye 60,000, Though Oversold Signals BuildThe Nikkei closed lower for a second week, marking its worst two-week decline since March at 5.9%. Yet with support found around the 200-day EMA and SMA, there may be scope for a bounce. Friday’s bullish pinbar also formed on high volume, suggesting a potential shift in control from bears to bulls, while the low respected the July closing low. The daily RSI (2) is also heavily oversold, although it has not formed a bullish divergence.
At a minimum, bears may want to tread with caution around th
The Top 3 Assets To Trade From FREE Market CapitalismHi am Lubosi Forex and am
going to share with you how to trade.
Its taken me about 3 and
a half months to collect this data
and let me tell you it was worth the wait
because am goning to share with you
the top 3 assets to trade:
-NASDAQ CAPITALCOM:NAS100
-SP 500 TVC:SPX
-DOW JONES CAPITALCOM:US30
These 3 assets are the only
assets i will
focuss on sharing from now own
eventhough i will keep testing
the stock market
for other strategies.
and a bonus asset: INDEX:BTCU
BNBUSDT Analyses-76, October 25, 2026
Welcome to my page! I share daily technical analyses of crypto and other charts here.
BINANCE:BNBUSDT
🔍 Market Structure Analysis:
BNB is showing a short-term bullish recovery on the 1H chart. Higher local lows and the reaction from the 730.19 support area support the bullish setup.
🎯 Entry & Exit Signal:
Buy Entry: 739.57
Stop Loss: 736.02
Targets: 746.67 R/R:2 - 748.01
Key Support & Resistance:
Key Resistance: 740.52 / 748.01
Key Support Area: 737.89 / 730.19 / 722.61
EURUSD: High Chance for a Pullback 🇪🇺🇺🇸
EURUSD looks bullish after the last test of a strong intraday horizontal support cluster.
The price violated a falling trend line and closed, forming a strong bullish candle.
The market will likely continue rising and reach 1.122 level.
❤️Please, support my work with like, thank you!❤️
I am part of Trade Nation's Influencer program and receive a monthly fee for using their TradingView charts in my analysis.
GTLY consolidating beneath a low-volume zoneI hold LSE:GTLY and I’m still nursing a loss from around 105p. I can’t part with it yet. The dividend is still decent, even after the final was cut to 2p, and I believe it’s picking up plenty of work in the AI data centre space. That space is riddled with red tape and legal cases, because locals don’t want to live next to a warehouse full of servers whirring away.
In January I noted that Gateley estimated pre Budget uncertainty knocked about £3m off first half revenue, which it expected to re
Ethereum inner resistance broke by Asian sessionEthereum has shown when most retail traders are doubling down on price moving one way institutions are always going to bet against you. The Asian session used short side buy stops as liquidity to blast through the inner resistance and will be moving higher from what price action is reading on lower timeframes. Might be the same breakout move from June to head towards higher prices but the move is still early so time will tell.
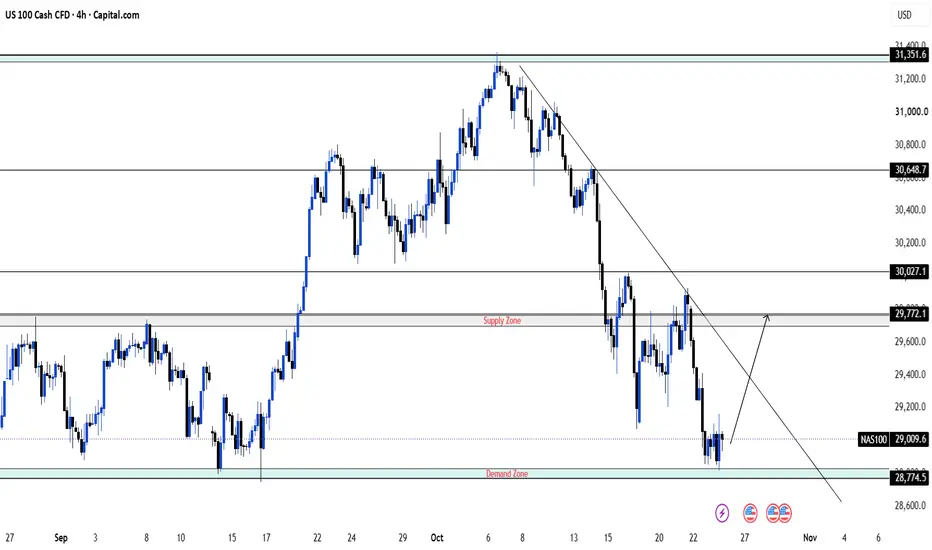
NASDAQ📉 NAS100 – Bears Still in Control, But Bulls Are Fighting Back! 🐻🐂
Price remains in a bearish trend, printing lower highs and lower lows beneath the descending trendline. However, buyers are defending the 28,774 demand zone , with a potential push toward the 29,772 supply zone.
🎯 Key Levels
- 🟢 Demand: 28,774
- 🔴 Supply: 29,772
- ⚠️ Resistance: 30,027
📌 Trade Scenario:
- Bullish: A strong reaction from demand could trigger a relief rally toward 29,772 . A breakout above the descendi
Bitcoin 4H Advanced Market Structure AnalysisWelcome traders to this comprehensive institutional-grade market analysis of Bitcoin on the 4-hour timeframe. In this detailed breakdown, we examine the interplay between market structure shifts, liquidity pools, fair value gaps, rejection blocks, and precise entry execution strategies. The objective of this analysis is to provide a complete roadmap of current price delivery without unnecessary complexity. ⚡
Market Structure and Change of Character (CHoCH) 🔄
The chart highlights critical
BTC: Dip First, Then 90KBitcoin CME Futures (1D)
The higher time frame structure is bullish. Short term, I see two possible paths, and both lead to 90K.
Scenario 1 (primary): shallow pullback
Price pulls back into the 78,600 – 79,825 zone, where several VWAPs and support levels converge.
A bounce from this zone confirms buyers are defending it, and the move toward 90K begins from there.
Scenario 2: deeper sweep
Price drops to 74,780 and takes the stop losses sitting below the recent major low.
A fast reclaim after
XAU/USD | Gold Breaks Below $4075! Is $4000 the Next Target?By analyzing the #Gold chart on the 4H timeframe, we can see that our bearish scenario has continued playing out exactly as expected! After struggling around $4120 , sellers regained control and pushed Gold sharply lower, hitting all three of our previous downside targets at $4100, $4080, and $4075 . Price is now trading around $4059 .
More importantly, the $4075 – $4120 bullish order block that previously supported Gold has now failed to hold. The latest bearish displacement has also push
BTC/USD | BTC Back in the Demand Zone! More Bullish Move Ahead?By analyzing the #Bitcoin chart on the weekly timeframe, we can see that after recovering toward $86,000 , BTC faced renewed selling pressure and started correcting again. Price has now returned to the important demand zone we highlighted in our previous analysis and is currently trading around $81,655 .
The $80,500 – $82,400 area remains an important zone for buyers. Bitcoin is once again testing this region, and although the recent correction has weakened the short-term bullish momentum,
EURUSD LONGMarket structure bullish on HTFs DH
Entry at both Weekly and Daily AOi
Weekly Rejection at AOi
Daily Rejection At AOi
Previous Daily Structure Point
Around Psych Level 1.12000
Touching EMA
H4 Candlestick rejection
Rejection from Previous structure
TP: WHO KNOWS!
Entry 100%
REMEMBER : Trading is a Game Of Probability
: Manage Your Risk
: Be Patient
: Every Moment Is Unique
: Rinse, Wash, Repeat!
: Christ is King
This trade could give us a good 20% of marketprice movementADA is a textbook example of how to get ready for a setup instead of chasing one. The bullish structure is intact, price is back at the lows, and the next move decides the trade.
🟠 Why This Level Matters
The trend is still bullish, and price has pulled back into the higher-low zone where buyers have stepped in before. This is the level that confirms whether the structure holds or breaks, so whatever happens here sets the direction for the next leg.
🟠 Gameplan / Primary Scenario
The primary
NZDJPY: Confirmed CHoCH 🇳🇿🇯🇵
NZDJPY looks bullish after testing the major intraday horizontal support.
The valid bullish change of character that occurred on an hourly time frame confirms the strength of the buyers.
Expect a bullish move to 89.55 level.
❤️Please, support my work with like, thank you!❤️
I am part of Trade Nation's Influencer program and receive a monthly fee for using their TradingView charts in my analysis.
NQ Power Range Report with FIB Ext - 10/23/2026 SessionCME_MINI:NQZ2026
- PR High: 29165.75
- PR Low: 29090.00
- NZ Spread: 169.25
Key scheduled economic events:
09:45 | S&P Global Services PMI
- S&P Global Manufacturing PMI
Session Open Stats (As of 2:25 AM)
- Session Open ATR: 525.21
- Volume: 80K
- Open Int: 290K
- Trend Grade: Neutral
- From BA ATH: -7.9% (Rounded)
Key Levels (Rounded - Think of these as ranges)
- Long: 32282
- Mid: 29785
- Short: 27288
Keep in mind this is not speculation or a prediction. Only a report of the Power