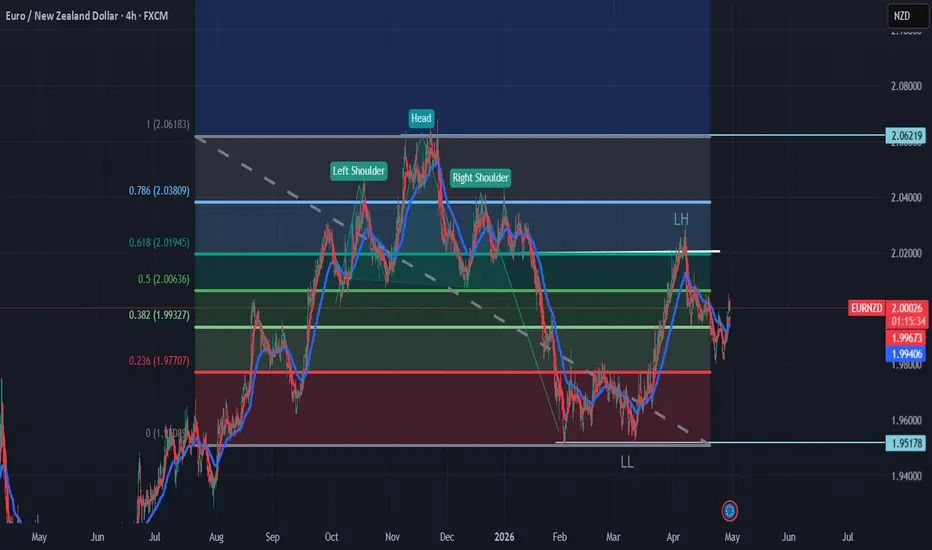
Trading the Shift to SupportI’m looking at a high-probability move back to support on the EURNZD. After a clean Head and Shoulders pattern played out, price retraced perfectly into the sweet spot zone (0.618 Fibonacci level) and rejected it.
Technical View: The recent price action established a clear Lower High (LH) at that Fib level. With the momentum shifting, I am assuming we are now on the path to create a new Lower Low (LL).
Correlation Confirmation: This move aligns with the bearish EURAUD structure I was
Head and Shoulders
Chuck's coin teetering on the brink of a dramatic plunge to 9cCardano, along with many other high market cap tokens, certainly stands out.
As we find ourselves in the crypto bear market,
I would argue that we have actually been in one for quite some time now.
The rapid declines can catch newcomers off guard.
Meanwhile, those who have weathered several cycles tend to quietly withdraw and wait for BTC to undergo its usual year-long downturn.
Will BTC hit a bottom again next November, similar to the previous four-year cycles?
The odds still seem to favor a
XAUUSD (GOLD) Analysis – Bullish Setup in Progress#Gold is currently consolidating on the higher time frames, trading within a sideways range. However, on the 4H chart, an Inverse Head & Shoulders pattern is developing, which is typically considered a bullish reversal/continuation structure.
At the moment, there are no significant bearish signals indicating a downside move. The key level to watch is the neckline resistance. A confirmed breakout above the neckline, followed by a successful retest, could provide a high-probability long opportuni
NFLX STRONG financials, TERRIBLE looking technical analysisNetflix is just cutting downward, at its lowest estimate for 12 months at $80 by analysts, and has some pretty high estimates if it hits them. Financials are very strong, 2026 outlook projects operating margins to hit 31.5%. Q1 did very well. It's looking like a bottom is coming, and so is a close to this head and shoulders pattern. It's hard to buy the dropping knife, but we have previous resistance down around $80.40 - $75, and if it hits it could potentially be a great trade.
This is my o
MESM June 3: Hold 7587 for 7632, lose it watch 7576MESM analysis for Wednesday, June 3
MESM still has the previous all-time high at 7632 untouched, so that remains the main upside target for me today.
On the 4H chart, the green highlighted area is the same support zone from yesterday, and that zone still looks important. I’m also watching the overnight liquidity around 7602, which may act as a short-term reaction level if price pulls back first.
The key support level for me today is 7587. If I want to stay constructive, then I do not want to
PLTR: $100 Is Not Crazy — It’s the Unfinished C MagnetNASDAQ:PLTR is sitting in one of those areas where the chart can fool both sides.
The bullish side sees the recent bounce and thinks strength is returning. Fair. But structurally, this can still be nothing more than a corrective rally into BC , especially while price remains under the descending trendline that connects the Head/Right Shoulder structure.
The key area for me is the red BC zone around $160–$175 . That is where I want to see whether buyers can actually reclaim control, or wheth
USOIL BUY 94.7On the 4-hour chart, USOIL has formed an Inverted Head and Shoulders pattern, indicating that the bulls currently hold the short-term advantage. Attention should be focused on the support level around 94.7; a buying opportunity may arise if the price retraces to this level and stabilizes. The upside target is set for the 100–102 zone.
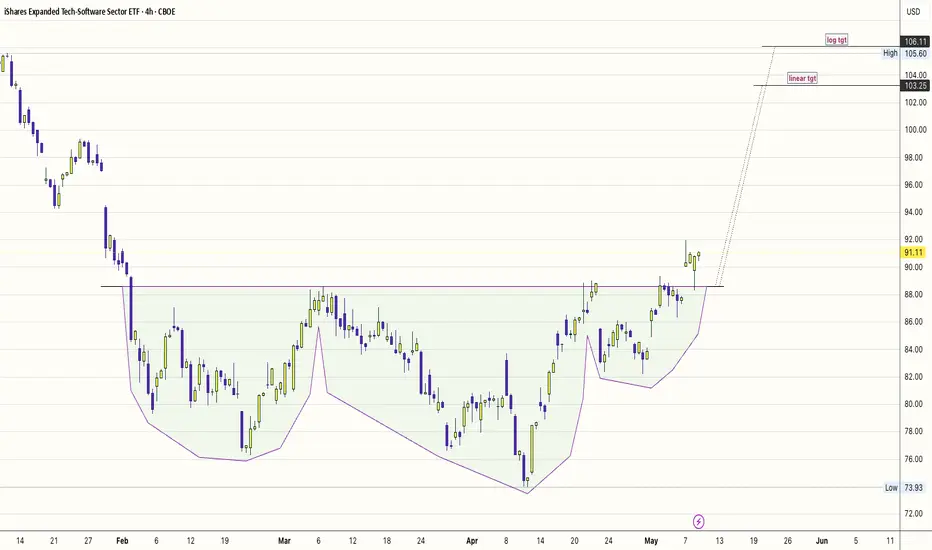
IGV: The Software Spring is Coiling | Targets $103–$106💻 💻 💻
The Technical Thesis: The iH&S Breakout
The IGV chart is showing a textbook transition from a "distribution" phase into a fresh "accumulation" cycle.
The Pattern: We have a clearly defined Inverse Head & Shoulders. The "Head" bottomed out near $74 in April, and the "Right Shoulder" has just completed its consolidation above the $88 neckline.
The Breakout: As of the May 8 close, IGV is trading at $91.11, having successfully cleared the neckline.
Price Targets: * Linear Tgt $103.25)
Log
MESM June 2: Hold 7573 for 7632, lose it watch 7550MESM analysis for Tuesday, June 2
MESM is still trading inside a consolidation range, with support around 7573 and resistance / previous all-time high around 7632.
On the 4H chart, the key level for me today is 7573. If I want to stay constructive, then I do not want to see a 4H candle close below 7573. As long as price holds above that level, I’m still watching for continuation back toward 7632.
If price starts closing below 7573, then I think the structure weakens and opens the door for dow
Bitcoin | Are We Even in Bull Market or Bear market?BTC is doing exactly what these markets tend to do — make things look unclear right before the next significant move.
What we are watching:
Sellers failed to hold the neckline around $70K, and instead of a clean breakdown, we got a failed breakdown followed by a push into the $80K psychological resistance. That level is not just a zone — it's a round number, which historically carries more weight than a regular resistance because of the volume of orders and attention concentrated around it. W
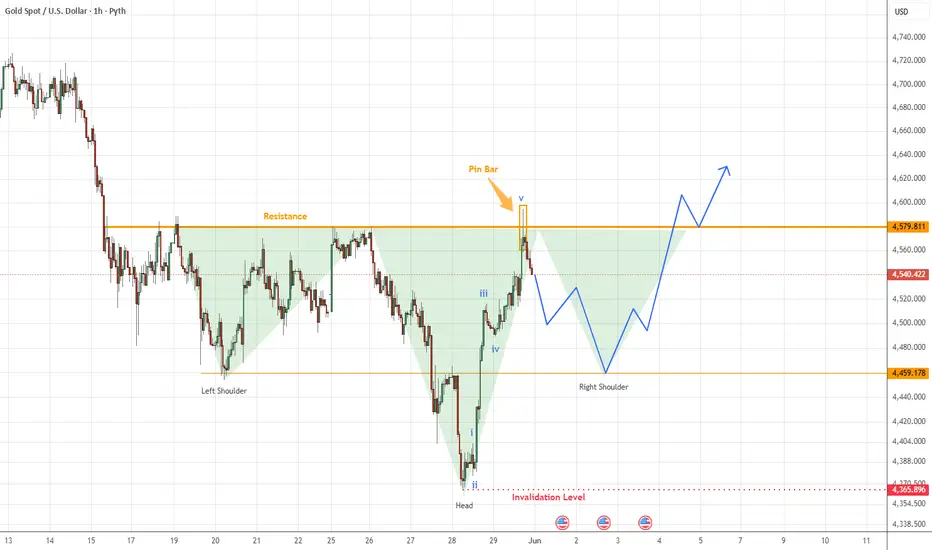
Gold Chart Pattern in playGOLD WEEKEND ANALYSIS — XAU/USD 1H
A potentially powerful pattern is forming on Gold and it's worth watching closely next week.
We have an Inverse Head & Shoulders developing on the 1H chart:
📌 Left Shoulder — formed
📌 Head — bottomed out around $4,366
📌 Right Shoulder — forming NOW
Price pushed up into a key resistance level at $4,579 and printed a pin bar rejection — which is exactly what we want to see. That rejection is now giving us the pullback to form the right shoulder.
📍 Key observ
Gold Update 📊 *GOLD (XAU/USD) — Reading the Chart Like a Pro*
Ever look at a chart and feel like it's just noise? 👀
Let me show you what I'm seeing on Gold right now — and more importantly, *why* I'm seeing it.
🔍 *Step 1: The Big Clue — A Pin Bar at Resistance*
Gold pushed up to $4,579 and left a Pin Bar — a candle with a long upper wick and a small body. That wick tells us buyers tried to push higher... but sellers rejected them hard.
When that happens at a known resistance level? That's not random. T
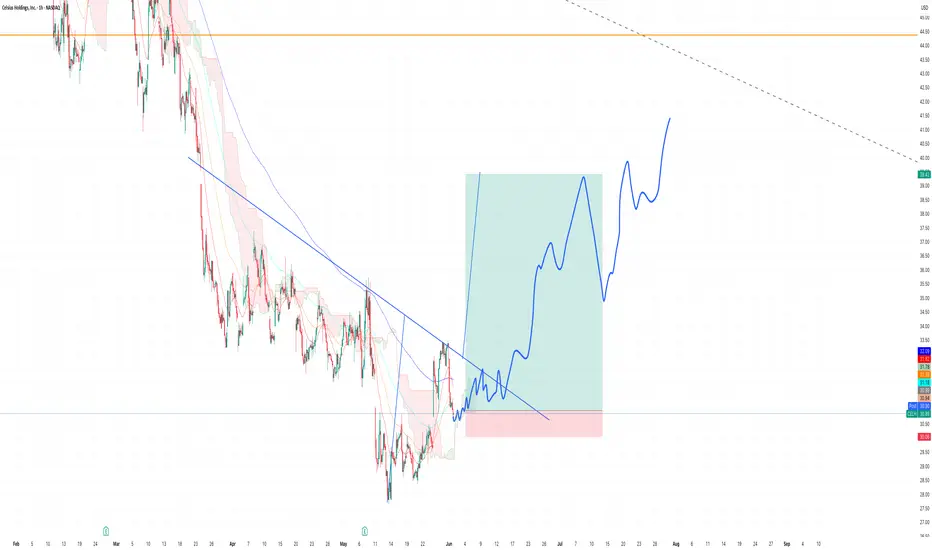
Celsius to $40Celsius has been beaten down with increased production and expense costs (double compared from 2024 500m to nearly 1B due imo to iran conflict). I expect their revenues to keep increasing YoY.
With JP Morgans new price target for the 12m period of $67 i think once this down trend is broken the inverse head and shoulder target will hit around $40. There is also a gap here too.
Currently this beverage company are valued at 8B mcap ish with a forward p/e of 22. I think its a steal.
$GRPN Revised Thesis & ChartsNASDAQ:GRPN
Groupon failed to adapt amid intensifying competition, with annual revenue declining from approximately $3 billion in 2016 to about $500 million in 2023. Free cash flow troughed at -$173 million in 2021.
Pale Fire Capital began accumulating shares in 2021. Firm partner Dušan Senkypl assumed the CEO role in 2023 and now beneficially owns 34.1% of outstanding shares.
Since Pale Fire’s activist involvement, the business has stabilized. Operations have improved with a liquidity buffe
NZDUSD: Different Ways to Counter-trend TradeWhile many traders are focused on finding opportunities in the direction of the trend, counter-trend traders are often looking for something different: relief.
The 4-hour chart supports this idea as price continues to respect the resistance zone, RSI has pushed into overbought territory, and recent price action appears to be pausing and evaluating its next move.
Dropping down to the hourly chart reveals the potential formation of a double top pattern. While the pattern isn't complete yet, a va
ACHR | The Macro Arbitrage Player Wall Street Is MispricingHey Seekers!
While the macro crowd is obsessing over stubborn inflation, shifting energy costs, and municipal gridlock, a massive structural rotation is happening right under their noses. If you are hunting for an asymmetric growth setup where the technical chart matches an explosive regulatory inflection point, pull up Archer Aviation (NYSE: ACHR).
The tape tells the story: the daily chart has been carving out a beautiful staircase of higher lows, turning old resistance near the $5.70–$6.00 p
Aussie on the Edge - when the Patterns allign📊 AUD/USD | Weekly Watchlist
🗓 First Week of June 2026
Aussie is on my radar next week 👇
Price busy forming a clean Head & Shoulders on the 4H with an ABCD pattern in play. We're sitting at the Right Shoulder, which lines up with the 61.8% Fibonacci retracement — a textbook confluence zone .
What I'm waiting for:
🕯 A bearish candlestick confirmation on the Right Shoulder
— Bearish engulfing, shooting star, or evening star
— Needs to form at or near the 61.8% fib level
Once confirmed
Accumulate Gold Buyout Dryden Gold corpDryden Gold is practically tailor-made to be bought out, and major producers have already positioned themselves for it.The Strategic Backing: Major intermediate producers Alamos Gold and Centerra Gold have strategic equity stakes in Dryden. Alamos holds a 10.46% stake, while Centerra maintains a 9.9% interest. The "Top-Up" Behavior: Major miners don't just hold these shares passively; when Dryden raised an upsized $9.5 million in financing, both Alamos and Centerra actively exercised their top-
Bitcoin Short Update: Wave 1 of C Down CompletedIn this video, I updated the Elliott Waves counts for Bitcoin and shows the breakdown of the 5-wave structure of wave 1 of C, and also the 5-subwaves for Wave 3 of 1 of C.
I also showed the head-and-shoulders pattern and discussed the profit targets using traditional Head-and-shoulders measurement rules, and Elliott Waves measurement rule using Fibonacci extension. My preference for Fibonacci extension gives a price target of $65,000.
What this means is that the breakdown formed by the correct
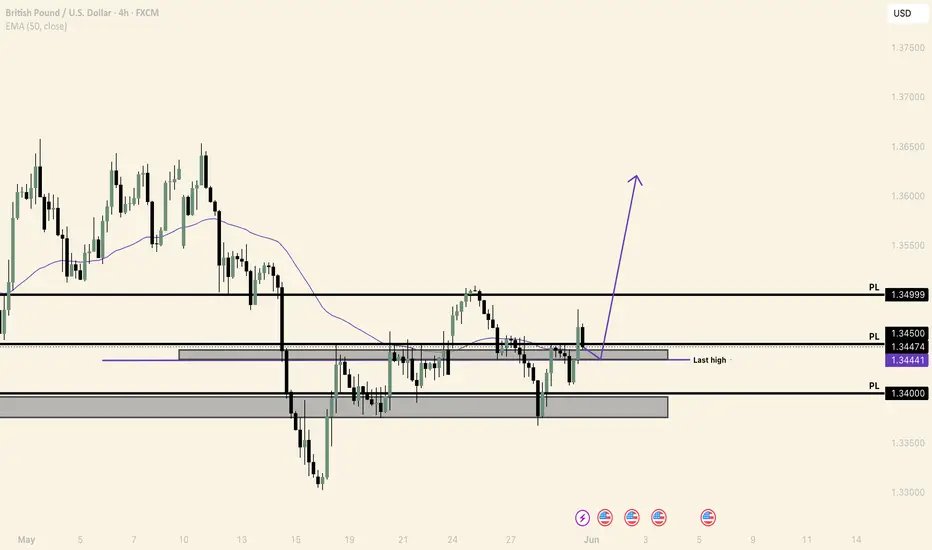
EUR/USD - LONG EUR/USD is making higher lows and higher highs on the 4H time frame. The daily timeframe is bullish. Aslong as the 4H time frame does not break the previous low. I will be looking for an entry signal on the 30 or 15 minute time frame. This is a swing trade that I will hold for the upcoming week. The same for GBP/USD