Platinum Futures: Igniting the Next Big MoveThe Dawn of a New Platinum Era
Investors constantly seek the next major market shift. Platinum futures present a compelling, multifaceted opportunity today. Prices have retraced from early 2026 record highs. This correction creates a prime entry point for strategic investors. The metal powers far more than just global jewelry. It serves as a critical linchpin across diverse sectors. Understanding platinum requires analyzing multiple interconnected global domains. We must actively explore geopolitics, high-tech innovation, and macroeconomics. This comprehensive approach reveals the true trajectory of futures. Smart money already anticipates a massive upcoming bullish breakout.
Geopolitics and Geostrategy
Global powers fiercely contest access to critical raw minerals. South Africa and Russia currently dominate global platinum supply. This heavy concentration creates immense geopolitical market vulnerabilities. Any regional political instability instantly disrupts global supply chains. Nations now view platinum reserves as strategic national assets. Governments leverage these resources to exert immense geopolitical influence. Geostrategy dictates that countries must secure reliable supply lines. Disruptions in these producing regions guarantee intense price volatility. Astute traders monitor these shifting geopolitical dynamics very closely. They understand that supply constraints ignite explosive upward movements.
Macroeconomics and Economics
Macroeconomic forces heavily dictate platinum futures market pricing. Inflation and interest rates continuously pull capital across markets. A weaker US dollar historically boosts precious metal prices. Platinum straddles the line between industrial commodity and investment. Economic expansion accelerates industrial demand for the physical metal. Conversely, economic downturns trigger protective safe-haven investment flows. Supply deficits have quietly widened over recent fiscal years. Economic models predict demand will soon outstrip available supply. This fundamental economic imbalance sets the stage for growth. Investors ignore these macroeconomic indicators at their own peril.
Industry Trends and Business Models
The global energy transition radically reshapes modern industry trends. The automotive sector relies heavily on legacy catalytic converters. Now, companies pivot aggressively toward the green hydrogen economy. Hydrogen fuel cells require significant amounts of raw platinum. Innovative business models capitalize on this clean energy shift. Corporations build new revenue streams around sustainable green technologies. They secure long-term platinum contracts to guarantee future production. These forward-looking business models disrupt traditional historical market dynamics. Industrial consumers aggressively lock in futures to hedge costs. This corporate behavior directly fuels long-term bullish market trends.
Culture, Management, and Leadership
Mining companies undergo radical internal corporate transformations today. Modern management must successfully navigate extreme commodity market volatility. Forward-thinking leadership prioritizes sustainability and ethical mineral extraction practices. A progressive company culture actively attracts top-tier engineering talent. Companies foster innovation to maximize yield and minimize footprint. Agile leadership teams adapt quickly to shifting global demands. They restructure operations to ensure consistent supply chain resilience. Leaders who ignore these cultural shifts face eventual obsolescence. Strong corporate management directly correlates with robust financial performance. This ultimately secures global platinum supply and market stability.
Science, Technology, and High-Tech
Scientific advancements rapidly expand platinum's future industrial applications. High-tech industries leverage the metal's unique physical and chemical properties. Platinum serves as an unparalleled catalyst in chemical reactions. The green technology sector depends heavily on these attributes. Proton exchange membrane (PEM) fuel cells utilize platinum extensively. Tech developers constantly push the boundaries of modern science. Breakthroughs in nanotechnology create highly efficient platinum cellular catalysts. These technological leaps guarantee sustained future global industrial demand. Tech companies race to commercialize these revolutionary scientific applications. Science and high-tech innovation act as massive market catalysts.
Cybersecurity and Patent Analysis
Industrial innovation creates an urgent need for robust cybersecurity. Companies fiercely guard their proprietary platinum green technology data. Hackers frequently target intellectual property within the energy sector. Strong cybersecurity protocols protect billions in corporate research investments. Meanwhile, patent analysis reveals the future trajectory of demand. Tech giants file thousands of patents for hydrogen applications. Analyzing these crucial patents provides early clues about shifts. Patent density directly correlates with future global industrial consumption. Investors who track patent data gain a distinct competitive edge. Data security ensures these critical innovations reach markets safely.
The Pharmaceutical Industry Connection
Most investors completely overlook platinum's crucial role in healthcare. The pharmaceutical industry utilizes platinum in life-saving medical treatments. Platinum-based antineoplastic drugs, like cisplatin, fight various aggressive cancers. These essential chemotherapies represent a critical, price-inelastic demand vector. Medical science continually researches new platinum compounds for treatments. This unique pharmaceutical connection provides a steady demand baseline. Healthcare applications demand the absolute highest purity metal levels. While smaller in volume, this specialized sector offers immense value. It clearly showcases the incredible physical versatility of the metal. This diversity strengthens the overall investment thesis for futures.
Conclusion: Seizing the Future
Platinum futures stand on the precipice of a major breakout. Geopolitical tensions and macroeconomic realities squeeze available global supply. Concurrently, green energy and high-tech sectors aggressively supercharge demand. Shifting business models and pharmaceutical applications add robust fundamental support. Savvy investors must synthesize data across all these critical domains. The recent market price pullback offers a rare strategic advantage. Market fundamentals heavily point toward a powerful future bullish resurgence. The next big move in the platinum market approaches rapidly. Those who boldly position themselves now will reap substantial rewards.  Long
Long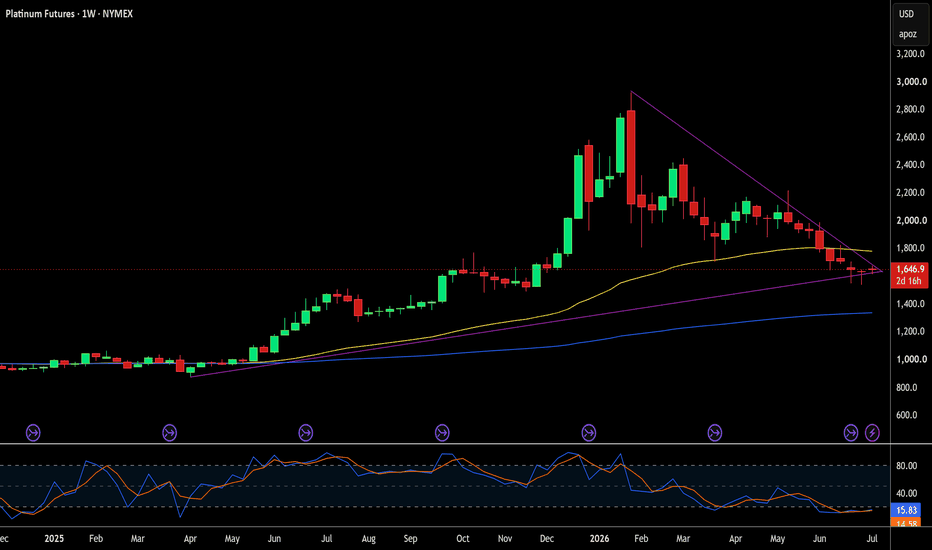
SK Hynix Just Shocked Wall Street With a $28 Billion MoveSK Hynix is preparing for what could become the largest American Depositary Receipt (ADR) listing in history, targeting a raise of more than $28 billion on the Nasdaq
The offering would surpass Alibaba's roughly $22 billion U.S debut in 2014, with trading expected to begin around July 10 under the ticker SKHY. At first glance, it looks like a company raising capital to stay competitive.. In reality, SK Hynix is already operating from a position of exceptional strength. The company holds roughly $24 billion in net cash, has AI memory production sold out through 2028, and continues to post record earnings as demand for artificial intelligence infrastructure explodes
🧠 How SK Hynix Makes Money
SK Hynix is the world's second largest memory chip manufacturer and the global leader in High Bandwidth Memory (HBM), controlling an estimated 57% of the HBM market. The company generates most of its revenue from DRAM chips used in servers, AI accelerators, smartphones, and PCs, while NAND flash products contribute additional revenue from SSDs and storage devices
Its biggest growth engine today is HBM, the advanced memory stacked alongside AI GPUs from companies like Nvidia. As hyperscalers and AI developers race to build larger data centers, demand for HBM has far outpaced supply, allowing SK Hynix to lock in long term contracts, command premium pricing, and achieve record operating margins
📊 Q1 FY26 in Numbers
The financial results highlight why investors are paying close attention, ready ?
-Revenue reached another record high as AI related memory shipments continued to surge
-Operating profit expanded sharply thanks to higher HBM shipments and stronger DRAM pricing.
-The company maintained approximately $24 billion in net cash, giving it one of the strongest balance sheets in the semiconductor industry
-HBM production remains effectively sold out through 2028, providing unusual earnings visibility for a traditionally cyclical business
-Management continues investing aggressively while generating significant free cash flow, a rare combination during a semiconductor expansion cycle
🇺🇸 The US Listing
Unlike shares traded in Seoul, which are denominated in Korean won and less accessible to many U.S institutions, the Nasdaq ADR gives global investors an easier way to own the company
SK Hynix plans to issue approximately 178 million ADRs, representing about 2.5% of the company. Each Korean share converts into ten ADRs, implying a reference price of roughly $158 per ADR, with final pricing expected around July 10. The shares will trade on the Nasdaq Global Select Market under the ticker SKHY
Every dollar raised will fund long term capacity expansion rather than plugging balance sheet holes. Capital will be invested in
🏭 The Yongin Y1 mega fab for next gen DRAM and HBM production
📦 The Cheongju P&T7 advanced HBM packaging facility
🔬 Additional ASML EUV lithography systems needed for advanced memory manufacturing.
🇺🇸 A $4 billion advanced packaging facility in Indiana, expanding SK Hynix's U.S manufacturing footprint
Interestingly, the company originally explored raising around $10 billion before increasing the target to more than $28 billion, suggesting management's long term demand expectations have become substantially more optimistic
🇰🇷 What You're Paying
After a remarkable rally driven by AI enthusiasm, SK Hynix now trades near 7x forward earnings, roughly in line with Micron despite holding the industry's leading HBM position
The company recently surpassed Samsung Electronics to become South Korea's most valuable listed company, reflecting investors' belief that HBM will remain one of the most supply constrained segments of the semiconductor market
Unlike many AI related companies trading at premium multiples despite limited profitability, SK Hynix combines strong earnings growth, expanding margins, robust cash generation and a fortress balance sheet.. However, much of the AI optimism is already reflected in today's valuation, meaning future upside increasingly depends on execution rather than simple multiple expansion
⚔️ Competition & Risks
Despite its leadership position, SK Hynix still faces several important challenges
-Samsung Electronics is investing aggressively to regain HBM market share
-Micron** continues expanding production and has already secured key AI customers
-Memory remains a cyclical industry, and any slowdown in AI infrastructure spending could pressure pricing and margins
- Geopolitical tensions involving the US, China, Taiwan, and South Korea could disrupt semiconductor supply chains
-Massive capital spending always carries execution risk, particularly as fabs become increasingly expensive and technologically complex
While current demand appears exceptionally strong, semiconductor cycles have historically shifted quickly once supply catches up
🔭 What to Watch
Several developments will determine whether SK Hynix can justify its record breaking capital raise
-Final pricing and investor demand for the Nasdaq ADR
-Construction progress at the Yongin semiconductor cluster
-Ramp-up of the Indiana advanced packaging facility
-Future HBM supply agreements with Nvidia and other AI chip designers
-Whether AI infrastructure spending remains strong enough to keep HBM capacity fully booked beyond 2028
-Quarterly gross margins and free cash flow as new production comes online
SK Hynix's historic Nasdaq listing is less about raising emergency capital and more about cementing its position at the center of the AI revolution. Few companies attempt a record-breaking equity offering while sitting on billions in net cash and operating with years of sold-out production capacity. That confidence says as much about management's expectations for AI demand as it does about the business itself
The biggest question now isn't whether SK Hynix can build more factories..It's whether the AI boom will remain powerful enough to absorb all of that new capacity over the next decade
If today's demand proves sustainable, this record setting ADR could be remembered as the moment SK Hynix transformed from a Korean memory manufacturer into one of the semiconductor industry's most globally owned AI infrastructure companies.
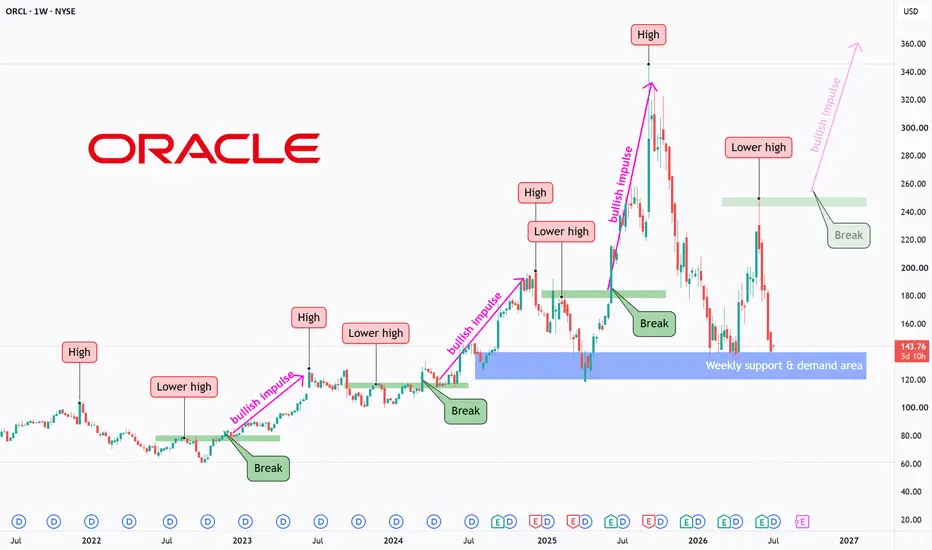
ORCL - History Repeating Itself?ORCL is one of the world's leading enterprise software and cloud computing companies, providing database solutions, cloud infrastructure, and AI-powered business applications. The stock has remained a popular long-term investment due to its strong market position and consistent business growth.
Looking at the broader price structure, an interesting pattern stands out. major highs followed by lower highs, and once those lower highs were broken, the stock entered strong bullish impulse moves.
Price is now testing a major weekly support and demand area, creating an attractive location to monitor for potential buying opportunities on lower timeframes.
⭕If buyers respond from the current demand zone, the first objective would be a move back toward the previous major high.
⭕A successful break above that high could confirm the same historical pattern once again, opening the door for a new bullish impulse and potentially fresh all-time highs.
The reaction from this support area may reveal whether buyers are ready to challenge the previous high, or if the current correction still has room to develop.
⚠️ Disclaimer: This analysis reflects my personal market view and is not financial advice.
Rayan Nasser
#ORCL #Oracle #Stocks #Investing #TechnicalAnalysis #PriceAction #MarketStructure #CloudComputing  Long
Long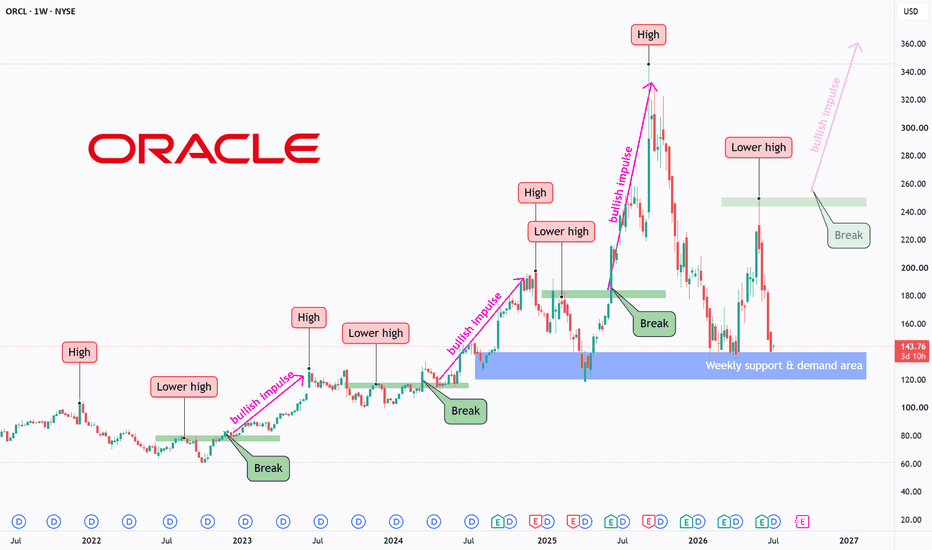
Bad Jobs Data, Good Week For Stocks — The Chart Behind It.The June jobs report added 57,000 nonfarm payrolls against a 115,000 consensus estimate. Unemployment fell to 4.2% primarily on falling participation rather than genuine job creation. The S&P 500 gained 2% on the week as markets repriced the probability of a near-term rate hike lower.
The macro context for chart analysis Polymarket prices zero Fed rate cuts in 2026 at 79.8% probability. Goldman Sachs has pushed its rate cut forecast to June 2027. Rates are staying at 3.50% to 3.75% and the data-dependent framework under Warsh means every economic release carries heightened significance for asset pricing without any forward guidance to calibrate against.
In this environment, Gate 1 confirmation on the weekly chart matters more than usual before entering any position. The trend needs to be structurally confirmed by the EMA cluster, not just recently bouncing from a low.
The semiconductor breakdown Sandisk fell 19.6%, Teradyne fell 18.5%, Western Digital fell 16.2%, and Micron fell 14.3% for the week. Weekly declines of this magnitude across a sector represent a Gate 1 breakdown on a category basis. The weekly EMA cluster on each of these names needs to be assessed individually. A 50-week EMA crossing below or approaching the 200-week EMA would confirm the structural breakdown. Until the trend structure is clearly re-established, these names are in the watch phase only.
Patience
The names with intact structures Tesla beat Q2 delivery estimates by 74,000 units. Meta announced it is monetising excess AI compute capacity. Palantir was upgraded citing the AI orchestration thesis. Each of these needs to be assessed against the weekly EMA structure rather than against the news headline alone. A Gate 1 confirmation on the weekly, with price above the EMA cluster and the 50-week above the 200-week, is the prerequisite before any setup in these names is valid.
What to watch into next week The rate environment is frozen. The labour market is weakening. Inflation is running above target. In this combination, assets with genuine structural uptrends and income characteristics, long-term EMA trend-confirmed positions with yield while you wait, have historically outperformed assets that require perfect macro timing to deliver returns.
Assess each setup against the three gates. Gate 1 first. Always.
Not financial advice. All commentary is for analytical purposes only. MT - Accumulation Near Completion?MT (ArcelorMittal) is one of the world's largest steel and mining companies, supplying steel products to industries including construction, automotive, infrastructure, and manufacturing. Given its global presence and cyclical nature, the stock is often followed from a long-term investment perspective.
From a technical standpoint, the broader structure appears to align well with Wyckoff Theory. Following a prolonged markdown phase, price has spent a long time developing what looks like an accumulation phase.
The stock is now approaching one of the most important stages of this structure, as it attempts to break above the last major resistance that has capped price throughout the accumulation.
⭕A successful breakout above this resistance would strengthen the case that the accumulation phase is complete and could mark the beginning of the next markup phase.
⭕However, if price fails to break above this level, the accumulation phase may continue for longer before a new bullish leg can develop.
The reaction around this resistance may help confirm whether the accumulation phase is complete and the markup phase is beginning, or if the stock needs more time before a long-term breakout can develop.
⚠️ Disclaimer: This analysis reflects my personal market view and is not financial advice.
Rayan Nasser
#MT #ArcelorMittal #Stocks #Investing #TechnicalAnalysis #Wyckoff #PriceAction #MarketStructure  Long
Long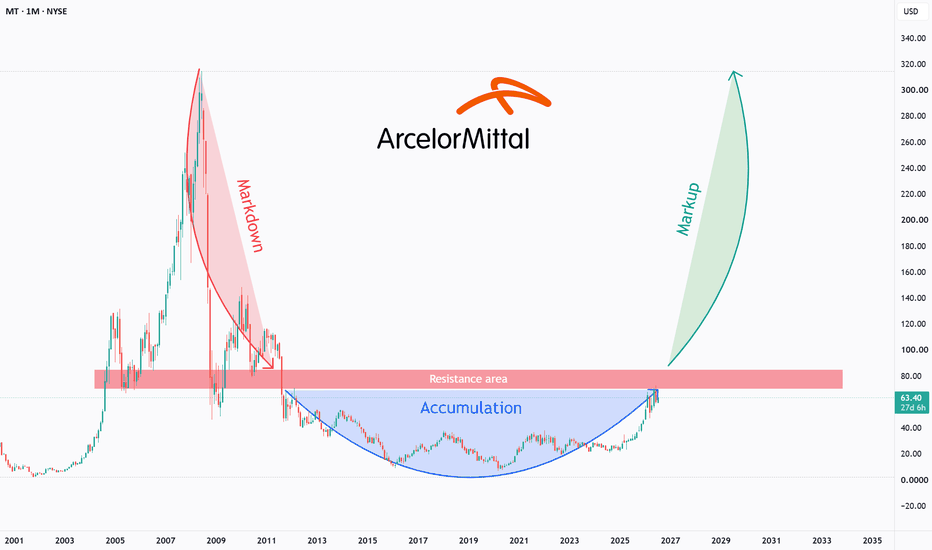
S&P 500 Daily Chart Analysis For Week of July 2, 2026Technical Analysis and Outlook:
In the abbreviated trading session last week, the S&P 500 Index posted a significant gain, reaching the Mean Resistance levels of 7,418 and 7,497. It is anticipated that the Index will continue to ascend toward a higher target, identified as Mean Resistance at 7,553, which has considerable potential to retest the completed Outer Index Rally at 7,610, and invoke Outer Index Rally extensions as identified on the chart.
On the downside, there is a considerable likelihood of initiating an In-Force retracement toward the inverse Mean Resistance at 7,553, which may trigger an ongoing downward price movement toward the Mean Support levels at 7,440 and 7,355, ultimately leading to a retest of the Outer Index Dip at 7,160. EUR/USD Daily Chart Analysis For Week of July 3, 2026Technical Analysis and Outlook:
In the previous week’s trading session, the Eurodollar exhibited a steady-to-higher upward movement, reaching a notable resistance level at 1.147. As a result, the Eurodollar has encountered a swift pullback.
Current market analysis indicates that the Eurodollar is likely to advance further, with the primary objective set at the Inner Currency Rally level of 1.149, via the Mean Resistance at 1.147.
However, currency traders must remain vigilant for the significant potential for an In-Force retracement following the momentous completion of the Inner Currency Rally at 1.149. The main downside target is identified as the Mean Support 1.138, with a retest of the completed Inner Currency Dip 1.33 via the Key Support 1.135, and potentially sliding lower to the next targets of 1.126 and 1.120, respectively. Bitcoin(BTC/USD) Daily Chart Analysis For Week of July 3, 2026Technical Analysis and Outlook:
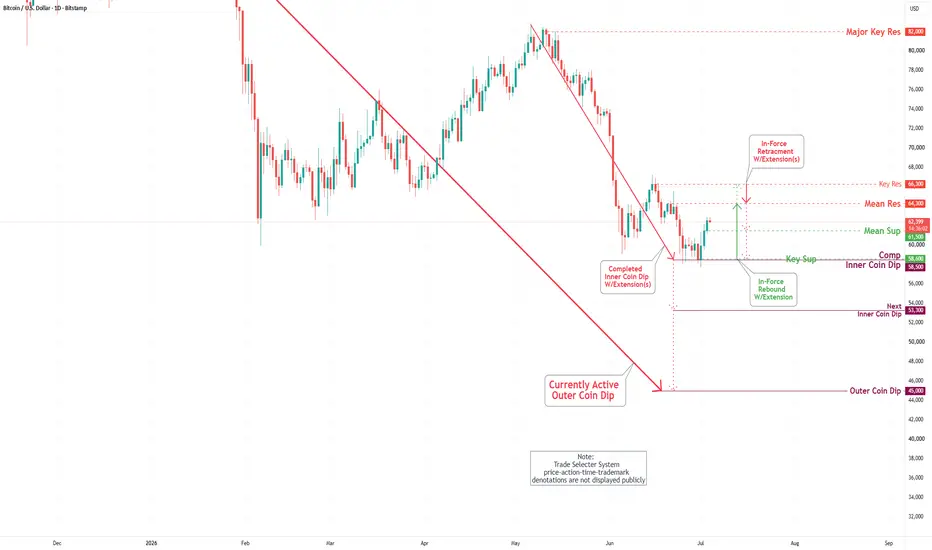
In the past week's trading session, Bitcoin has continued its upward trajectory after retesting the completed Inner Coin Dip at $58,500 and reaching the Mean Resistance at $61,800.
Currently, market analysis indicates a strong likelihood that Bitcoin will continue its ascent towards the Mean Resistance at $64,300, with the possibility of further progress reaching the upper target, the Key Resistance at $66,300.
Conversely, there is a risk that the cryptocurrency may experience an early reversal, retreating from the Mean Resistance at $64,300 to the Mean Support at $61,500. Such a decline could lead to a retest of the completed Inner Coin Dip at $58,500 and trigger an extension further to the subsequent Inner Coin Dip at $53,300, with the ultimate target being the Outer Coin Dip at $45,000. DXYZ - Trading Near NAV & Demand Zone in Focus!DXYZ is a closed-end fund (CEF) that provides public market exposure to a portfolio of high-growth private technology companies, including names such as SpaceX, OpenAI, and Anthropic. Unlike traditional ETFs, its market price can trade at a premium or discount to its Net Asset Value (NAV), which represents the estimated value of the fund's investments per share.
At the current price of around $24, DXYZ is trading around its latest reported NAV of $24.56 per share (as of March 31, 2026). In other words, investors are currently buying the fund at a price that is very close to the estimated value of its underlying portfolio.
From a technical perspective, price has declined sharply from around $73 and is now testing a major weekly demand area, which also represents an important long-term support zone.
⭕As long as this demand area continues to hold, lower timeframes may provide opportunities to look for buy setups in anticipation of a potential recovery.
⭕However, if price breaks below the current demand zone, the focus shifts toward the next lower weekly demand area, where another buying reaction may develop.
The combination of a market price trading close to NAV and a major weekly demand zone makes this an interesting area to monitor for long-term investors.
⚠️ Disclaimer: This analysis reflects my personal market view and is not financial advice.
Rayan Nasser
#DXYZ #Stocks #Investing #TechnicalAnalysis #PriceAction #MarketStructure #ClosedEndFund #NAV  Long
Long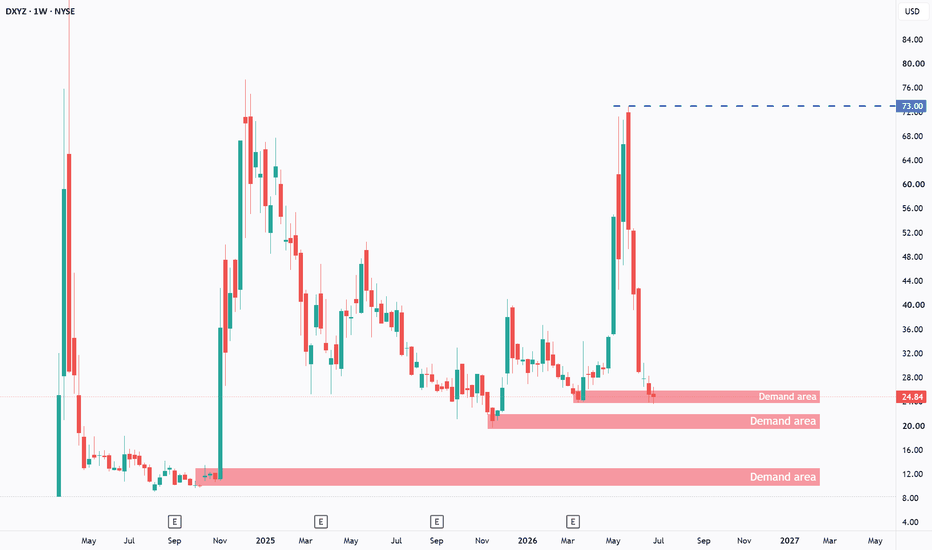
$SYK — 200-Week EMA Test. 13% Below.NYSE:SYK is currently trading around $326 with the 200-week EMA sitting at approximately $320. Price has pulled 13.69% below its prior high and is now sitting 0.3x its weekly ATR above the 200-week EMA, which places it within the structural buy zone on the weekly chart.
The structural parallel worth noting
In 2022 to 2023, NYSE:SYK fell 13.10% below its 200-week EMA during a period of broader market pressure on healthcare. The DeMarker on the weekly reached deeply oversold levels. Price subsequently recovered and the stock ran significantly higher over the following two years. The current decline from the 2025 peak is 13.69%, an almost identical percentage decline to the same structural level on the same timeframe.
History does not guarantee repetition. But the specific combination of conditions, defined percentage drawdown below the 200-week EMA, DeMarker at oversold levels, 50-week EMA remaining above the 200-week EMA throughout, is the same set of conditions that preceded the prior multi-year recovery.
The current technical structure
→ 200-week EMA: $320
→ 50-week EMA: $341 — above the 200-week EMA, long-term trend intact
→ DeMarker on the weekly: at the lowest reading since the 2022 period
→ Price: 0.3x weekly ATR above the 200-week EMA, within buy zone threshold
The fundamental context
Q1 2026 net sales $6.02 billion, up 2.6% year-on-year. A cybersecurity incident in March temporarily disrupted operations and affected Q1 revenue timing. Management maintained full-year guidance of 8.5% organic growth and adjusted EPS $14.90 to $15.10 unchanged. EPS expected to grow 63% over the next three years. Annual dividend $3.52 per share, raised 4.8%, 10-year average increase 9.8%.
The risk
Full-year guidance requires acceleration from Q1's 2.4% organic growth. Q2 results will be the primary confirmation or contradiction of the thesis. A sustained weekly close below $280 would break the structural support and invalidate the long-term accumulation case.
A pullback to the 200-week EMA is not automatically a buy. The DeMarker confirmation and the 50-week remaining above the 200-week together define the entry condition. Both are currently in place. The Q2 earnings are the fundamental confirmation signal.
Not financial advice. All levels are for analytical purposes only.  Long
Long
$DBA — Six-Year Uptrend, EMA Pullback, Three Scale-Out TargetsAMEX:DBA , the Invesco DB Agriculture Fund, has been in a confirmed long-term uptrend since the 2020 pandemic low at $13.19. Current price $26.91. The 50-week EMA remains above the 200-week EMA at $24.45, confirming the long-term structural trend is intact.
The current technical condition
Price has pulled back from the 2025 high of $28.84 toward the 8 and 21 EMA cluster, which is currently providing weekly support in the $26.63 to $26.89 zone. The DeMarker on the weekly has been declining from elevated readings and is approaching the zone where previous buying pressure has resumed on this chart. It has not yet reached deeply oversold levels, which means the ideal entry window for the final tier is still developing.
The setup structure
Entry: first tier at current levels around $26.91, building toward additional tiers on further DeMarker decline toward oversold.
Stop: daily close below $25.09. Below this level the EMA support structure breaks and the short-term technical thesis is invalidated.
Target 1: $27.58 — first partial scale-out, approximately half the near-term ATR above current consolidation zone.
Target 2: $30.74 — second partial scale-out, prior resistance extension above the 2025 high of $28.84.
Target 3: $35.80 — full measured move target, approximately 50% of the weekly ATR move from the 200-week EMA base.
What to watch
The DeMarker confirmation is the key timing signal for additional tier entries. A DeMarker reading below 0.3 beginning to turn upward while price holds the weekly EMA support zone is the condition that would justify accelerating position building. Without that confirmation, additional tiers wait.
The 200-week EMA at $24.45 is the longer-term accumulation zone if price continues lower through the current support. The 50-week above the 200-week throughout any pullback to that level would maintain the structural long entry thesis.
A pullback to any EMA level is not automatically a buy. The DeMarker confirmation and the trend structure together define the entry, not the level alone.
Not financial advice. All levels are for analytical purposes only.  Long
Long
Will Global Supply Shocks Explode Cotton Prices?Cotton sits at a genuine inflection point, but the case for a durable bottom is more mixed than the headlines suggest. Prices have actually declined roughly 4% over the past month even as they ticked modestly higher into July, and the most recent independent analysis available called the bears still in control. The one unambiguous catalyst is policy, not speculation: India's textile ministry lifted its 11% cotton import duty from June 1 through October 30, the second such waiver in a year, giving spinning mills and yarn producers real but limited relief on input costs. That's a genuine support factor. Talk of a sharp, China-driven rebound is not yet backed by the scale of actual purchases on the tape.
The macro picture cuts both ways. A hawkish Federal Reserve has kept the dollar firm, which makes US cotton more expensive for foreign buyers and has kept export sales subdued, while cheaper crude has made synthetic fibers more price competitive, a structural headwind cotton has been fighting for years. Working against that, USDA's latest supply and demand estimates point to a tighter 2026/27 global balance, with world ending stocks projected at their lowest since 2018/19 and production expected to fall almost everywhere except India. That tightening is the more durable bullish argument here, more so than any single rumor of Chinese demand returning.
Underneath the daily price noise, the structural story in cotton is shifting toward risk management rather than speculation. Hedging through forward contracts has become close to mandatory for mills trying to protect margins against this volatility, and the supply side is leaning harder on technology, climate-resilient GM seed traits, drone-based soil monitoring, and precision fertilizer application to protect yields as weather risk in places like India and Texas becomes a bigger swing factor than trade headlines.
The near-term path depends on a narrow set of catalysts worth watching directly: whether Indian monsoon rainfall supports or delays planting, whether US crop conditions hold up through the growing season, and whether China's actual purchase volumes, not rumors of them, start showing up in the weekly export data. Until then, this looks less like an explosive breakout and more like a market searching for a floor amid a genuinely tighter supply outlook.  Long
Long
$VOO vs Active Management — What 25 Years of Data Actually ShowsThis is not a chart analysis piece. It is context that every market participant should understand before making decisions about how their capital is allocated.
S&P Dow Jones Indices' SPIVA Scorecard, which has tracked active fund manager performance against benchmark indices for 25 years, released its year-end 2025 data last month. 79% of all actively managed large-cap US equity funds underperformed the S&P 500 in 2025. Over 20 years, the figure is approximately 92%. Over 15 years, zero out of 22 US equity categories had a majority of active managers outperforming.
What this means for traders and investors using TradingView
The platforms and tools available to retail investors today, real-time charting, technical analysis, moving average systems, volume analysis, momentum indicators, represent something the data above does not capture. The SPIVA data tracks passive stock-picking mutual fund managers, not systematic technical traders using defined rule-based entry and exit frameworks.
A systematic trader who uses the 200-week and 50-week EMA structure to identify structural entry points in quality assets, applies a defined stop-loss methodology, and scales out at verified Fibonacci extension targets, is doing something structurally different from an active fund manager trying to pick stocks based on fundamental research and market calls.
The data on active fund manager underperformance does not invalidate systematic technical trading methodology. It invalidates the specific practice of paying a professional to pick stocks on your behalf in the hope of beating an index, which is a different activity entirely.
The relevant implication for portfolio construction
A low-cost index fund tracking the S&P 500 such as AMEX:VOO at 0.03% annual expense has outperformed 92% of actively managed alternatives over 20 years. That makes it a rational core holding for the long-term portion of any portfolio.
Systematic technical strategies applied to timing and entry around structural levels such as the 200-week EMA are additive to that core, not a replacement for it. The two approaches are not in competition. They serve different functions in a well-constructed portfolio.
Understand the data. Use it to make better decisions about how you allocate capital. That is the only reason to publish it here.
Not financial advice. All commentary is for educational purposes only.  Education
S&P 500 Daily Chart Analysis For Week of June 26, 2026Technical Analysis and Outlook:
In last week's abbreviated trading session, the S&P 500 Index experienced a substantial drop, completing Inner Index Dip 7,295. As a consequence, the cash market is experiencing an In-Force rebound to the Mean Resistance of 7,418, with a strong possibility of moving further to strike the Mean Resistance levels of 7,497 and 7,553, and a historical outcome of an Outer Index Rally at 7,611.
However, on the downside, there is a considerable chance of a continuous downward movement to retest the Key Support of 7,265 and the Inner Index Dip 7,295, and by doing so triggering a severe steady-to-lower movement by striking the Outer Index Dip at 7,160. Bitcoin(BTC/USD) Daily Chart Analysis For Week of June 26, 2026Technical Analysis and Outlook:
In this week's trading session, after the successful completion finale of the Interim Inner Coin Rally at 67,200, Bitcoin quickly retreated to complete the Inner Coin Dip at 58,500.
Current market analysis suggests that Bitcoin is likely to retest the Mean Resistance level at 61,800. There is also potential for further gains towards the upper target of the Mean Resistance at 64,300, with the possibility of reaching a critical target at Key Resistance of 66,300.
On the downside, however, there is a chance that the cryptocurrency could continue to decline from its current trading range, retesting the completed Inner Coin Dip at 58,500 before conceivably sliding further to the next Inner Coin Dip, marked at 53,300. $AAPL — 200-Week EMA Analysis. Extended Signal.Apple NASDAQ:AAPL is currently trading around $283 to $298 on the weekly chart. The 200-week EMA sits at approximately $214. The 50-week EMA is at approximately $265. Both EMAs are rising, confirming a genuine long-term uptrend rather than a temporary bounce.
The current technical condition is Extended.
Price is approximately 39% above the 200-week EMA, which is well outside the typical buy zone range. The buy zone for this type of analysis sits within roughly one weekly ATR of the 200-week EMA. At 5.8 times the weekly ATR from the 200-week EMA, price has moved significantly ahead of the structural anchor.
What Extended means in practice:
For existing holders who entered closer to the 200-week EMA, the correct posture is to trail the stop below the 50-week EMA with approximately one ATR buffer. That places the trailing stop around $250. Hold and let the 50-week EMA continue rising to protect the position.
For new capital looking to initiate a position, Extended is a wait signal. The risk-reward from current levels relative to the 200-week EMA structural support is less favourable than it was when price was closer to that level.
The pullback levels to watch:
→ 50-week EMA zone: approximately $265 — first area of structural interest on a pullback
→ 200-week EMA zone: approximately $214 — the primary long-term accumulation zone
A pullback toward either level, combined with the DeMarker on the weekly dropping below 0.3 and beginning to turn upward, would be the setup to reassess. The DeMarker is the timing confirmation. The EMA level is the structural anchor. Both conditions together define the entry. Neither alone is sufficient.
The fundamental context:
Apple reported Q2 FY2026 revenue of $111.2 billion with iPhone sales up 22% year on year and Services revenue at approximately $30 billion. The $100 billion buyback authorisation and 4% dividend increase confirm the company is in strong financial health. The business quality supports the long-term structural analysis. A pullback to the 200-week EMA on a business of this quality with rising EMAs and intact trend structure has historically been an accumulation opportunity, not a structural breakdown.
The rule:
A pullback to the 200-week EMA is not automatically a buy signal. It is a level to assess. The DeMarker confirmation, the 50-week remaining above the 200-week, and the investor's own analysis of the business are all required before acting. The level creates the opportunity. Analysis confirms whether the timing is right.
Not financial advice. All levels are for analytical purposes only. 10 Must-Read Books That Can Transform Your Trading JourneyEvery successful trader has one thing in common: they never stop learning.
Markets evolve, technology changes, and strategies come and go, but the principles of discipline, risk management, and psychology remain timeless. Reading the right books won't make you profitable overnight, but they can save you years of costly mistakes and accelerate your growth.
Whether you're trading stocks, forex, crypto, commodities, or options, these ten books deserve a place in your library.
1. Trading in the Zone - Mark Douglas
Many traders spend years searching for the perfect strategy, only to realize their biggest obstacle is themselves.
Mark Douglas explains why consistency comes from mastering your mindset rather than constantly changing indicators or systems. He teaches traders how to think in probabilities, control emotions, and execute trades without fear or hesitation.
Why Read It?
Build confidence in your trading plan
Overcome fear and greed
Learn to accept losses without emotional damage
Develop a professional trading mindset
2. Market Wizards - Jack D. Schwager
Instead of teaching one trading method, this classic lets some of the world's greatest traders tell their own stories. Each interview reveals different strategies, personalities, and market approaches, proving there isn't a single path to success. The common themes are discipline, patience, and excellent risk management.
Why Read It?
Learn directly from legendary traders
Discover multiple trading styles
Understand what separates professionals from amateurs
3. Technical Analysis of the Financial Markets - John J. Murphy
If technical analysis had an encyclopedia, this would be it. Murphy covers everything from trend analysis and chart patterns to indicators, volume, market cycles, and intermarket relationships. It's one of the most complete technical analysis books ever written.
Why Read It?
Learn technical analysis from the ground up
Improve chart-reading skills
Build a solid analytical foundation
4. Reminiscences of a Stock Operator - Edwin Lefèvre
Despite being written nearly 100 years ago, this book remains surprisingly relevant.
Based on the life of legendary trader Jesse Livermore, it demonstrates how markets are driven by human behavior. The technology has changed, but emotions haven't. The lessons on patience, timing, and capital preservation are just as valuable today as they were a century ago.
Why Read It?
Learn timeless market wisdom
Understand trader psychology
Appreciate the importance of patience
5. The Daily Trading Coach - Brett N. Steenbarger
Improving as a trader requires more than studying charts: it requires developing better habits. This book provides over 100 practical exercises designed to improve discipline, emotional control, decision-making, and daily performance.
Why Read It?
Create productive trading routines
Improve consistency
Develop long-term trading habits
6. Japanese Candlestick Charting Techniques - Steve Nison
Candlestick patterns are one of the most widely used tools in technical analysis today, thanks largely to Steve Nison. This book explains how price action reflects market sentiment and how traders can use candlestick formations to improve timing and identify reversals.
Why Read It?
Master candlestick analysis
Improve trade entries and exits
Understand market psychology through price action
7. The Intelligent Investor - Benjamin Graham
Not every trader focuses on long-term investing, but every market participant can benefit from Graham's principles. This classic introduces concepts like intrinsic value, margin of safety, and emotional discipline: ideas that continue to influence investors worldwide.
Why Read It?
Learn timeless investing principles
Improve capital preservation
Develop long-term market perspective
8. The Psychology of Trading - Brett N. Steenbarger
Success in trading depends as much on personal development as market knowledge. Steenbarger blends psychology, coaching, and performance science to help traders understand their habits, improve focus, and consistently perform at a higher level.
Why Read It?
Strengthen emotional resilience
Eliminate destructive habits
Build peak trading performance
9. The Disciplined Trader - Mark Douglas
Before Trading in the Zone, Douglas wrote this influential book exploring why traders often sabotage themselves. He explains how beliefs, emotions, and mental conditioning affect every trading decision and provides a framework for developing consistency.
Why Read It?
Understand trading psychology
Improve discipline
Build confidence in your trading system
10. The New Market Wizards - Jack D. Schwager
This follow-up to Market Wizards introduces another generation of exceptional traders. Their stories reinforce a powerful lesson: there is no universal strategy. Success comes from finding an approach that matches your personality and executing it with discipline.
Why Read It?
Learn modern trading perspectives
Explore diverse trading methodologies
Gain inspiration from real-world success stories
My Thoughts:
The best traders never stop being students. These books won't hand you a winning strategy, but they'll teach you how successful traders think, manage risk, and stay disciplined through every market condition. If you're serious about becoming consistently profitable, start with one book, apply its lessons, and then move to the next. Knowledge compounds, just like great investments.
By @BrightRally_Research  Education
 Short
Short
 Long
Long
 Long
Long