Momentum Indicator (MOM)
NQ 15M — Market Structure & Momentum ExpansionThis chart illustrates a sequence in which market structure, a key reference level, and momentum can be analyzed together.
1. STRUCTURE
Price initially develops a consolidation phase before establishing a structural transition from the local low.
2. KEY LEVEL RECLAIM
The market subsequently reclaims an important reference level. Rather than treating the level itself as a trading signal, the focus is on price behavior and acceptance around the reference.
3. MOMENTUM EXPANSION
After acceptance abo
Z-Scores Are More Powerful Than Most Traders RealizeMany traders treat a Z-score as another overbought-and-oversold oscillator.
That interpretation is incomplete.
A Z-score is not inherently bullish, bearish, trend-following, or mean-reverting. It is a contextual measurement answering a specific question:
How far is the current value from its estimated normal level, measured in units of recent variability?
That makes Z-scores much more flexible than most traders realize.
They can measure unusual price movement, momentum, volume, volatility,
XAUUSD | Gold Bullish Continuation Pattern at Major Support ZoneThe Gold Price experienced a sharp downward trend initially, bottoming out near the 3,980 region before undergoing a major Structural Shift. Following a period of accumulation and a breakout above local resistance, price action flipped the market structure from bearish to bullish. Currently, price is experiencing a corrective pullback after hitting a local peak near 4,200, returning to retest a crucial demand zone.
Key Confluences
Parallel Channel: The corrective move down from the 4,200 highs i
MCL1! Volume Polarity is flashing the same warning that precededHistory doesn’t always repeat, but it often rhymes.
On March 20th, Volume Polarity showed clear signs of exhaustion:
Bullish volume reached extreme levels (red dots)
Raw volume differential crossed under the smoothed differential
Bearish divergences began printing (orange dots)
This was followed by a sharp $14.23 drop.
We are now seeing an almost identical setup after several days of sideways chop:
Bullish volume is once again pushing into extreme territory
Raw differential has c
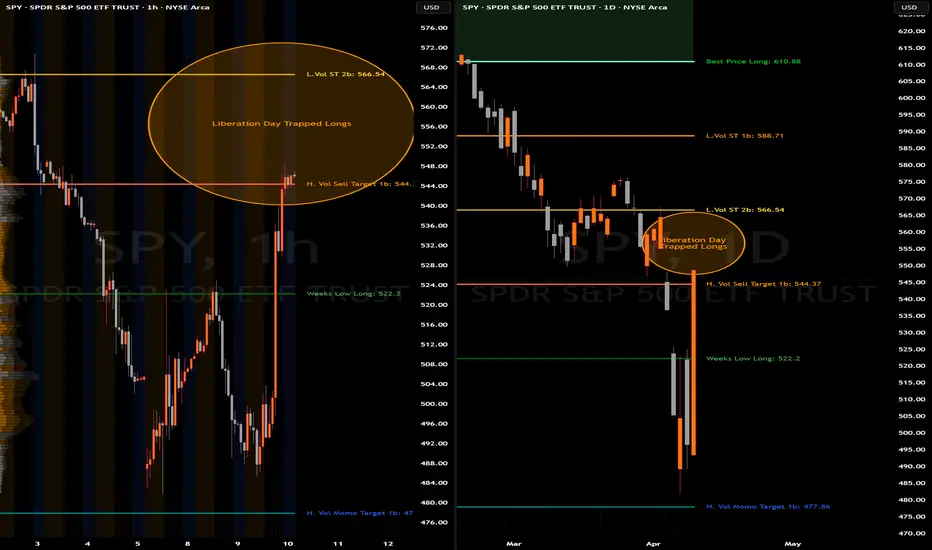
SPY Analysis & Tariff TurmoilLast Friday, the market pressure was intense, and my bullish call option, targeting $537.64 on SPY, seemed overly ambitious as tariffs and political uncertainties peaked. I stated, " AMEX:SPY Trump went all in thinking he had the cards. We were getting sent back to the McKinley era," wondering when or if Trump would fold under international pressure and market realities.
Fast-forward to Wednesday, April 8—Trump didn't just blink; he folded utterly, reversing the harsh tariff policies he initia
QQQ sold off today and plummeted in after hoursQQQ started to finally show selling with momentum for first day in nearly a week of slowly selling.
It looks as though distribution phase has passed and selling with momentum has begun.
After hours etf continues to slide dramatically
Bulls have lost with bears firmly in control at the moment
The after hours sell we are experiencing now could possibly cause it to gap down on open then get filled in the morning before selling continues.
CENTUARY PLY - Moving out of the Accumulation Zone. The stock has finally moved out of the consolidation zone. Late last December, the stock met with price rejection around 850 levels and it was pushed down below the 200 DMA levels. Then it started consolidating for almost three months now. The money flow had started increasing for the past month and the relative strength also started showing signs of recovery. Today, the stock moved out of the consolidation zone with a gap-up opening and a widespread up-bar. Of course, it did meet some supply. a
ADITYA BIRLA FASHIONS - Poised to moved up ?The stock saw a huge fall of about 50% from a high of 359. From the bottom, it has been struggling for almost a year to reverse the trend. And of late, you can see the attempt to move up, seeing some success. You can see a break of structure in the daily and now a break of structure in the weekly as well. The relative strength is also positive. The money flow which had dipped is now recovering. The momentum also had weakened recently and is now picking up. Today the stock moved past the price re
Info Edge (India) Ltd Showing Strong Up-Side MomentumStrong operating businesses
Strong Operating Cash generation year with a run- rate of c1000 Cr plus (pre Tax) annually and growing.
Negative working capital due to advance subscription fees (Rs 925 cr as on 31/12/23)
Asset-light business models
"Zero" Debt.
Well Defined approach towards Financial Investments
AIF structure for eventual and self-sustained independent financial investment business.
Partnered with reputed Sovereign Fund (Temasek Holdings).
AIF contribution commitment is
#DLINKINDIA is Near to Break Previous All Time High
Company has reduced debt.
Company is almost debt free.
Company has delivered good profit growth of 28.0% CAGR over last 5 years
Company has been maintaining a healthy dividend payout of 39.8%
Strengths:
Established market position and strong distribution network: D-Link is the market leader in switches and wireless local area network (WLAN) products, with a significant market share. In fiscal 2019, the company introduced a series of high-end products for its enterprise business,
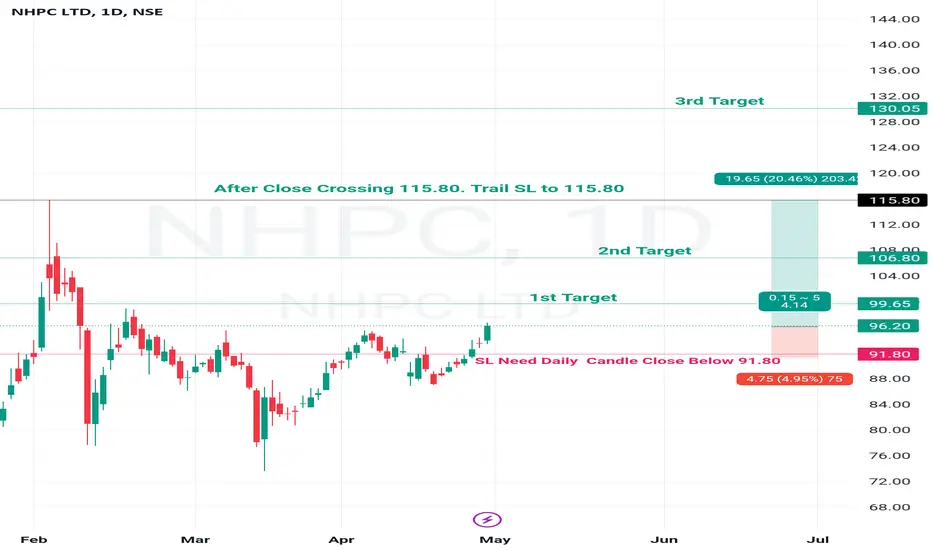
#NHPC Company has been maintaining a healthy dividend payout of 49.5%
The company is actively engaged in the construction of 15 Solar and Hydro Power Projects of 10449 MW Capacity (including JV & Subsidiaries). Total projects under clearance stood at 4112 MW and projects under survey stood at 4110 MW as on Dec’23.
MOUs
Company has signed a MoU on 3 Jan 2024 with GPCL for proposed investment of Rs.4000 Cr in Kuppa Pumped Storage Project (750 MW), Chhota Udaipur, Gujarat.
Company signed an MOU
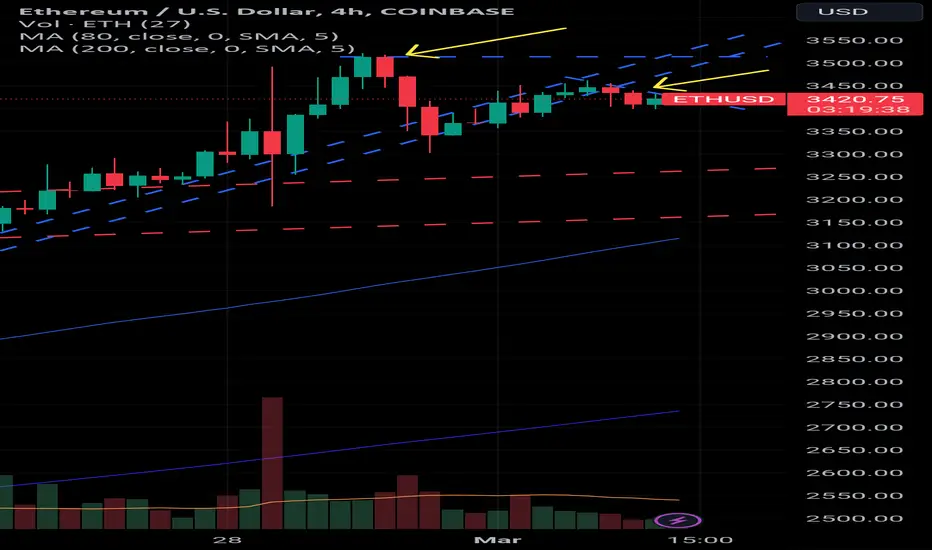
ETH is showing weakness in its long term rallyETH recently has been losing momentum. The rally now showing one of two scenarios:
Consolidation where profit taking is occuring before another rally
Reversal in the trend
We can see this weakness by identifying two aspects in the price action.
Fails to make a higher high
Breaks long term upward trend
Momentum Indicator for USDEUR turns positiveMomentum Indicator for USDEUR turns positive, indicating new upward trend
USDEUR saw its Momentum Indicator move above the 0 level on February 04, 2024. This is an indication that the stock could be shifting in to a new upward move. Traders may want to consider buying the stock or buying call options. Tickeron's A.I.dvisor looked at 125 similar instances where the indicator turned positive. In 46 of the 125 cases, the stock moved higher in the following days. The odds of a move higher are at 37
LONDON UJ LONG 618 ON IB IMOMENTUMUsing half of our profit from last trade, we will go for another 2R on this last setup of London. Price has yet made another playbook setup and we must heed by our trading plan and take it.
We have taken far more entries during ASIA/LONDON than we anticipated and although they were all profitable, taking these many entries is NOT what we recommend. Psychology studies suggest that the human mind can typically only make 1-2 rational emotional decisions per day and as we all know when risking capi