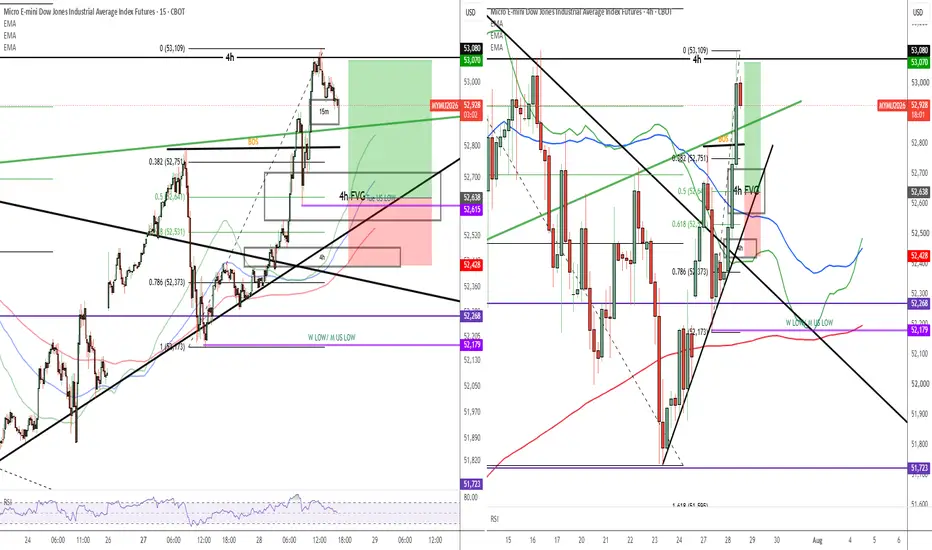
Sector View: Leadership Keeps Rotating, Not Breaking1️⃣ Where is capital actually flowing?
The answer this week is clear. Technology is no longer the only game in town.
Financials, Energy, Real Estate and even Consumer Staples are quietly improving relative to the S&P 500, while Semiconductors remain a key leadership group. At the same time, several former leaders are consolidating rather than accelerating.
Market breadth still supports an Acceptance regime, but leadership is becoming more selective and rotational rather than broadening across every sector.
2️⃣ What Matters
• Leadership remains intact rather than collapsing.
• Financials continue improving.
• Energy is repairing after previous weakness.
• Real Estate and Consumer Staples are showing early relative improvement.
• Semiconductors remain an important leadership group despite short-term cooling.
• Defensive assets such as Bonds and Gold continue to lag.
These are signs of rotation within an ongoing uptrend, not broad market deterioration.
3️⃣ What Is Mostly Noise
• Daily moves in SPY.
• Headlines trying to explain every market move.
• One weak day in Technology.
• Individual sectors temporarily underperforming.
The objective isn't to chase every rotation.
It's to identify where institutional money is quietly accumulating.
4️⃣ TradeSentinel Takeaway
The evidence does not suggest a market losing its footing.
It suggests leadership is evolving.
Technology remains important, but capital is becoming more selective and is expanding into Financials, Energy and other improving groups rather than lifting every sector equally.
Successful momentum investing isn't about predicting the next leader.
It's about following where the evidence is improving before the crowd notices.
The Big Structural Signal
The market still contains durable leadership, but it is now spread across Energy, Technology, Financials and Healthcare rather than concentrated in one dominant growth theme.
That supports the Weekly Review message of a structurally healthy but increasingly selective environment.  Short
Short
Base Building After Trendline Breakout – Is the Next Leg Higher?Presenting another high-probability chart story.
After spending months trading below a well-defined descending trendline, DXCM finally broke above that resistance, signaling a potential shift in the longer-term trend.
As often happens after a major breakout, price returned to retest the broken trendline, successfully confirming it as new support instead of falling back below it.
But what makes this chart even more interesting is what happened next.
Rather than making an impulsive move immediately, DXCM has entered a healthy post-breakout consolidation, building a base between 67 and 79. This type of sideways price action often represents re-accumulation, where the market digests previous gains before deciding on its next directional move.
Even during this consolidation, buyers continue to defend the structure.
Most recently, price found support at the Daily EMA 200, another level that institutions often monitor. Holding this dynamic support while remaining above the broken trendline keeps the overall bullish structure intact.
Levels I'm watching
🟢 Support: 67 (also near the Daily EMA 200 @ 70)
🔴 Resistance: 79
A decisive breakout above 79 would confirm that the consolidation has resolved to the upside and could trigger the next bullish impulse towards 89, 113 and even 140s.
Until then, this remains a chart of patience rather than prediction. Strong trends often spend time building energy before making their next move.
Bullish Thesis
As long as DXCM continues holding above 67 on a daily closing basis, the post-breakout structure remains healthy and favors another attempt toward higher prices.  Long
Long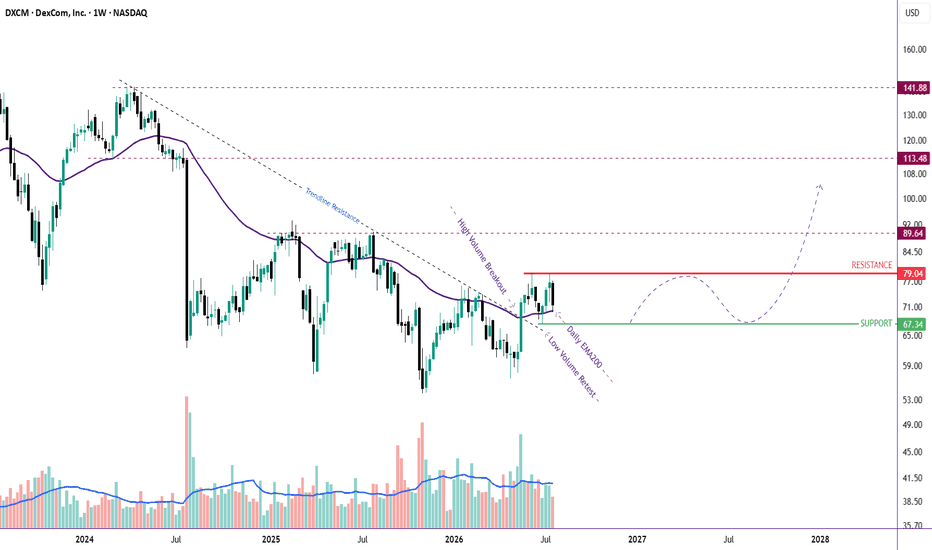
 Short
Short
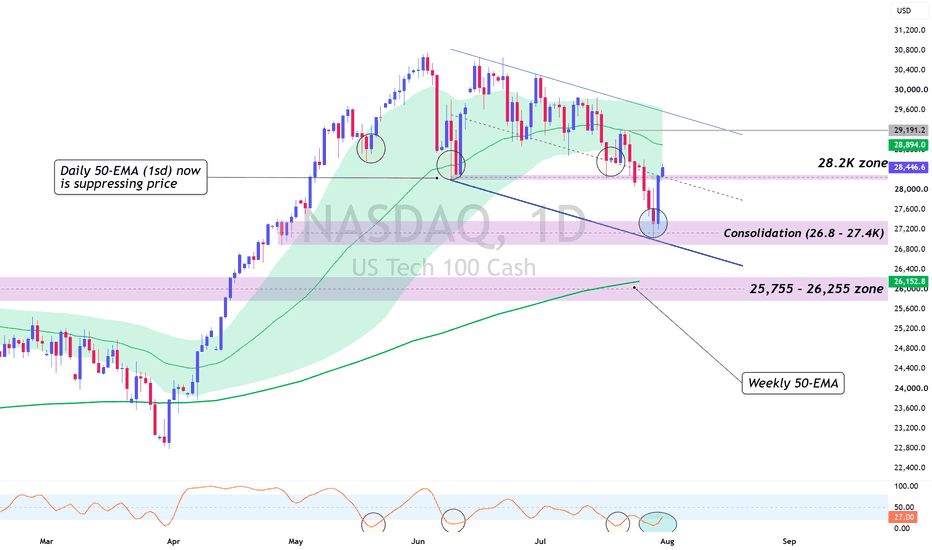
Watani Iron Steel (9513) : Confirmation Before the Next Move !!TADAWUL:9513
📈 Weekly Trendline Retest: Waiting for Confirmation Before the Next Move 🇸🇦
The stock has successfully retested its long-term weekly trendline, placing it at a critical technical decision point.
While the setup is becoming increasingly constructive, confirmation is still required before considering a high-conviction entry.
🔍 Technical Outlook
The current price action suggests that the market is attempting to convert the previous resistance into support.
However, rather than anticipating the move, I prefer to wait for a confirmed breakout–retest before building a position.
A successful confirmation would significantly strengthen the bullish case and improve the overall risk-to-reward profile.
📌 Daily 200 EMA: Key Dynamic Support
Another important technical level to monitor is the Daily 200 EMA, currently positioned around 1.97.
This area represents a strong confluence support zone and could become the foundation for the next bullish leg if buyers continue defending it.
👀 Medium-Term Watchlist Candidate
From a medium-term investment perspective, this stock deserves a place on the watchlist.
Rather than chasing price, I'd prefer to wait for:
✅ Confirmed breakout above resistance
✅ Successful retest of the breakout zone
✅ Price holding above the Daily 200 EMA
✅ Strong volume confirming institutional participation
These factors would provide greater confidence that the trend reversal is sustainable.
🎯 Fibonacci Profit-Taking Zones
If the breakout is confirmed and bullish momentum continues, the next technical objectives based on Fibonacci retracement/extension levels are:
🎯 Target 1: 2.80
🎯 Target 2: 3.20
🎯 Target 3: 3.96
These levels are likely to act as profit-taking and resistance zones, where traders should closely monitor price action.
📊 My View
The chart is approaching a high-probability technical setup, but patience remains the edge.
📈 Bullish Confirmation: Breakout followed by a successful retest above the weekly trendline.
🛡️ Key Support: Daily 200 EMA around 1.97.
🚀 Upside Potential: 2.80 → 3.20 → 3.96, provided the bullish market structure remains intact.
This is a stock worth watching—not chasing. Let the market confirm the breakout, then let the trend do the heavy lifting.
Do you think the weekly trendline retest will ignite the next rally, or is one more shakeout needed before the breakout? Share your analysis below! 👇
⚠️ Financial Disclaimer
Disclaimer: This analysis is shared for educational and informational purposes only and should not be considered financial, investment, or trading advice. Always conduct your own research (DYOR) and apply proper risk management before making any investment decisions.
#Tadawul #SaudiStockMarket #SaudiStocks #TASI #SaudiInvesting #SaudiTrading #SaudiInvestors #KSAStocks #SaudiEquities #RiyadhMarket #MiddleEastMarkets #GCCMarkets
#TechnicalAnalysis #TradingView #PriceAction #MarketStructure #WeeklyTrendline #BreakoutRetest #EMA200 #SupportAndResistance #Fibonacci #TrendFollowing #SwingTrading #BreakoutTrading #MomentumTrading #ChartAnalysis #TradingIdeas #StockAnalysis #RiskManagement #BullishSetup #Investing #StockMarket #WiSHFundManagement  Long
Long
BLK LONG — 4H ALMA Setup (WR 84%)█ SETUP
BlackRock · NYSE:BLK · 4H · long only.
ALMA Averaging Strategy: ALMA 3 / σ2, SD band 2, min diff 6 bar to add / 3 bar to exit, 25% per bar, up to 4 adds, hard stop −10% from average entry.
Strategy Tester (BLK 4H):
Win rate 84% · profit factor 2.5 · max drawdown 9%
Typical hold ~24 bars on winners · asset-manager mean-reversion sleeve
Sister template on same bar (OV8839):
Win rate 83% · profit factor 2.9 · max drawdown 6%
═
█ WHY NOW
Post-PCE Thursday cash open — two independent 4H ALMA long templates fired on the same US bell bar.
Twin 4H entries 26 Jun 13:30 UTC ~ $970.90 each:
· OV8841 (84% WR) · alert 4786837831
· OV8839 (83% WR) · alert 4786833395
Working average ~ $970.90 on two fresh lots; hard stop zone −10% ~ $873.80 . Exits follow Pine ALMA flip + min diff or the hard stop — no discretionary TP ladder.
Price is ~2% under the prior session’s 4H ALMA cluster (~$987) — this is a pullback entry into financials beta, not a breakout chase.
═
█ MACRO
Sector: BLK = world’s largest asset manager — AUM and markets beta, not a single-theme AI name. Earnings quality + ETF flows matter more than one CPI print.
Calendar: Hot Core PCE week — real yields still the swing factor. US cash indices held better than crypto/metals overnight; financials can benefit if the tape reads “soft landing” rather than “re-acceleration.”
Tape: Same Thu bell that tagged PFE / POOL exits elsewhere in the US sleeve — BLK is the quality financial long in that batch.
═
█ OUTLOOK
Positive factors
- 84% / 83% WR on two 4H ALMA exports · PF 2.5–2.9 · max DD 6–9% — tight risk profile vs broad book
- Fresh 26 Jun 13:30Z twin entries inside the 24h publish window
- ALMA (25 Jun board, trust live 4H chart): execution TF LONG · Cur L:1 vs LAvg:3.4 — young above-session, not time-overheated · price was testing ~$987 ALMA before today’s ~$971 fill = deeper discount into the band
- EMA (25 Jun): 4H Cur S:5 vs Avg S:8.9 — below-session not yet overstretched vs average length; 1H Cur S:18 vs Avg S:8.9 — extended sell-time on 1H, but 4H execution bar resets the frame for mean-reversion longs
- 4H SMC In FVG Bull on 24 Jun (~$983) — demand pocket still relevant on pullback toward high-$960s
- Hard −10% stop caps nominal script risk per lot
Negative factors
- Daily ALMA still SHORT on 25 Jun board ( Cur S:5 vs Avg S:3.0 ) — slow grid below daily band; 4H long fights higher-TF headwind until 1D reclaims
- EMA slow TFs Below: 1D/3D/1W all Below with +3.9% to +4.6% dev on 25 Jun — correction leg not cleared on dailies
- 25 Jun daily alert flagged New Bear FVG — overhead supply not fully erased
- Twin templates on one print = correlated adds, not diversification — one ALMA exit closes both legs
- Post-PCE gap risk on 4H US bars — %-stop can slip on headline open
- Past backtest ≠ live fills (spread, session gaps on $900+ prints)
Base case: 4H ALMA holds ~$970 cluster · 1H sell-time exhausts · slow grind back toward mid-$980s / 4H ALMA if US financials stay bid post-PCE.
Bear case: lose 4H ALMA on a risk-off day · daily SHORT ALMA extends · −10% from ~$970.9 toward ~$874.  Long
Long
Visa (V) LONG — 4H ALMA Setup (WR 80%)█ SETUP
NYSE:V · 4H · long only.
(Context: Visa — global card / cross-border payments network.)
ALMA Averaging Strategy: ALMA 3 / σ2, SD band 2, min diff 4/3, 25% per bar, up to 4 adds, hard stop −10% from average entry.
Strategy Tester (V 4H):
Win rate 80% · profit factor 2.2 · max drawdown 44%
Avg winning trade +7.2% · avg losing trade −6.9%
Typical hold ~63×4H bars on winners — payments mega-cap mean-reversion sleeve
═
█ WHY NOW
Wednesday US cash — fresh 4H ALMA long on 09 Jul 17:30 UTC ~ $347.41 .
First lot on the template after a July drift off the ~$360 shelf — bar-close on the 4H sleeve, not a “everyone’s swiping plastic again” headline chase.
Hard stop zone −10% from fill ~ $312.67 . Exits follow Pine ALMA flip + min diff or the hard stop.
═
█ MACRO
Sector: V = payments toll road — cross-border volume, issuer economics, stablecoin / bank-ledger competition on the margin.
Tape (9 Jul): SWIFT’s 17-bank tokenized-deposit pilot and Sony Bank US stablecoin approval keep “who owns the rail” in the feed — sector beta for networks, not a single-name earnings call.
Execution is 4H ALMA on ~$347, not a fintech headline dip-buy.
═
█ OUTLOOK
Positive factors
- 80% WR · PF 2.2 · avg win +7.2% vs avg loss −6.9% on a deep 4H sample
- EMA — overheated below (fuel): 1H Cur S:15 vs Avg S:6.1 · +1.1% dev — stretched below-session on the entry ladder
- SMC — demand at fill: 1D bull FVG enter ~$347.53 · bounce B62% Br38% (n=500)
- SMC — execution TF: 4H bull FVG enter ~$347.52 · B58% Br42% (n=1123) on the bar tag
Negative factors
- EMA — overheated above (chase): 4H Cur L:33 vs Avg L:6.3 · −2.0% dev — long time above EMA on the working TF
- ALMA — OVERHEAT-L: 3D L:7 vs LAvg:3.6 — stretched above the slow band; poor add quality if price extends
- TL AI — bear geometry: Descending Triangle (Expanding) · Br83% B17% (n=12) — pattern history favors break, not bounce
- SMC — weekly ceiling: 1W bear FVG zone ~$362 · Br55% — overhead supply on the July shelf
Takeaway: the 80% 4H template, 1H below-EMA stretch, and daily/4H bull FVG tags support a disciplined bar-close long at ~$347, but 4H time-overheat above EMA, 3D OVERHEAT-L, and expanding-triangle geometry cap upside — payments-rail grind, not a clean discount rip; nominal risk stays on −10% / Pine exit.
Base case: 4H ALMA holds ~$340–355 · bull FVG shelf absorbs dips · slow mean-reversion toward the July range.
Bear case: lose 4H ALMA · Br83% triangle geometry wins · flush toward hard stop ~$312.67 from ~$347 entry.
Chart: NYSE:V 4H — ALMA Averaging Strategy.
Educational idea. Live position — past backtest ≠ future results. NFA.  Long
Long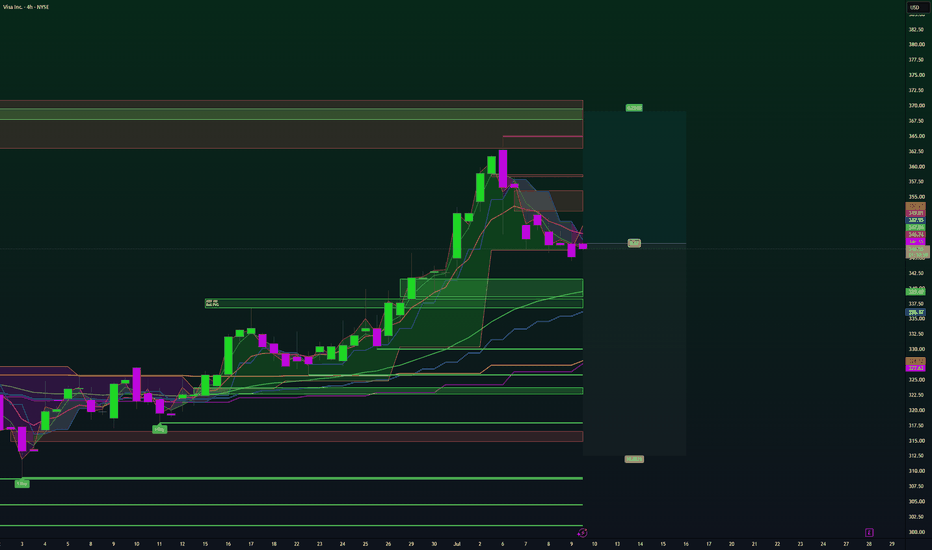
7,440 Remains the Key Level!Hello, traders!
A very brief update on the index today.
🎯💰 The main event was the precise hit of the 7,300 target, followed by a strong reaction from buyers at that level. The rebound looks solid, but the next major level to watch is 7,440, which I’ve mentioned several times before. This area could act as significant resistance and slow the current recovery.
🟢 The green arrows on the chart highlight previous reactions to this level (when price approached it from above), so it shouldn’t be ignored. In addition, the upper boundary of the local descending channel is currently aligned with 7,440. Although it’s only a local channel, it may also temporarily limit further upside.
Other than that, all scenarios remain unchanged.
🐻🪓 As long as SPX remains below 7,440, my downside targets stay the same:
- 7,380 — local swing low.
- 7,300 — horizontal support + 1D EMA 100.
- 7,000 — previous all-time high.
🦬🚀 A confirmed breakout and hold above 7,440 would bring the bullish scenario back into play, with upside targets at 7,555 and then the ATH at 7,625.
Peace! 🌄 Bitcoin Hits 62.6K — Is 65K the Key to Recovery?Hello, traders!
Over the past week, Bitcoin reached every downside target discussed in my previous analyses.
In my last update, I wrote:
“The final downside target at 62.5K — a key support level where Bitcoin has been consolidating since early June — remains untouched for now. However, with the local trendline now broken, all major moving averages lost, the important 65K level reclaimed by the bears, and little sign of meaningful buying interest, I believe a move toward 62.5K is increasingly likely.”
🎯In the end, Bitcoin came within just $100 of that target, bottoming around 62.6K, before staging a solid rebound. Today, the price even attempted to break back above 65K.
🐻🪓That said, the key level remains unchanged. As long as Bitcoin is trading below 65K, another retest of the 62.5K support cannot be ruled out.
🦬🚀The bullish scenario, with upside targets at 67K and 67.6K, will only come back into play if Bitcoin manages to reclaim 65K and, more importantly, hold above it.
Peace 🌄
⚠️ Disclaimer:
All information shared on this channel is for educational and informational purposes only and is not investment advice. The author is not responsible for your trading decisions. Always manage your risk and make your own independent decisions. EURUSD | Buy-Side Liquidity Sweep Signals Bearish ContinuationEURUSD continues to present a bearish technical outlook following a buy-side liquidity sweep above the 1.14750 resistance level and the 2 July high, where price failed to sustain bullish momentum before rejecting lower. This liquidity grab suggests that buying pressure may have been exhausted, shifting the focus towards a potential continuation of the prevailing bearish structure. I will be monitoring a retracement into the highlighted retest zone, where multiple technical factors converge, including the 61.8%–88.6% Fibonacci retracement, previous market structure, and the potential alignment of the 200-period EMA as dynamic resistance. Should sellers defend this area, downside objectives remain the 13 July swing low, the current monthly low, and ultimately the previous month's support. However, a sustained 4-hour close above the liquidity sweep high would invalidate the current bearish thesis and suggest buyers have regained control.
From a fundamental perspective, this outlook is supported by the potential for continued US dollar strength should the Federal Reserve maintain a relatively restrictive monetary policy stance compared with the European Central Bank. A widening interest rate differential in favour of the United States, supported by elevated Treasury yields and resilient US economic data, could continue to underpin demand for the dollar, while softer Eurozone growth or inflation may reinforce expectations of a more accommodative ECB. Market participants should also remain attentive to upcoming high-impact releases, including US CPI, Non-Farm Payrolls, FOMC communications, and Eurozone inflation and ECB policy decisions, as these events may either reinforce or challenge the current macro narrative. While price action will ultimately determine whether this scenario develops, the technical and fundamental backdrop currently remain aligned in favour of further downside unless the stated invalidation level is reclaimed.  Long
Long
 Short
Short
 Long
Long
GBP/USD | Rejection at Key Supply Favors Move Towards 1.3000GBP/USD has rallied into a key area of technical confluence, where I believe bullish momentum is beginning to lose strength. Following the completion of an A–B–C corrective structure, price has tested a well-defined 4-hour rejection area positioned beneath the 15th June High and in close proximity to the 200-period moving average. This region represents a significant supply zone where sellers have previously demonstrated control. Combined with elevated RSI readings and the completion of the corrective advance, the current price action suggests the market may be preparing for a broader bearish continuation. My primary downside objective remains the psychological 1.3000 level, which aligns with both a 1.618 Fibonacci extension and a previously identified support zone, creating a high-confluence target.
To illustrate my projected market sequence, I have incorporated TradingView’s Ghost Feed as a visual representation of the expected price path should sellers continue to defend the highlighted rejection area. The projected candles are intended to support the broader technical narrative rather than serve as the foundation of the analysis. From a macro perspective, while Sterling continues to benefit from a relatively supportive Bank of England stance and recent US dollar softness, I currently view these factors as insufficient to invalidate the technical structure developing on the 4-hour timeframe. Instead, I see the potential for a tactical correction within the broader market context, particularly if upcoming US economic data provides renewed support for the dollar.
Key Takeaway
My bias remains bearish while price continues to respect the highlighted rejection area below the 15th June High. A sustained rejection from this zone would reinforce the expectation of a move towards the 1.3000 key level, while a decisive close above the supply zone would invalidate the current bearish thesis and shift the focus towards further upside. As always, this analysis is based on probabilities rather than certainty, and I will continue to allow price action to confirm or reject the scenario before adjusting my outlook. Short 
 Short
Short
ORCL–High Conviction Bounce Setup At Long-Term SupportLooking at the weekly chart, NYSE:ORCL has just stopped right above a long-term trendline that has acted as major support twice before: during the March 2020 crash and again in October 2022. Both times, touching this trendline marked an important reversal point.
other thing that stands out is the 200-week moving average (blue line). Right now, the price is trading below it, but history suggests Oracle doesn't stay there for long.
Over the last 6 years, ORCL has broken below the 200-week moving average only three times:
1. March 2020 – Price stayed below it for just 3 weeks before reclaiming it.
2. September–October 2022 – Almost the exact same story, only 3 weeks below before breaking back above.
3. Current move – We're now seeing a very similar setup develop.
Zooming out even further, the picture becomes even more interesting.
In the last 15 years, Oracle has traded below the 200-week moving average only four times. Three of those were the periods mentioned above, while the fourth was back in 2016, when the stock stayed below the average for about 8 weeks before recovering (yellow circle).
Historically, ORCL simply doesn't like trading below its 200-week moving average for very long.
That's why I like this setup. We have two strong technical factors lining up:
1. A long-term trendline that has already proven itself as a major reversal area.
2. A stock that has repeatedly reclaimed its 200-week moving average after relatively short periods below it.
Of course, history doesn't guarantee the same outcome this time. The stock can always break down and continue lower.
But from a risk/reward perspective, I think this super attractive bounce setup. My risk is clearly defined, a break below the long-term trendline invalidates the idea while the upside potential is huge.
 Long
Long
Reddit Below Both EMAs Ahead of Q2 EarningsExecutive Summary:
Reddit NYSE:RDDT fell 9.18% on July 23 after the Wall Street Journal reported the company is reconsidering its AI content licensing deal with Google
Shares are trading near $170, having broken below the 50-day EMA ($186.05) and 200-day EMA ($175.92), with a daily low of $166.13
14-day RSI sits near 31, close to oversold, while support levels stack at $166.10, $152.62, and $139.88
Wall Street's price target range is unusually wide, from $110 to $300, averaging around $221, even as Wedbush, Jefferies, and Piper Sandler all remain constructive
Reddit reports Q2 2026 earnings on July 30, with consensus at $0.97 EPS on $732.82 million in revenue, roughly 47% year-over-year growth
Reddit's stock just took one of its sharpest single-day hits of the year, and the trigger wasn't a earnings miss, a lawsuit, or a guidance cut. It was a report that the company might walk away from a deal, its roughly $60 million-a-year AI content licensing agreement with Google, that it currently has. The market sold first and is still waiting to find out whether Reddit actually pulls the trigger.
This drop didn't happen out of nowhere either. Reddit had already pulled back close to 16% from a recent high before this specific headline hit, part of a broader wave of profit-taking across internet and AI-monetization names in July, even as the stock's underlying growth numbers stayed some of the strongest in the sector. That context is important: this is now the second and sharper leg of a decline that started before the Google licensing story ever broke.
The Mechanics: A Clean Break Below Both Major Moving Averages
The technical damage here is specific and measurable. Reddit broke below both its 50-day EMA at $186.05 and its 200-day EMA at $175.92 in the same session, a double breakdown that flipped the near-term trend structure bearish. Price found a floor at $166.13 intraday before stabilizing slightly above the key $166.10 support zone.
RSI near 31 puts the stock close to oversold, which historically precedes at least a short-term bounce, but the broader momentum picture is mixed rather than confirming a reversal. CCI and Momentum indicators have shifted toward buy signals, suggesting the pace of selling may be fading, while MACD continues to reflect the recent downtrend. The first real recovery hurdle sits at the Hull Moving Average near $175.30, with a denser resistance cluster between $181 and $187 where several other moving averages converge.
Market Impact: The Real Question Is What the Deal Is Actually Worth
Reddit's $60 million-a-year licensing agreement with Google, signed in 2024, allows Google to train its AI models on Reddit's user-generated content. The complication is that Google's own AI Overviews feature has started answering user search queries directly, reducing the click-through traffic that would otherwise flow back to Reddit's platform, effectively meaning Reddit may be helping fund the exact AI feature that's cannibalizing its own traffic.
That tension explains why Reddit executives are reportedly reevaluating the arrangement rather than simply renewing it. But the market's reaction, a 9% single-day drop, treats this as a larger threat than the dollar figure alone would suggest. $60 million a year is a modest line item against $732.82 million in expected quarterly revenue. The bigger concern is what it signals about the durability of AI licensing revenue as a category, a growth narrative Wall Street has leaned on heavily to justify Reddit's valuation.
Competing Interpretations: Overreaction or Warning Sign
The bull case is built on fundamentals that haven't actually changed. Reddit just posted its seventh consecutive quarter of revenue growth above 60%, management's ambition to nearly double U.S. daily active users toward 100 million remains intact, and Wedbush, Jefferies, and Piper Sandler have all reiterated constructive ratings through the selloff, with Wedbush naming Reddit a top mid-cap internet pick specifically for its community engagement and AI monetization potential. A 16-23% pullback from recent highs, on a report about one licensing relationship rather than the core advertising business, reads to bulls as a buyable overreaction.
The bear case points to the pattern building underneath the headline. Reddit's Chief Operating Officer sold roughly $7.75 million in stock on July 15, just before this news broke, and institutional holder Allspring Global Investments reportedly cut its stake by nearly 60% in the first quarter. Layer in retail sentiment on Stocktwits turning bearish, with some traders openly calling the stock overvalued, and the Google deal uncertainty looks less like an isolated headline and more like a catalyst that gave existing skeptics a concrete reason to act.
Risk Implications
Buying this dip ahead of the July 30 earnings report means betting that the core advertising and user-growth story, still growing over 60% for a seventh straight quarter, matters more than the AI licensing uncertainty the market just repriced hard. With RSI near oversold and CCI/Momentum flashing early buy signals, a bounce toward the $175-187 resistance cluster is plausible even without the Google deal question being resolved.
Shorting or avoiding Reddit here means missing a stock where three separate analysts have stayed bullish through the drop, but it also means avoiding a name that just broke both major moving averages on a single headline, with recent insider selling and a large institutional stake reduction sitting in the background. The July 30 earnings report will likely be the first real test of which read was correct.
Conclusion
A 9% drop on an unconfirmed report about reconsidering one licensing deal is a strong reaction, and it tells you more about how nervous the market has become around AI licensing revenue broadly than it does about Reddit's core business, which hasn't shown any actual deterioration yet. The July 30 earnings report, and any update on where the Google conversation actually lands, will decide whether this was a buyable overreaction or the first sign of a bigger valuation reset.
Does a $60 million licensing question justify wiping out this much value from a business still growing 60%+ a quarter, or is the market right to treat AI licensing uncertainty as a bigger red flag than the dollar amount suggests? Curious how you're reading this one.
Disclaimer: This analysis is for informational and educational purposes only and does not constitute financial, investment, or trading advice. Technical levels and ratings are derived from a snapshot of trading-app data and are approximate; verify current levels on a live chart before making any decisions. Past performance does not guarantee future results.  Long
Long
 Long
Long