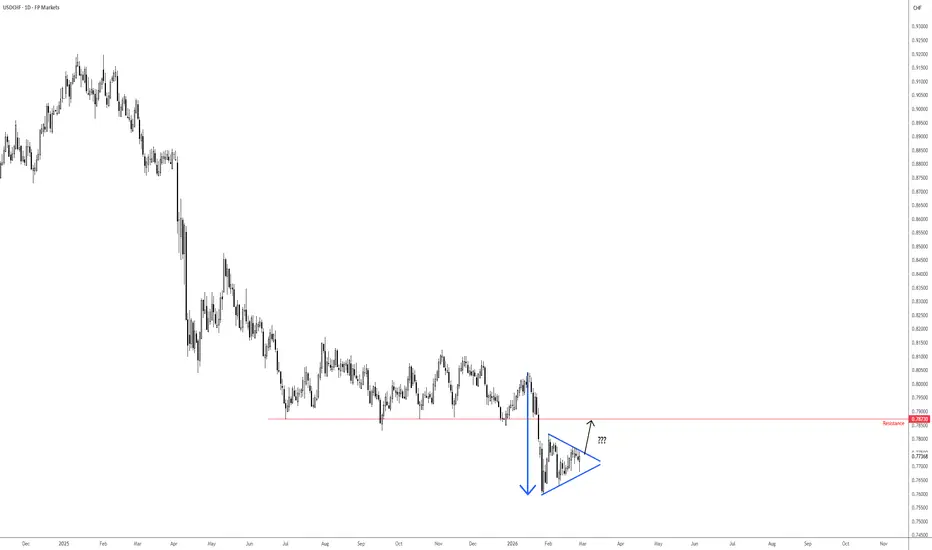
Bearish pennant pattern in focus on USD/CHFKeeping things simple in the FX space today, I decided to highlight a bearish pennant pattern taking shape between the record low of Fr0.7599 and the high of Fr0.7817 on the USD/CHF pair. These are considered ‘continuation’ patterns, meaning price tends to breakout in the direction of the underlying trend, which is evidently south here.
However, the issue I see is that if you assess the price action within the pennant formation, the recent test of the upper boundary failed to prompt a push to the lower border. This – coupled with price approaching the pattern’s apex – suggests potential pattern failure and a breakout to the upside, possibly targeting neighbouring resistance at Fr0.7873.
Written by FP Markets Chief Market Analyst Aaron Hill
Pennant
Btc appears 2 be breaking down from symmetrical triangle/pennatThe full bear pennant breakdown target is all the way at 40k however just the symmetrical triangle on its own is around 54k or so which is the exact target of the previous bear flag shown here with the dotted magenta line. There’s a chance it could finish dumping once it reached the full target of both the symmetrical triangle and the previous bearflag but if we are indeed inside a bear market currently then probability is high that it will also head to the current bear pennant breakdown target of 40k. *not financial advice*
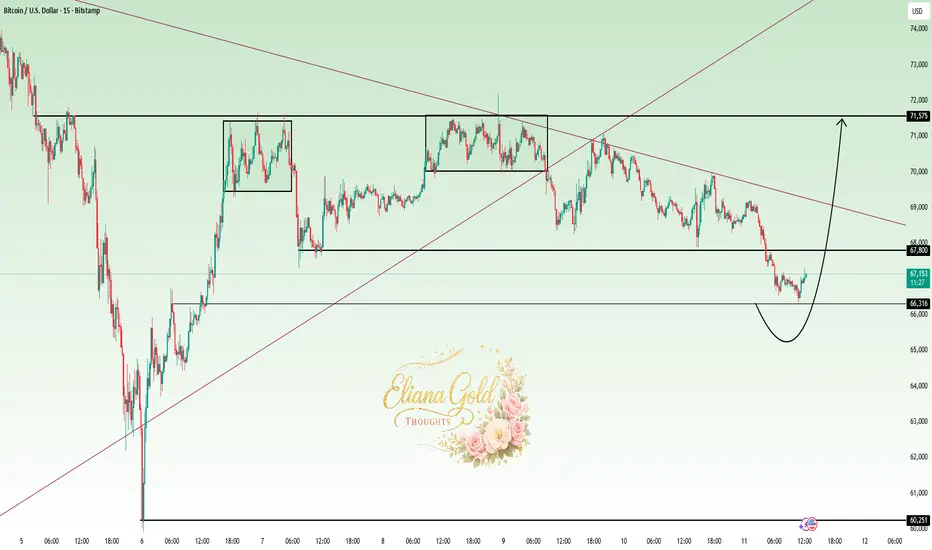
Eliana | BTCUSD · 15M – Pullback Into Demand | Reversal Attempt BITSTAMP:BTCUSD
After rejecting from the 71.5K supply zone, BTC entered a controlled sell-off and respected the 67.8K level before breaking lower. The current price action shows compression into demand, suggesting potential liquidity absorption. If buyers defend this zone, a relief rally toward mid-range resistance becomes likely.
Key Scenarios
✅ Bullish Case 🚀
• Hold above 66,200 demand
• 🎯 Target 1: 67,800
• 🎯 Target 2: 69,000
• 🎯 Target 3: 71,500
❌ Bearish Case 📉
• Clean breakdown below 66,200
• 🎯 Target 1: 64,800
• 🎯 Target 2: 63,000
• 🎯 Target 3: 60,250 (major liquidity)
Current Levels to Watch
Resistance 🔴: 67,800 → 71,500
Support 🟢: 66,300 → 66,200
⚠️ Disclaimer: This analysis is for educational purposes only. Not financial advice.
Bitcoin Is Down 45%+ Since October. What Its Chart Says Now.Bitcoin BITSTAMP:BTCUSD has fallen some 45% since hitting its all-time high in October and has recently been trading at or near 15-month lows. What do its technicals tell us?
Let's check out this chart going back roughly 11 months and running through Wednesday afternoon (Feb. 11):
The above chart uses Bitcoin's dollar prices as reported by Coinbase.
Readers will first note that the world's best-known cryptocurrency developed a bullish-pennant pattern last spring. Marked in green at the chart's left, this is a pattern of trend continuance. That certainly worked well, as BTC rallied into the summer.
Then from August into early October, Bitcoin put in a double-top pattern of bearish reversal, as marked with red jagged lines and red boxes at the chart's center. Again, that set-up worked like a charm -- sending BTC to record intraday highs of about $126,000 on Oct. 6. Wow!
However, Bitcoin then sold off into November ... and that's where the technicals started to fail.
At that point, the cryptocurrency moved into what's known as an "ascending triangle," marked in black at the chart's right. This pattern almost always foretells of a coming volatility period, and it sure did in this case.
That said, ascending triangles are usually bullish -- but not this time. In fact, Bitcoin has more or less been obliterated since it failed to break out of that pattern in early 2026. The cryptocurrency fell some 30% between Jan. 14 and Feb. 11 -- not to mention more than 50% since Oct. 6.
Could Bitcoin go even lower? Of course it could.
For one thing, BTC has been losing value rapidly against the dollar even as the U.S. currency has been dropping relative to other countries' monies. That means that in terms other than in U.S. dollars, Bitcoin is losing value at an even greater pace than the above chart shows.
Meanwhile, Bitcoin's other technical indicators in the chart above are in awful condition.
For instance, the crypto's Relative Strength Index (or "RSI," marked with a gray line at the chart's top) has been skirting along the edge of a technically oversold condition for a couple of weeks now.
And at the chart's bottom, Bitcoin's daily Moving Average Convergence Divergence indicator (or "MACD," denoted by black and gold lines and blue bars) remains extremely bearish in posture.
The histogram of the crypto's 9-day Exponential Moving Average (or "EMA," marked with blue bats) is mired deep into negative territory, as are both Bitcoin's 12-day EMA (the black line) and 26-day EMA (the gold line).
Making matters worse, that black line is running below the gold line. All of that is bearish technically.
(Moomoo Technologies Inc. Markets Commentator Stephen "Sarge" Guilfoyle had no position in Bitcoin at the time of writing this column.)
This article discusses technical analysis, other approaches, including fundamental analysis, may offer very different views. The examples provided are for illustrative purposes only and are not intended to be reflective of the results you can expect to achieve. Specific security charts used are for illustrative purposes only and are not a recommendation, offer to sell, or a solicitation of an offer to buy any security. Past investment performance does not indicate or guarantee future success. Returns will vary, and all investments carry risks, including loss of principal. This content is also not a research report and is not intended to serve as the basis for any investment decision. The information contained in this article does not purport to be a complete description of the securities, markets, or developments referred to in this material. Moomoo and its affiliates make no representation or warranty as to the article's adequacy, completeness, accuracy or timeliness for any particular purpose of the above content. Furthermore, there is no guarantee that any statements, estimates, price targets, opinions or forecasts provided herein will prove to be correct.
Cryptocurrencies are not FDIC insured or SIPC protected. Cryptocurrency trading involves significant risk and potential loss of principal. For more information, see Moomoo's Crypto Risk Disclosure: moomoo.com/us/support/topic4_631 . Crypto services are offered by Moomoo Crypto Inc. (NMLS Number 2287314). Not available in all states, see our full licensing disclosures here www.moomoo.com
Moomoo is a financial information and trading app offered by Moomoo Technologies Inc. In the U.S., investment products and services on Moomoo are offered by Moomoo Financial Inc., Member FINRA/SIPC.
TradingView is an independent third party not affiliated with Moomoo Financial Inc., Moomoo Technologies Inc., or its affiliates. Moomoo Financial Inc. and its affiliates do not endorse, represent or warrant the completeness and accuracy of the data and information available on the TradingView platform and are not responsible for any services provided by the third-party platform.
Nikkei UpsideNikkei -- Breakout after consolidation.......
Strong Bullish Breakout........
Targets mentioned.
FIrst Entry Now.
Second Entry -- after price crosses 52560
Stop Loss -- 50010.
Targets are Fibonacci Ratios as shown on Chart.....
All across the globe are wars. Market dynamics may change drastically at any time.
So please exercise caution and believe in Stop loss...
Imminent break out for SOL!So currently we are in a triangle pattern and compressing/consolidating. There is a micro resistance at 89.61 that must break to continue up to the structural resistance level at $93.65. Expect a strong reaction here, and with a break here we should see an expansion to the upside to about the $106.00 area as depicted by the chart and price projection.
EUR/USD Steadies as Fed Stays Pat, ECB Concerns LingerEUR/USD eased back today after recent strength as sentiment shifted modestly toward the U.S. dollar. The Federal Reserve held rates unchanged as expected, with Chair Powell maintaining a tight-lipped stance that produced a muted market response — EUR/USD briefly dipped below 1.1900 before recovering to around 1.1950. The Fed's upbeat tone on economic conditions has cast some doubt on the timing of future rate cuts, offering modest support to the greenback.
The euro’s broader advance has also been tempered by fresh commentary from ECB policymakers warning that rapid euro appreciation could dampen inflation and complicate monetary policy, a reflection of underlying growth headwinds in the region. While consumer confidence and business sentiment showed pockets of resilience earlier this month, broader price pressures remain subdued and below target, keeping market focus on the ECB's reluctance to tighten further.
In the above chart, EUR/USD rates have quickly regained the bullish uptrend from the January, March, and November 2025 lows, surging to their highest level since June 2021. The consolidative action from last summer can now be interpreted as a bullish pennant. Despite today’s pullback, EUR/USD rates are holding the first key support level should the breakout continue, the September 2025 high at 1.1919. Failure below 1.1919 by the end of the month would likewise put into question the year-long uptrend again; until then, momentum appears to favor the upside.
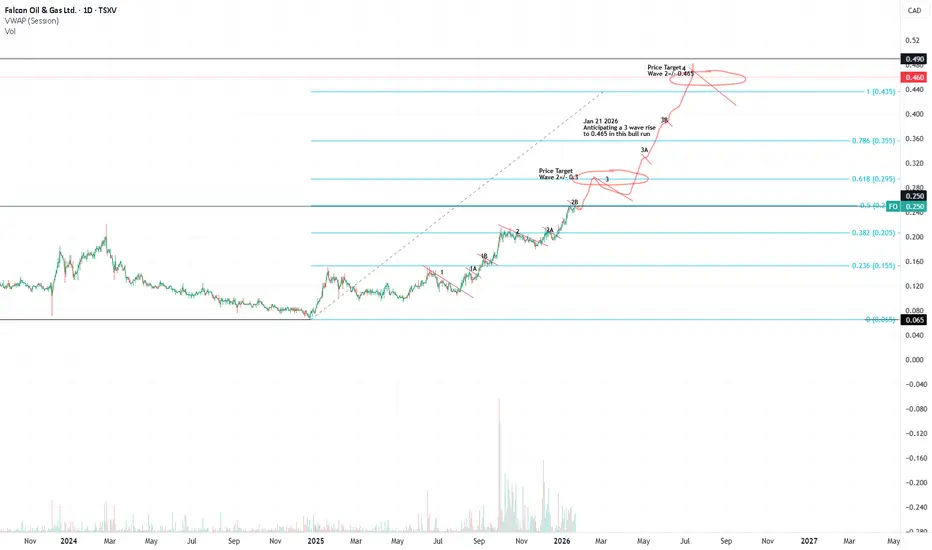
3 Wave uptrend?Was taking a look at FO TSX, looks like a 3 wave uptrend is taking place. I drew a fib grap from Dec 2024, then used the price drift to align the 0.236 level, and used additional data and aligned the 0.382 fib line. I then Identified pull backs, and drew a wavey line to 0.465 price. We will see what happens Cheers
F
Monthly triangle or Daily H&S (EUR/USD)Setup
Neutral - range market - possible top
Monthly triangle pattern (or bull pennant)
Daily chart looks like an incomplete H&S top
Shallow rising trendline is support
RSI support at 33
Commentary
This market could go either way from here - looking to trade inside the range until it breaks.
Strategy
Buy touch of rising trendline
Sell confirmed H&S top pattern
The EURUSD is in a probable distribution phaseThe EURUSD is in a probable distribution phase, and its hinting signs of the start of a markdown or downtrend. Not sure sure about the fundamentals of this pair at the moment but my technical side shows that selling off the pair at the break of the identified trendline on the 4hr timeframe would have higher chances of being a profitable trade. This trade would probably start showing real entries around Thursday 22nd of January or even later or earlier.
GBPJPY Bullish Setup: Combining a Classic & Advanced PatternToday we’re looking at GBPJPY, and what stands out is a high-quality bullish opportunity that blends both a classic pattern formation and an advanced pattern formation into one trade idea.
On the higher timeframes, price recently broke out of a bullish pennant pattern and has recently pulled back to retest the prior structure level that was violated during the breakout.
During the pullback, price action has begun forming a potential bullish Bat pattern.
Three Ways to Trade This Opportunity
1. Trade the Bat Pattern Only
The Bat pattern is a stand-alone trading opportunity. You can execute the trade purely based on the harmonic completion zone, managing risk and taking profits at traditional Bat pattern targets.
2. Use the Bat as Confirmation for the Bigger Breakout Trade
In this approach, the Bat pattern becomes your reason for entry into the larger bullish continuation move that originated from the pennant breakout. Here, the focus is less on harmonic targets and more on holding for trend continuation.
3. Combine Both Approaches (Hybrid Strategy)
This is often the most flexible option. You can:
Take partial profits at traditional Bat pattern levels, but keep a portion of the position open to participate in the larger breakout-driven move
This allows you to reduce risk, pay yourself early, and still maintain exposure to a potentially strong continuation.
Please let me know if you have any questions and feel free to share you views on this pair below.
Akil
Copper -- Bullish MomentumCopper Bullish Momentum.. Still Steam left for upside move...
Copper Futures Completed Following Steps:
1.Reached multi Year/ all time high of 5.94 placed at 24-July-25
2. Reached previous high on 26-Dec-25
3.Corrected around 6% after reaching previous high
4. Break out of last 2 high with momentum and Volume... Breakout with bullish candle.
and continuing
Next Steps:
1. Reaching target1 - 6.746
2. Reaching target2 - 7.12
Please note that these are completely my personal findings.. and conditions depend on market scenarios..
KSE100 — Daily | Breakout Confirmation + Upside TargetsThe index has confirmed a clean breakout from the falling channel and is now holding firmly above the trendline structure. Price has shifted into a stronger bullish posture compared to previous sessions.
The RSI has moved above 60, indicating momentum is entering bullish territory. Multiple higher-timeframe closes (weekly & monthly) also support continuation to the upside.
As long as price remains above the breakout zone, the upward targets remain active:
Targets:
• 170,000
• 175,350
• 179,800
Minor resistance lies near 168,200 and 170,000, but the broader structure favors continuation as long as the breakout holds.
Bias: Bullish
Invalidation: Breakdown below the channel support or failure to hold above the breakout level.
BCH BreakoutI'm seeing a beautiful triangle, almost an ascending triangle, on the BCH weekly chart. It's breaking out of two upper trend lines with two candles come tomorrow Sunday. I'm hoping for a weekly close above $650. I really like the way BCH has been trading since it's predictable and follows rules. There are two trades inside the triangle using the 200MA combined with MACD that executed perfectly so I think that future patterns and behaviors can be relied upon to act in a more predictable fashion than BTC.
Anyway I've written my price goals on the chart for you to look at though I don't plan to take profit on any except for the final goal but I will be adjusting my stop loss as time goes on. Please feel free to comment, I enjoy other perspectives and repartee!
Prebreakout Buildup at a 4-Year Resistance: IPCA LaboratoriesTL;DR: The High-Conviction "Pre-Breakout Buildup & Squeeze" Setup
IPCA Labs is currently edging towards the apex of a year-long pennant consolidation at a major 4-year resistance level. With both NIFTY and NIFTY Pharma indices looking bullishly poised, the odds favor bullish breakout in IPCA soon.
Step 1: The "Forest to the Trees" Filter (Tailwinds)
The Forest (Nifty 50): The broad market is structurally robust, coiling near record highs and positioned for a possible continuation breakout.
The Trees (Nifty Pharma Index): The NIFTY Pharma index also looks good, positioned for a possible bullish breakout.
Conclusion: Macro and sector tailwinds are firmly in place to support individual pharma breakouts.
Step 2: Big Picture (Stan Weinstein Stage Analysis)
The 4-Year Ceiling: The stock has been capped by a major horizontal resistance at ₹1380 since 2021.
The Buildup Phase: An initial breakout attempt in late 2024 failed to sustain, leading to a year-long pennant-shaped continuation pattern. This oscillation has allowed the stock to absorb the multi-year overhead supply.
The Stage: Having spent significant time basing and now coiling at range highs, IPCA is primed for a transition into a decisive Stage 2 Advance.
Step 3: Execution Structure (Prebreakout PA Analysis)
The Buildup: The last 12 months show a tightening "pennant" structure right at the key ₹1380 level - a classic sign of institutional absorption.
Momentum Signal: November 2025 saw a strong bullish monthly bar breaking above the 20-Month EMA and the resistance level on high volume.
The Prebreakout Squeeze: December 2025 is closing as a tight doji above the breakout level. This narrow-spread candle above the EMA/resistance is a "squeeze" that creates tension - and could resolve in an explosive move if bulls can push beyond the year-long pattern's boundary.
Step 4: Fundamental Engine (The Notebook)
Operational Turnaround: Q2 FY2026 saw robust profit growth of 23.13% YoY (₹282.57 Cr) and record quarterly revenue.
Margin Expansion: Standalone EBITDA margins surged to 25.46%, a 257 bps improvement reflecting enhanced operational efficiency.
API Surge: The API business is a major growth driver, with sales increasing 28% to ₹408 Cr in the most recent quarter.
Valuation Gap: Currently trading at a P/B of ~4.9x. While higher than some peers, its ROA of ~7.3% and ROE of ~12.8% are trending upward as operational leverage kicks in.
Financial Health: Maintains a very low debt-to-equity ratio of ~0.19 with an interest coverage ratio of 34.9x.
Possible Entries:
Aggressive: Within the current "squeeze" zone (₹1380–₹1470), as close to the 20-Month, or 20-Week EMA as possible.
Important note for this entry - check how the monthly closes (in 2 days from now). If it closes somewhat like it looks now (a tight doji), then this entry would have decent odds.
Conservative: On a decisive weekly close above the pennant's upper boundary.
Invalidation of the setup: Bearish break & close below the pennant, or below the 20-month EMA (or 20-week EMA if following on weekly)
Disclaimer: This analysis is for educational purposes only and does not constitute financial advice. Market investments are subject to risk; please consult a SEBI-registered advisor before trading.