AUD/USD: Pullbacks to 0.7160 may attract dip buyersAUD/USD has seen a bullish breakout, with the price now trading above Tuesday’s high and the 0.7160 peak set in February 2023.
Should the price retest and bounce from 0.7160, unlike yesterday, it would make for an attractive entry point for longs for those looking for a resumption of the bullish trend, allowing for a stop to be placed underneath to protect against reversal.
The June 2022 high of 0.7282 screens as an appropriate initial target.
Alongside support from rate differentials and tai
Pennant
Selena | BTCUSD · 1H – Liquidity Test Near Channel ResistanceBITSTAMP:BTCUSD BINANCE:BTCUSD
After forming higher lows along the channel support, BTC pushed aggressively into the upper boundary where buy-side liquidity rests above previous highs. Price is currently testing this area of resistance. Such zones often trigger short-term rejections before the market either consolidates or continues toward higher liquidity levels.
Key Scenarios
✅ Bullish Case 🚀
• Hold above 70,000 structure
• Break above 74,000 resistance
• 🎯 Target 1: 75,500
• 🎯 Target 2:
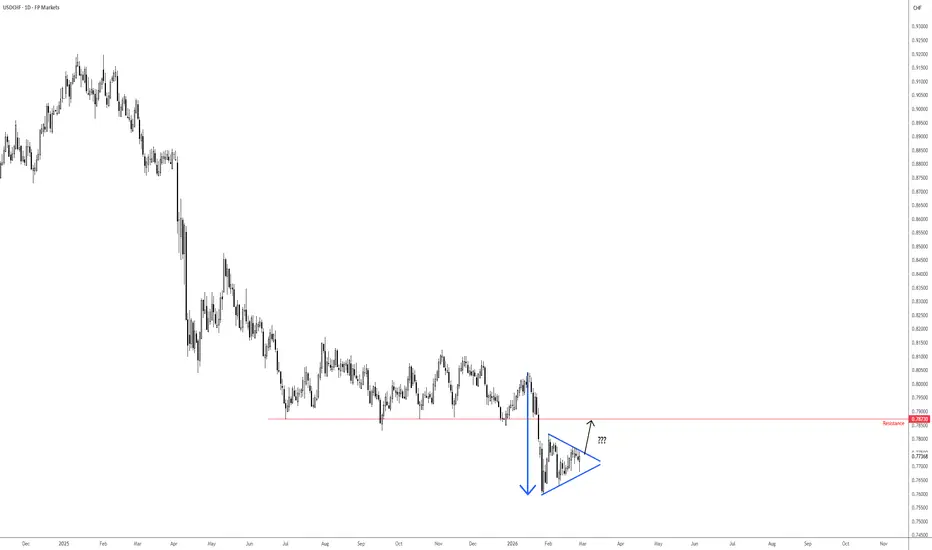
Bearish pennant pattern in focus on USD/CHFKeeping things simple in the FX space today, I decided to highlight a bearish pennant pattern taking shape between the record low of Fr0.7599 and the high of Fr0.7817 on the USD/CHF pair. These are considered ‘continuation’ patterns, meaning price tends to breakout in the direction of the underlying trend, which is evidently south here.
However, the issue I see is that if you assess the price action within the pennant formation, the recent test of the upper boundary failed to prompt a push to
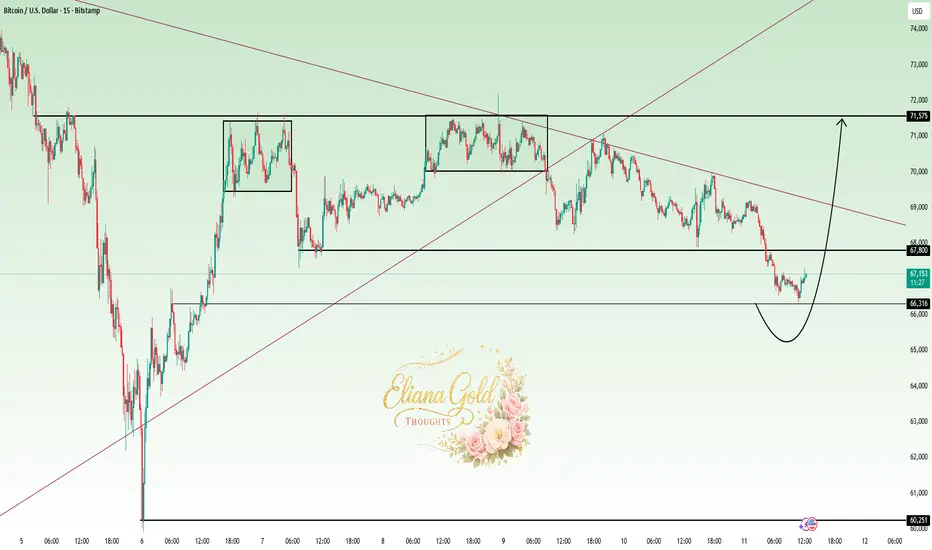
Eliana | BTCUSD · 15M – Pullback Into Demand | Reversal Attempt BITSTAMP:BTCUSD
After rejecting from the 71.5K supply zone, BTC entered a controlled sell-off and respected the 67.8K level before breaking lower. The current price action shows compression into demand, suggesting potential liquidity absorption. If buyers defend this zone, a relief rally toward mid-range resistance becomes likely.
Key Scenarios
✅ Bullish Case 🚀
• Hold above 66,200 demand
• 🎯 Target 1: 67,800
• 🎯 Target 2: 69,000
• 🎯 Target 3: 71,500
❌ Bearish Case 📉
• Clean breakdown below 6
Bitcoin Is Down 45%+ Since October. What Its Chart Says Now.Bitcoin BITSTAMP:BTCUSD has fallen some 45% since hitting its all-time high in October and has recently been trading at or near 15-month lows. What do its technicals tell us?
Let's check out this chart going back roughly 11 months and running through Wednesday afternoon (Feb. 11):
The above chart uses Bitcoin's dollar prices as reported by Coinbase.
Readers will first note that the world's best-known cryptocurrency developed a bullish-pennant pattern last spring. Marked in green at the ch
Nikkei UpsideNikkei -- Breakout after consolidation.......
Strong Bullish Breakout........
Targets mentioned.
FIrst Entry Now.
Second Entry -- after price crosses 52560
Stop Loss -- 50010.
Targets are Fibonacci Ratios as shown on Chart.....
All across the globe are wars. Market dynamics may change drastically at any time.
So please exercise caution and believe in Stop loss...
Imminent break out for SOL!So currently we are in a triangle pattern and compressing/consolidating. There is a micro resistance at 89.61 that must break to continue up to the structural resistance level at $93.65. Expect a strong reaction here, and with a break here we should see an expansion to the upside to about the $106.00 area as depicted by the chart and price projection.
EUR/USD Steadies as Fed Stays Pat, ECB Concerns LingerEUR/USD eased back today after recent strength as sentiment shifted modestly toward the U.S. dollar. The Federal Reserve held rates unchanged as expected, with Chair Powell maintaining a tight-lipped stance that produced a muted market response — EUR/USD briefly dipped below 1.1900 before recovering to around 1.1950. The Fed's upbeat tone on economic conditions has cast some doubt on the timing of future rate cuts, offering modest support to the greenback.
The euro’s broader advance has also be
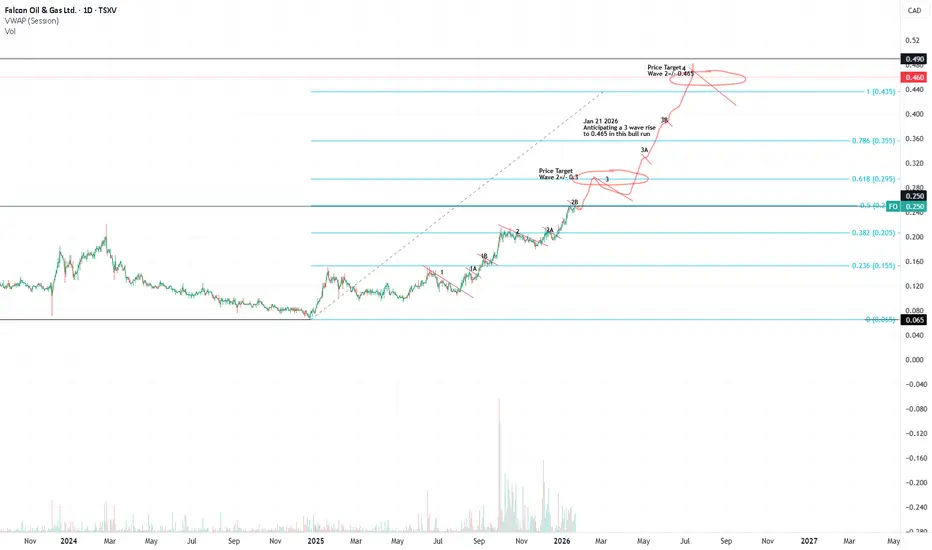
3 Wave uptrend?Was taking a look at FO TSX, looks like a 3 wave uptrend is taking place. I drew a fib grap from Dec 2024, then used the price drift to align the 0.236 level, and used additional data and aligned the 0.382 fib line. I then Identified pull backs, and drew a wavey line to 0.465 price. We will see what happens Cheers
F
Monthly triangle or Daily H&S (EUR/USD)Setup
Neutral - range market - possible top
Monthly triangle pattern (or bull pennant)
Daily chart looks like an incomplete H&S top
Shallow rising trendline is support
RSI support at 33
Commentary
This market could go either way from here - looking to trade inside the range until it breaks.
Strategy
Buy touch of rising trendline
Sell confirmed H&S top pattern
The EURUSD is in a probable distribution phaseThe EURUSD is in a probable distribution phase, and its hinting signs of the start of a markdown or downtrend. Not sure sure about the fundamentals of this pair at the moment but my technical side shows that selling off the pair at the break of the identified trendline on the 4hr timeframe would have higher chances of being a profitable trade. This trade would probably start showing real entries around Thursday 22nd of January or even later or earlier.
GBPJPY Bullish Setup: Combining a Classic & Advanced PatternToday we’re looking at GBPJPY, and what stands out is a high-quality bullish opportunity that blends both a classic pattern formation and an advanced pattern formation into one trade idea.
On the higher timeframes, price recently broke out of a bullish pennant pattern and has recently pulled back to retest the prior structure level that was violated during the breakout.
During the pullback, price action has begun forming a potential bullish Bat pattern.
Three Ways to Trade This Opportunity
Copper -- Bullish MomentumCopper Bullish Momentum.. Still Steam left for upside move...
Copper Futures Completed Following Steps:
1.Reached multi Year/ all time high of 5.94 placed at 24-July-25
2. Reached previous high on 26-Dec-25
3.Corrected around 6% after reaching previous high
4. Break out of last 2 high with momentum and Volume... Breakout with bullish candle.
and continuing
Next Steps:
1. Reaching target1 - 6.746
2. Reaching target2 - 7.12
Please note that these are completely my personal findings.. and c
KSE100 — Daily | Breakout Confirmation + Upside TargetsThe index has confirmed a clean breakout from the falling channel and is now holding firmly above the trendline structure. Price has shifted into a stronger bullish posture compared to previous sessions.
The RSI has moved above 60, indicating momentum is entering bullish territory. Multiple higher-timeframe closes (weekly & monthly) also support continuation to the upside.
As long as price remains above the breakout zone, the upward targets remain active:
Targets:
• 170,000
• 175,350
• 179,80
BCH BreakoutI'm seeing a beautiful triangle, almost an ascending triangle, on the BCH weekly chart. It's breaking out of two upper trend lines with two candles come tomorrow Sunday. I'm hoping for a weekly close above $650. I really like the way BCH has been trading since it's predictable and follows rules. There are two trades inside the triangle using the 200MA combined with MACD that executed perfectly so I think that future patterns and behaviors can be relied upon to act in a more predictable fashion
Prebreakout Buildup at a 4-Year Resistance: IPCA LaboratoriesTL;DR: The High-Conviction "Pre-Breakout Buildup & Squeeze" Setup
IPCA Labs is currently edging towards the apex of a year-long pennant consolidation at a major 4-year resistance level. With both NIFTY and NIFTY Pharma indices looking bullishly poised, the odds favor bullish breakout in IPCA soon.
Step 1: The "Forest to the Trees" Filter (Tailwinds)
The Forest (Nifty 50): The broad market is structurally robust, coiling near record highs and positioned for a possible continuation breakout.