Long
Long
Long 
 Long
Long
 Long
Long
Short 
 Long
Long
 Short
Short
 Short
Short
BTC Market AnalysisCRYPTO:BTCUSD
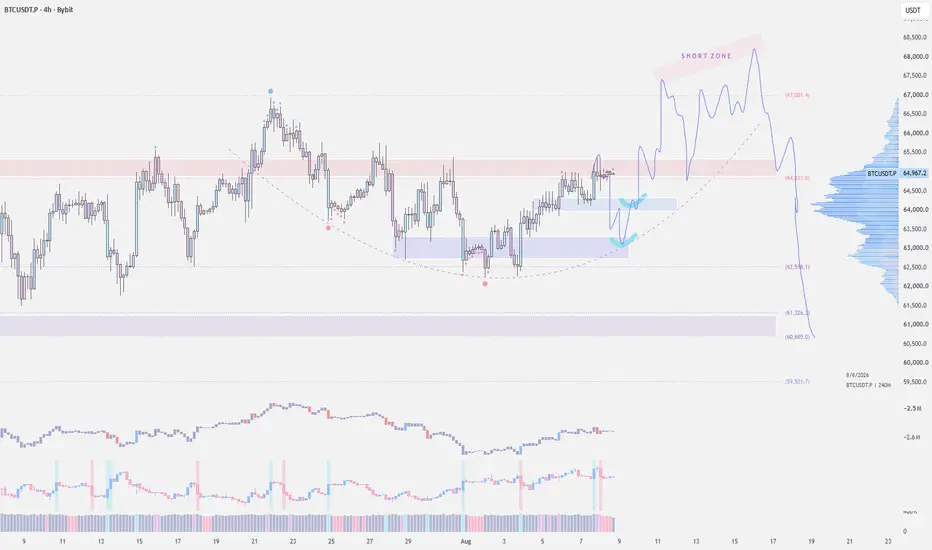
Based on the shared chart, Bitcoin is at an important structural decision point after spending several weeks consolidating following the sharp decline from the May high. The chart shows a long-term descending trendline, multiple higher-timeframe support/resistance levels, and a projected path that suggests BTC could first test resistance, potentially pull back, and then attempt a larger breakout.
Current Market Structure
BTC has been consolidating broadly between the 61,344–66,898 region. The important development is that price is now approaching the long-standing descending trendline that has been controlling the market since the May top.
This makes the current area particularly important.
A decisive break above the descending trendline would represent a significant structural change because the trendline has previously acted as resistance during the entire corrective phase.
Immediate Resistance
The first important level is:
65,357.3 – 4H Resistance
BTC is currently trading just below this level.
A sustained breakout above 65,357 would strengthen the short-term bullish structure and open the possibility of testing:
66,897.7 – Daily Resistance
This is the major resistance marked on the chart.
A successful breakout above 66,897.7 would be particularly significant because it would place BTC above the major daily resistance as well as the broader corrective structure.
Bullish Scenario
The projected path on the chart suggests a potential sequence where BTC initially moves higher, encounters resistance, experiences a pullback, and then attempts another breakout.
The bullish progression would be:
65,357 → 66,898 → 68,000+ → 74,000–75,000
The key confirmation is not simply touching these levels, but breaking and holding above them.
If BTC can establish acceptance above 66,897.7, the market could transition from a prolonged consolidation phase into a new bullish expansion.
The projected upside shown on the chart points toward approximately 74,000–75,000 as the next major area of interest.
Pullback Scenario
The chart also highlights the possibility of a rejection from the 65,357–66,898 resistance region.
If that happens, the first important support is:
63,565.1 – 4H Support
This is the first level where buyers would need to defend the market.
If BTC holds this level, the pullback can still be considered a normal correction within the developing bullish structure.
A deeper correction could then move toward:
62,386.7 – Intermediate Support
This level becomes important if sellers successfully push BTC below the 4H support.
Major Support
The most important downside level on the chart is:
61,344.8 – Daily Support
This is the major higher-timeframe support highlighted in green.
A decline toward 61,344.8 would represent a much deeper retracement, but it would also bring BTC into a major area where buyers could attempt to rebuild the bullish structure.
As long as this level holds, the broader consolidation structure remains intact.
A sustained breakdown below 61,344.8, however, would weaken the bullish thesis considerably.
The Key Structural Development
The most important feature of this chart is the descending purple trendline.
Bitcoin has been trading beneath this trendline since the major decline from the May high. Therefore, the interaction between price and this trendline could be more important than any individual lower-timeframe level.
There are essentially two possibilities:
Breakout:
BTC breaks the descending trendline → reclaims 65,357 → breaks 66,897.7 → potentially enters a larger bullish expansion.
Rejection:
BTC rejects the trendline/resistance → pulls back toward 63,565, 62,386, or potentially 61,344 → buyers attempt to establish another base.
This is why the current region should be treated as a decision zone rather than assuming an immediate breakout.
Key BTC Levels
Level Importance
74,000–75,000 Potential Upside Objective
66,897.7 Daily Major Resistance
65,357.3 4H Resistance
63,565.1 4H Support
62,386.7 Intermediate Support
61,344.8 Daily Major Support
Overall Outlook
BTC is approaching a major structural inflection point. The market has spent a considerable period consolidating below the descending trendline, and price is now moving toward the 65,357–66,898 resistance region.
A sustained breakout above 66,897.7 would be the strongest bullish confirmation on this chart and could signal the end of the prolonged corrective structure, with 74,000–75,000 becoming a potential upside area.
On the other hand, rejection from the resistance zone could send BTC back toward 63,565, 62,386, or even 61,344, where the market would need to demonstrate another strong buyer reaction.
The key levels to watch are therefore 65,357 for the immediate breakout, 66,898 for major confirmation, and 61,344 for the broader bullish structure.  Long
Long
Long 
 Long
Long
 Long
Long
TEM: From losing money to making itNASDAQ:TEM
Tempus AI builds the largest platform of clinical and genomic data, combining diagnostics, artificial intelligence, and drug development. The company partners with AstraZeneca, Bristol Myers Squibb, BioNTech, and other major pharmaceutical companies. The stock trades on NASDAQ.
Fundamentals
The Q2 2026 report confirmed a fundamental business turnaround. Revenue grew 22 percent year-over-year to $382.5 million, beating analyst consensus. Diagnostics contributed $289.3 million (+20 percent), while the Data & Applications segment grew to $93.2 million (+28 percent). Adjusted loss per share came in at $0.04, beating expectations by 4 cents.
The main event of the quarter was the company's first-ever GAAP profit of $5.6 million, compared to a $42.8 million loss a year earlier. Adjusted EBITDA turned positive for the first time at $8.0 million. Gross profit rose to $246.5 million, with gross margin reaching 64.4 percent, confirming the scalability of the business model.
Cash and liquid investments on the balance sheet grew to $820.7 million. Operating cash flow remained negative at $7.5 million due to M&A expenses, but management confirmed a path to positive free cash flow by the end of 2026. In July, the company raised $460 million in convertible notes at 0 percent interest, fully refinancing expensive debt from Ares Capital, saving over $30 million in annual interest expenses.
Management raised full-year 2026 revenue guidance to $1.595–1.605 billion, raised adjusted EBITDA guidance to $65 million, and confirmed positive free cash flow by year-end.
Catalysts
Oncology test volume grew 31 percent year-over-year. MRD testing increased to approximately 9,000 tests per quarter. The medical data licensing segment grew 36 percent, with new long-term contracts signed during the quarter totaling around $200 million. AI attachment to core solid tumor tests reached 45 percent, serving as a powerful client retention driver.
Tempus is acquiring Personalis for $1.6 billion, strengthening its position in the $20 billion MRD diagnostics market. FDA approval for the xT CDx test will add approximately $85 million in annual revenue starting in 2027 through premium ADLT pricing. An FDA decision on the xF liquid biopsy is expected in the second half of 2027, with potential to generate up to $400 million in incremental net revenue by 2028.
Risks
The integration of Personalis remains the main operational risk. Temporary pressure on free cash flow and moderate dilution from the deal are possible. The legacy diagnostics segment shows slower growth rates.
Capital structure
Institutional investors control 61.5 percent of shares. Short interest stands at approximately 6.8 percent of the float with Days to Cover at 2.4 days. Analyst consensus remains Strong Buy with an average price target around $68. The next earnings report is scheduled for early November 2026, with the Personalis deal expected to close around the end of 2026 or early 2027.
Technicals
On the weekly timeframe, the long-term decline from historical highs near $104.32 has concluded, and price has entered a phase of deep medium-term consolidation. The key support level is the strong horizontal zone of $40.00–$41.00, representing a major historical demand area. The recent local low of $40.77 proved to be a false breakdown: the market quickly absorbed all selling, and the weekly close significantly above support with a long lower wick confirmed strong buyer interest and defense of this zone by large participants. The strength of the reversal impulse is confirmed by a significant rise in vertical trading volume on the rebound candles, as well as RSI and MACD beginning to exit extreme weekly oversold territory, signaling seller exhaustion. The upward movement from support breaks down into several sequential phases: the first local target is full closure of the gap in the $48.00–$50.00 range. Since this segment lacks traded volume and horizontal resistance levels, price can move quickly through this vacuum up to the gap's upper boundary at $51.00. Successful gap closure opens the path to the first independent technical target — strong mirror resistance at $63.61, which previously served as a key local high and a profit-taking zone. A confirmed break above this level would signal a full medium-term trend reversal. Above $63.61, the next medium-term target is historical resistance at $73.21.
Tempus is gradually transitioning from a story about AI spending to a story about a profitable healthcare business. The first GAAP profit, raised full-year guidance, nearly $821 million in liquidity, a path to positive FCF, and an expanding product pipeline create a foundation for the next phase of revaluation.
This publication is for informational purposes only and does not constitute individual investment advice. Share your thoughts in the comments and don‘t forget to like this idea if you found it helpful!  Long
Long
 Long
Long
 Long
Long
Long 
Long 
 Long
Long
POONAWALA FINCORPPoonawalla Fincorp Ltd. (CMP ₹490.00, NSE: POONAWALLA)
The SmartWay Research Desk | 7 August 2026
A Pune‑based NBFC, incorporated in 1984 (formerly Magma Fincorp, rebranded after acquisition by the Poonawalla Group). The company operates across consumer loans, MSME financing, personal loans, business loans, and digital lending solutions, with a strong focus on technology‑driven retail credit.
Promoter Holding (Mar 2026): Cyrus Poonawalla Group — 62.9% stake (no pledges)
FY22–FY26 Snapshot
Revenue Growth: FY26 revenue ₹3,842 Cr vs ₹3,212 Cr in FY25 (+19.6% YoY). → Good
Net Profit: FY26 PAT ₹1,012 Cr vs ₹842 Cr in FY25 (+20.2% YoY). → Good
Operating Margin: FY26 EBITDA ₹1,812 Cr, margin 47.2% vs 46.0% last year (+120 bps). → Good
Equity Capital: Stable, face value ₹2. → Good
Dividend Policy: Dividend ₹6.00/share declared for FY26. → Good
Asset Building: Investments in digital lending platforms and AI‑driven credit scoring. → Good
Sales: Strong demand from personal loans and MSME financing. → Good
Expense: Credit costs remain under control; GNPA ~1.5%. → Neutral/Good
EPS: FY26 EPS ₹24.25 vs ₹20.15 last year (+20.3%). → Good
Institutional Interest & Ownership Trends (Mar 2026)
Promoter Holding: 62.9% (no pledges)
FII Holding: 14.12%
DII Holding: 15.34%
Retail & Others: 7.64%
Strategic Moves & Innovations
Expansion in digital lending and fintech partnerships.
Focus on MSME financing and personal loan growth.
Partnerships with banks and fintechs for co‑lending.
Diversification into secured loans and credit cards (pilot stage).
Cash Flow & Balance Sheet Strength
Market cap ~₹38,200 Cr.
Debt‑to‑equity ratio ~3.2 (typical NBFC leverage).
Book value per share ₹182.40; P/B ~2.7.
EPS (TTM) ₹24.25; P/E ~20.2.
Risk Factors
Moderate P/E ratio ~20.2, valuations fair.
Dependence on retail credit demand and interest rate cycles.
Exposure to regulatory changes in RBI norms for NBFCs.
Competition from Bajaj Finance, Aditya Birla Capital, and L&T Finance.
Investor Takeaway
Poonawalla Fincorp has delivered robust FY26 performance, supported by digital lending expansion, MSME financing, and strong credit discipline. With promoter backing, dividend payouts, and leadership in retail NBFC space, Poonawalla Fincorp remains a mid‑cap financial services growth play. At CMP ₹490.00, valuations are reasonable (P/E ~20.2, P/B ~2.7), offering balanced risk‑reward.  Long
Long