OP could become one of the most bullish altcoins in the market !On the chart, we can see several candles at the bottom with long lower wicks and small bodies. These are essentially long-legged doji candles, which indicate strong buying pressure.
Following these candles, a large bullish candle reclaimed a key level, reinforcing the bullish case.
We can also see a large bearish candle near the lows. This appears to have been a fear candle designed to shake out retail traders and force them out of their positions at the bottom.
Based on these signals, it is reasonable to expect that smart money may step into OP with significant buying pressure and potentially drive the price toward the targets marked on the chart.
If a pullback to the key level occurs, it will serve as our entry zone.
A daily candle close below the invalidation level will invalidate this outlook.
If you would like us to analyze a coin or altcoin for you, first like this post, then comment the name of your altcoin below.
What is your opinion about OP?
Pivot Points
EURUSD: Support & Resistance Analysis for Next Week 🇪🇺🇺🇸
Here is my latest structure analysis and important supports and
resistances for EURUSD for next week.
Consider these structures for pullback/breakout trading.
❤️Please, support my work with like, thank you!❤️
I am part of Trade Nation's Influencer program and receive a monthly fee for using their TradingView charts in my analysis.
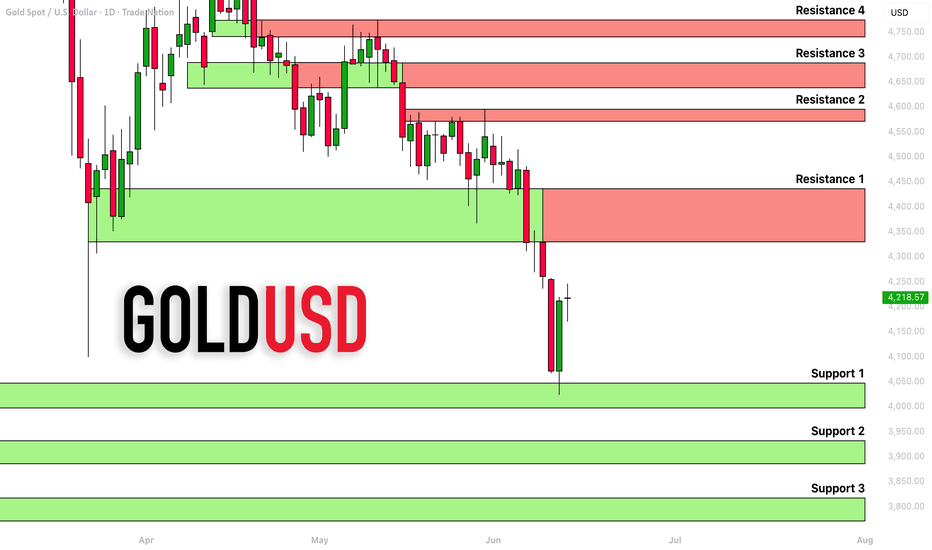
GOLD (XAUUSD): Support & Resistance Analysis for Next Week
Here is my latest structure analysis for Gold.
Support 1: 3997 - 4047 area
Support 2: 3886 - 3932 area
Support 3: 3771 - 3817 area
Resistance 1: 4329 - 4435 area
Resistance 2: 4570 - 4595 area
Resistance 3: 4639 - 4689 area
I think that the market has a strong potential to rise and reach Resistance 1.
Consider these structures for pullback/breakout trading.
❤️Please, support my work with like, thank you!❤️
I am part of Trade Nation's Influencer program and receive a monthly fee for using their TradingView charts in my analysis.
My View on ONGC — Daily Chart**1. Key Observation**
ONGC is moving towards an important demand zone around **₹238–₹241**.
The **May 29 candle** initiated heavy buyer activity, which looks like possible absorption from lower levels. On **Jun 4**, price created resistance, acting like a **dynamic pivot**.
Now price is coming back near the support area, and the **Jan 9 candle wick zone** can act as an important support reference. Also, near **₹261**, a Fair Value Gap is visible, which can act as the first upside magnet if reversal starts.
**2. My View**
I am not looking to chase at the current level. My buy interest starts only if ONGC comes near **₹241** and shows support / buyer reaction.
If buyers defend this zone, ONGC can give a short-term reversal move.
**3. Invalidation**
The setup becomes invalid if ONGC gives a **daily candle close below ₹238**.
**4. Risk-Reward**
Entry near **₹241**, SL below **₹238**, and target near **₹262** gives approx **1:7 risk-reward**, which makes this setup attractive for a long-side study.
**5. Target Point / Range**
Target: **₹262**
Extended range: **₹268** if momentum continues.
**6. Why It’s Good for Long**
This is good for a long setup because price is coming into a demand zone, risk is small, and upside room is bigger compared to the stop-loss. The chart also shows possible buyer absorption near lower levels.
**7. Time Period**
This view is mainly for the **July contract**, if planning through options. Since it is an option trade setup, entry timing and support confirmation near **₹241** are very important.
I am not a SEBI-registered analyst. This idea is shared purely for educational and study purposes. Please do your own analysis or consult a certified financial advisor before taking any trades.
#ONGC #VPA #VolumeProfile #PriceAction #FairValueGap #SupportAndResistance #OptionsTrading #JuneContract #IndianStockMarket
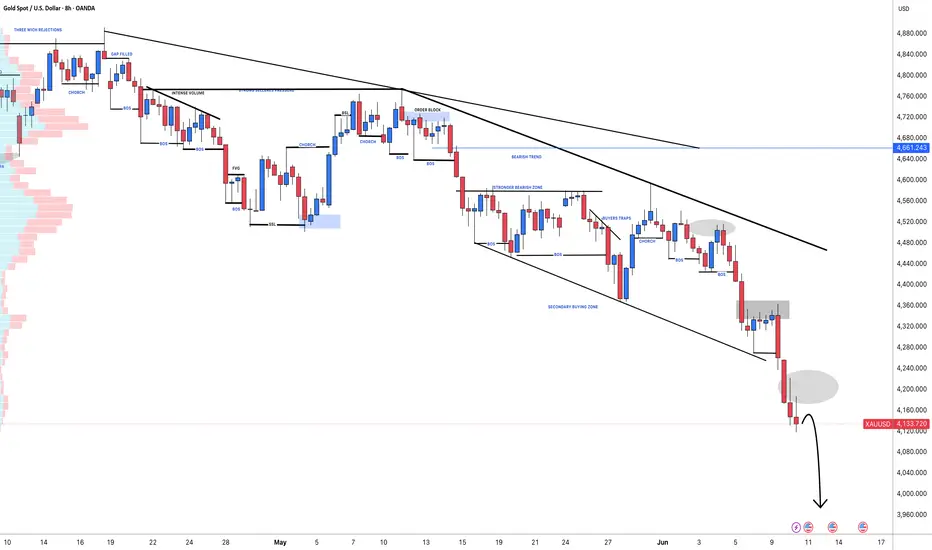
XAUUSD: Gold To Continue Dropping Until $3900Gold prices have been declining since the worsening geopolitical situation prompted investors to liquidate their positions. We’re currently targeting the $3900 region, which is likely to be reached in the near future. This is a swing selling strategy so there’s only one target. You can enter within the current price range using smaller timeframes. Always manage your risk while trading.
Good luck and trade safely!
The Setupsfx_ Team
GBPUSD: Swing Sell Move In Making, Get Ready! Dear Traders,
GBPUSD has been under strong bearish pressure in recent days, evidenced by both volume and price movement. This is due to robust USD support, which is keeping the price down further. While the drop hasn’t been as pronounced as initially anticipated, we should expect further declines as the DXY surpasses 100. Currently, there’s only one target but you can set your own target and stop-loss based on your risk management. Remember, market conditions can change rapidly, especially given the ongoing conflict in the Middle East. Therefore, trade responsibly.
Good luck and trade safely!
The Setupsfx_ Team
NOT Local trend. Sideways -98%. Reversal zones 27 01 26Logarithm. 3-day time frame.
The price in the main trend is still in a downward channel with a given volatility range.
Medium-term - locally , another sideways trend has formed (the third in a downward channel), but the decline is already -98% (not counting the futures long, which was previously down by -99%). Typically, such low-liquidity hype scams decline by -94-98% (with rare exceptions of -99% or a complete scam project, based on some fiction).
It's important to understand that the creators of such cryptocurrencies always sell at any price (they're created for profit, under the hype). But at low price levels (-94-99%), a dilemma arises:
1️⃣ invent a reason for a scam and abandon the project;
2️⃣ or reverse the trend and temporarily restore faith in the scam cryptocurrency. This will, in turn, continue selling.
You can exploit this and profit from it. But, in the long term, it's best to be cautious with such assets. This applies to absolutely all cryptocurrencies created for hype and with no real future use. When trading such dying former super-hypes, manage your risks. This is the foundation. If you can't manage it, avoid it.
NOT Main Trend. Descending Channel -98% 01/27/2026Logarithm. Time frame: 1 week.
The price is in the main trend and remains in a downward channel with a given volatility range.
It's important to understand that the creators of this cryptocurrency always sell at any price (they're created for profit, fueled by hype). However, at low prices (-94-99%), a dilemma arises:
1️⃣ invent a reason for a scam and abandon the project;
2️⃣ or reverse the trend and temporarily restore faith in this scam cryptocurrency. In order to continue sales.
You can use this and profit from it. But, in the long term, you should be cautious with such assets. This applies to absolutely all cryptocurrencies created for hype and without any real future use. When trading such a dying former super-hype, manage your risks. This is the basic principle. If you can't do this, avoid it.
NOT Local trend. Sideways. -98%. Reversal zones 27 01 26
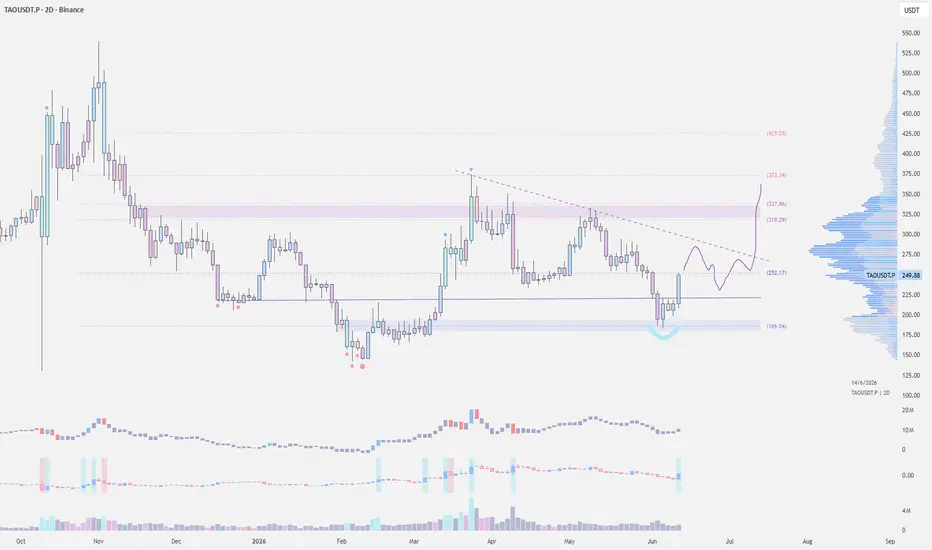
$TAO - Perfect Demand Zone RetestBINANCE:TAOUSDT recently swept into the daily demand zone around $180 and delivered a strong reaction, confirming buyers are still defending this area. We've got a perfect retest of the daily demand at $180, followed by a sharp bounce that pushed price back above the local range lows.
Price has started building a base above the $200 level, which now becomes the key support to watch. Holding above this region would keep the current recovery structure intact and increase the probability of a move higher.
The next hurdle remains the descending trendline that has capped price since the March highs. I think if we continue to hold $200 support, we could retest the $320-$350 area short term.
ATOM Is Approaching a Key Support Level !Following the major CH, ATOM made a bullish move and broke above an important bearish trendline. It is now pulling back toward this trendline.
Within the demand zone, you may look for buy/long opportunities after receiving proper confirmation. Be sure to manage your risk appropriately.
The targets are marked on the chart. We recommend moving your stop-loss to breakeven at the first target and securing a portion of your profits, so that any potential downside reversal does not erase your gains.
A daily candle close below the invalidation level will invalidate this bullish outlook.
If you would like us to analyze a coin or altcoin for you, first like this post, then comment the name of your altcoin below.
What is your opinion about COSMOS?
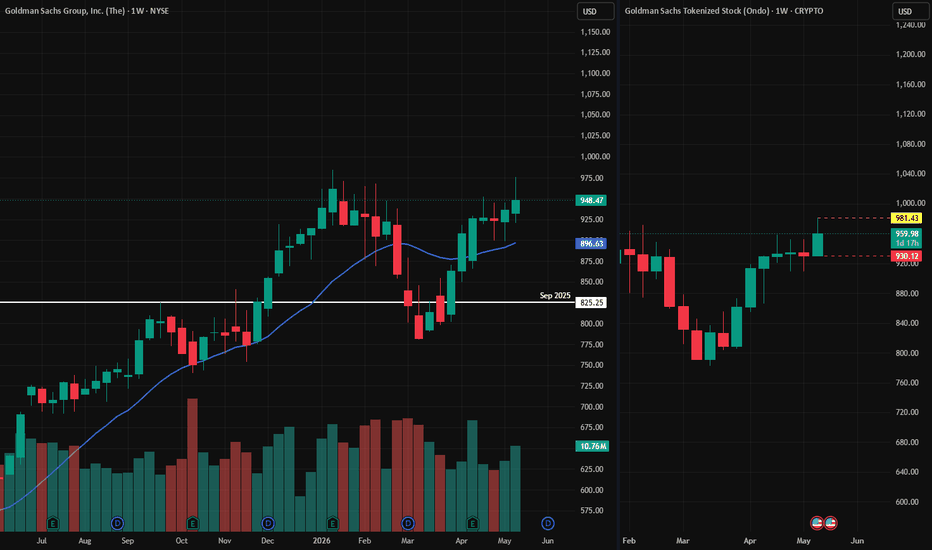
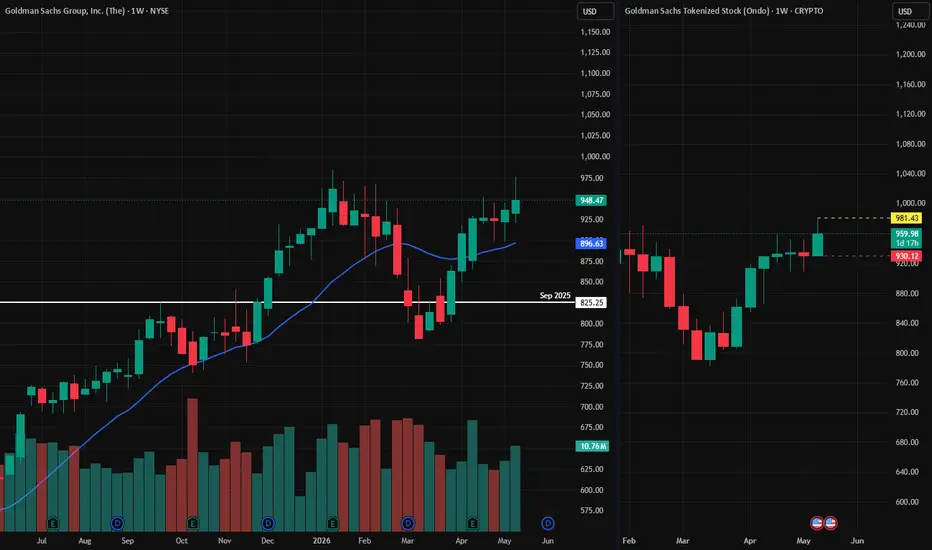
GS | May, 2026 | Continued stock growth- Exchange: Bitget TradFi
- Instrument: CRYPTO:GSONUSD
- Timeframe: Weekly
- Trade type: Buy stop order
- Price: 981.43
- Take Profit: Open
- Stop Loss: 930.12 (-5.20 %)
Idea: Long on a breakout above last week's high — bullish momentum continuation.
Entry: Buy stop above last week’s high.
Stop-loss: Below the low of the same candle.
If the weekly candle closes below this level, the trade is invalidated.
Take Profit: Trailing stop following the lows of new weekly candles.
👉 Bitget TradFi | 200+ U.S. stocks | 0% trading fees
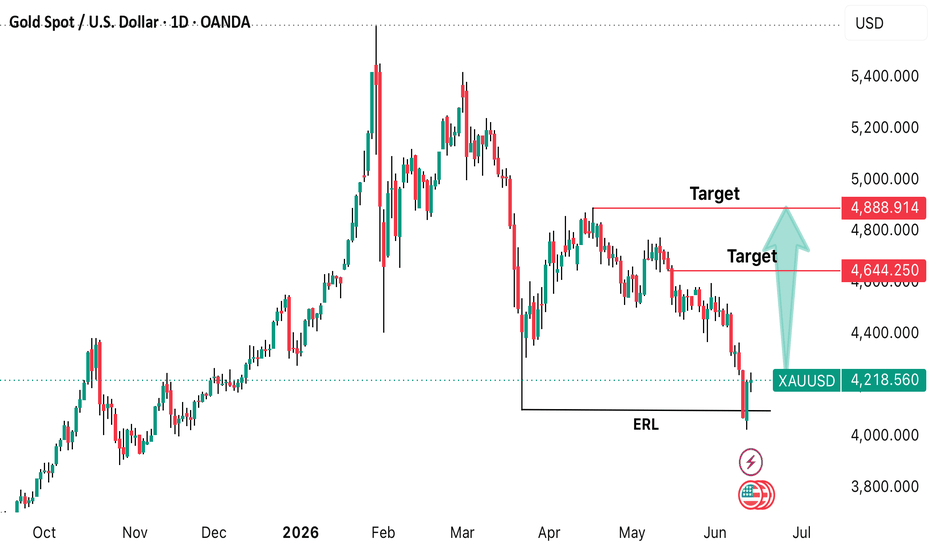
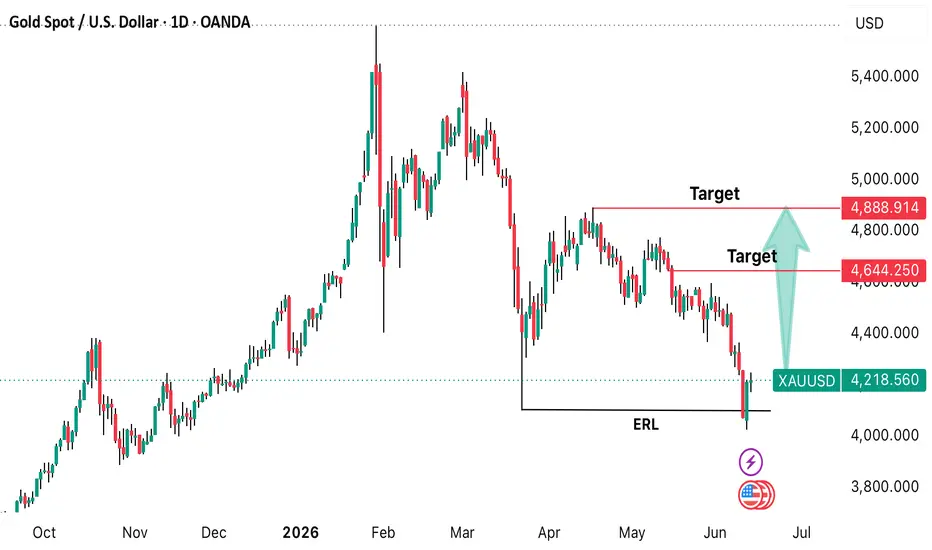
Gold Bullish Reversal Setup LoadingThe chart highlights a possible reversal structure after a sharp sell-off into liquidity. The strong reaction from the discount zone indicates demand presence. Bulls need sustained buying pressure to push price toward 4,644 and eventually 4,889.
Market makers often seek liquidity before major moves. Gold appears to have completed a liquidity sweep, and the next focus is whether buyers can maintain control and drive price into premium targets.
Not Financial Advice.
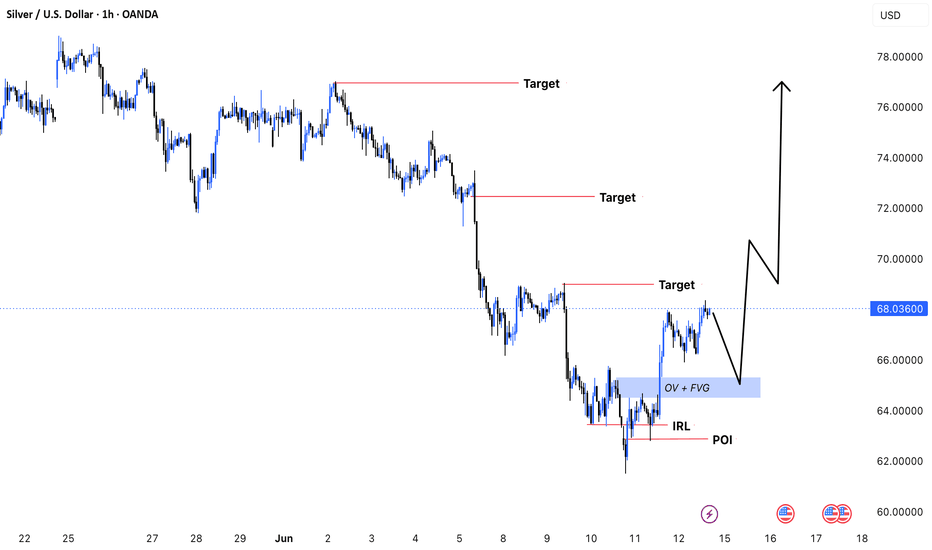
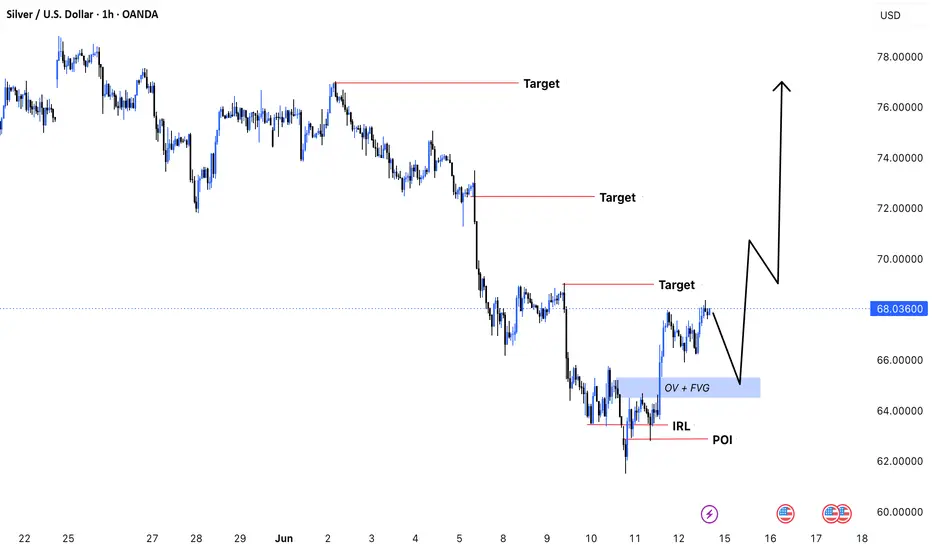
Liquidity Collected, Silver Ready to Expand HigherSilver has successfully swept liquidity and reacted strongly from a key confluence zone, including the POI, IRL, and overlapping FVG. The recent price action suggests that accumulation may be complete, with buyers gradually taking control of the market.
A short-term retracement into support remains possible, but as long as the demand zone holds, the bullish structure remains intact. The current setup points toward higher liquidity targets, with 69.00, 72.50, and 77.00 standing as the next major objectives.
The market rewards patience. Waiting for confirmation and letting the setup mature can often provide the highest-probability opportunities.
⚠️ Not Financial Advice
Gold Analysis: Bulls Target Higher Liquidity ZonesGold continues to hold above the bullish breaker block (BB) after a strong reaction from internal range liquidity (IRL). The market structure remains constructive, with buyers defending key support and gradually pushing price higher.
A sustained move above current levels could open the door toward the next liquidity targets around 4280, 4360, 4480, and potentially 4520. As long as the breaker block remains protected, the bullish outlook stays intact.
Patience is key—let price confirm the breakout before chasing the move.
⚠️ Not Financial Advice
X Lets Users Trade SpaceX Stock In-App on IPO DayThe historic SpaceX IPO isn’t just reshaping Wall Street. It’s changing how people buy stocks online. On the same day SpaceX began trading under the ticker SPCX. Users discovered a new feature inside X that lets them access stock trading without ever leaving the app.
Screenshots shared across the platform show a “Trade SPCX” button linking directly to major brokerages: Robinhood, Fidelity, Charles Schwab, E*TRADE and Interactive Brokers. The SpaceX IPO on Robinhood integration, alongside the other platforms. This gives users a frictionless path to buy SpaceX IPO shares right from their social media feed.
X Unveils In-App Trading for SpaceX Stock
The feature surfaced just as SpaceX IPO shares officially began trading at $135 per share. Users who tapped the trading screen were presented with multiple brokerage options to place SPCX orders. It is a part of X’s broader push toward becoming an all-in-one financial platform.
The rollout gained momentum after X Head of Product Nikita Bier reposted discovery screenshots. He had previously teased that “two more surprises” were coming, stoking user speculation. For many, the feature felt like a natural extension of Elon Musk X news. It’s a visible step toward the super app vision Musk has long championed, combining communication, payments and financial services under one roof.
SpaceX Debuts in Largest IPO Ever
The in-app trading launch coincides with a genuinely historic moment. SpaceX priced its offering at $135 per share, selling 555.6 million shares and raising $75 billion. This valued the company at approximately $1.77 trillion and made it the largest IPO ever completed. Trading kicked off under the ticker SPCX on Nasdaq on June 12. It drew hundreds of billions in investor interest before a single share changed hands.
The enthusiasm traces back to SpaceX’s dominance in reusable rockets. Its rapidly expanding Starlink satellite business and its deep ties to Elon Musk’s broader technology ecosystem.
Robinhood and Other Brokers Gain Visibility
The brokerage integration stands out as a deliberate accessibility play. Rather than building a standalone trading service, X appears to be positioning itself as a discovery-to-execution bridge. This lets users move directly from reading about SpaceX News to placing an order, all without switching apps. For retail investors, that kind of frictionless experience could meaningfully change how they engage with public markets.
Rocket Animations Fuel User Engagement
The rollout also came with a playful touch. Liking posts that mention “SpaceX” or “ NASDAQ:SPCX ” triggers a rocket animation inside the app. It’s a small detail that spread quickly across social media as users shared screenshots and videos. It was clearly timed to amplify engagement around the debut and keep Elon Musk X news front and center throughout the day.
What This Means for Investors
For investors tracking SpaceX Stock Price in its early public market days. The ability to act directly from within X marks a shift in how financial tools are being embedded into everyday platforms. As SpaceX News continues to dominate headlines, X is quietly positioning itself as a gateway for future financial products. The simultaneous launch of trading features alongside the SpaceX IPO suggests that Wall Street and social media may be entering a genuinely new phase together.
Long idea on EU , consoildation completionThe Euro is flashing a compelling structural shift against the Dollar as I wait and monitor the lower boundaries of its multi-month consolidation. Looking at the 4-hour framework, the price action is signaling a potential structural shift for a breakout.
Technical View: The pair has been locked in a well-defined horizontal consolidation channel. Following a corrective 5-wave Elliott Wave sequence (A-E) down to the major support floor near the 1.1400 handle, I have witnessed a aggressive rejection. The market structure broke above the recent local lower-high (LH) level which indicates a building bullish bias.
The Goal: I am looking to establish long exposure on a structural retest near the 1.16250 pivot level after breakout and a retest. To accommodate broader macroeconomic volatility from the upcoming FOMC meeting I am prepared to risk no more then drawdown limit of up of 500 pips against institutional stop-hunts.
When a multi-wave corrective structure cleanly exhausts itself perfectly at a major historical support range, the path of least resistance tends to lean toward a significant structural relief rally.
#EURUSD #Forex #ElliottWave #RangeTrading #TechnicalAnalysis #TradingView #PriceAction
This is for educational and research purposes only and does not constitute investment advice.
MESM June 12: Mother bar low at 7375 is keyMESM analysis for Friday, June 12
MESM printed a 4H mother bar, and for today that slightly shifts my tone toward a bounce setup, but only as long as the key support level continues to hold.
On the 4H chart, the most important level for me is 7375, which is the low of the previous 4H mother bar. As long as price stays above that level, I think the bounce setup remains valid.
If bulls stay in control, then the first upside target I’m watching is 7491. If price can push through that level, then the next upside target is the 4H gap around 7532.
If price loses 7375, then I think the bounce idea weakens and price could continue lower toward 7330.
On the 1H chart, the structure supports the same idea. 7375 is still the main line in the sand. If price revisits and loses that level, selling pressure could step back in.
On the 15M chart, there is also a lower fair value gap / order block lining up in the green zone below, which could become the next reaction area if price breaks down.
Key levels
7375 = low of the 4H mother bar / key support
7491 = first upside target
7532 = 4H gap / second upside target
7330 = downside target if support fails
Lower green zone = possible reaction area if price breaks lower
Plan for today
Slightly bullish while price holds 7375
Watch 7491 first on the bounce
If bulls stay strong, watch 7532 next
If price loses 7375, watch for downside toward 7330
Not financial advice. No confirmation, no trade. CME_MINI:MESM2026
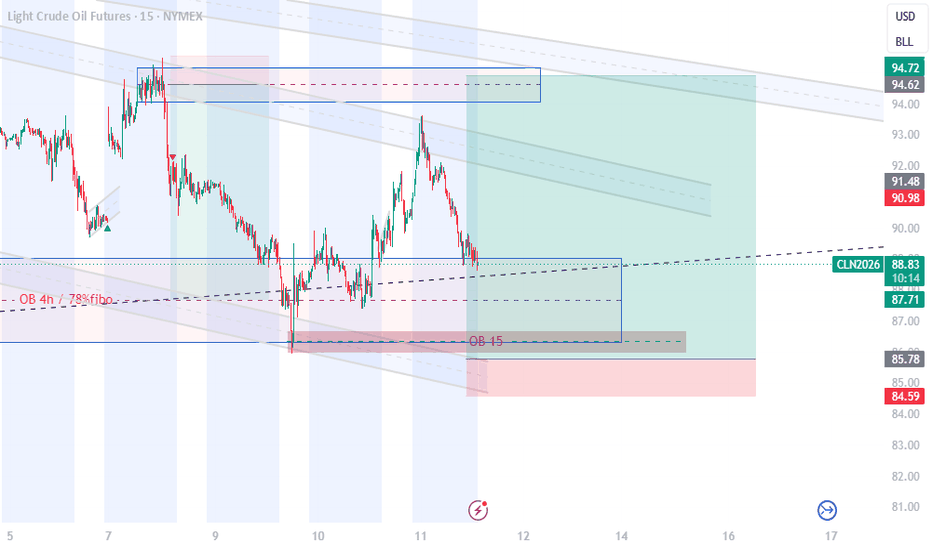
CL Trade Idea: Buying the Bear Trap Below SupportWatching for a long opportunity on Crude Oil by anticipating a "bear trap." There is significant liquidity resting just below the current support cluster around 88.00. Instead of buying immediately at the visible support, I am positioning my order where other traders have their Stop Losses. This allows me to get a premium entry price as market makers push price down to clear out stop losses before reversing. The target remains the major supply zone near 94.70.
⚠️ Disclaimer: This is not an investment recommendation. Markets are volatile and unpredictable. This is my personal analysis only. Always manage your risk carefully and take full responsibility for your own trades.
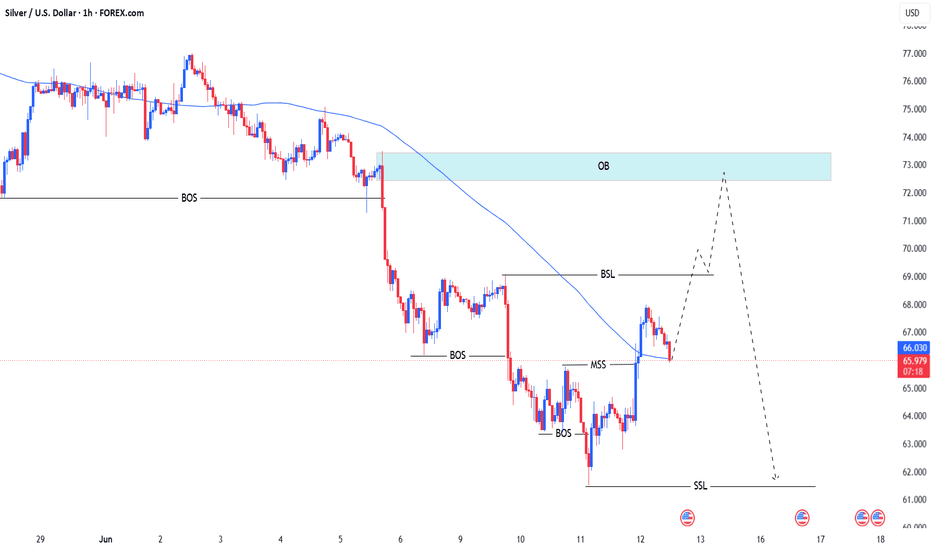
Silver Facing Major Supply Zone – Downtrend Continuation?Market View:
Silver is approaching a strong Bearish Order Block between 72.500 - 73.000. The overall structure remains firmly bearish on the higher timeframe.
Sell Opportunity:
Entry Zone: 72.500 – 73.000 (Bearish OB)
Key Levels to Watch: Buy Side Liquidity: Around 69.000 (next major target after rejection)
Expected sweep of liquidity below after rejecting the OB
Targets:TP1: 72.000
TP2: 71.000
TP3: 69.000 (BSL)
Stop Loss: Above 73.200
This looks like a clean continuation setup in the prevailing downtrend.
This is not financial advice. Trading involves substantial risk of loss. Always manage your risk properly.
#XAGUSD #Silver #Bearish #OrderBlock #Downtrend #Liquidity #SMC #Forex #TradingView
USDJPY Bearish Breakdown LoadingUSDJPY Bearish Breakdown Loading
The Setup:
USDJPY has just completed a Market Structure Shift to the downside and is now kissing a strong Bearish Order Block at 160.500 - 160.550.This is a classic institutional supply zone where sellers have dominated before.
My Bias:
Bearish Continuation Potential Short Entry: 160.500 – 160.550
Targets if it rejects:
First Leg: 160.100
Second Leg: 159.700
Deep Target: 159.300 - 159.000
Invalidation: Break and close above 160.650Sellers look in control here. Waiting for confirmation candle at the OB.
This is not financial advice. Always manage your risk.
#USDJPY #Bearish #OrderBlock #ForexSetup #SMC #TradingView
GBPUSD Ready to Drop from Bearish Order Block?Market Outlook:
GBPUSD is currently testing a strong Bearish Order Block at 1.34700 while the overall structure remains in a clear downtrend.Why This Setup is Strong: Price reacting at a high-probability supply zone
Lower highs and lower lows still intact
No bullish reversal signals on the 1H timeframe
Sell Zone: 1.34700 Area
Expected Targets:
TP1: 1.3420
TP2: 1.3370
TP3: 1.3330
Stop Loss: Above 1.34900This is not financial advice. Trading involves substantial risk of loss. Always manage your risk properly.
#GBPUSD #SellSignal #Bearish #OrderBlock #Downtrend #Forex #SMC #TradingView
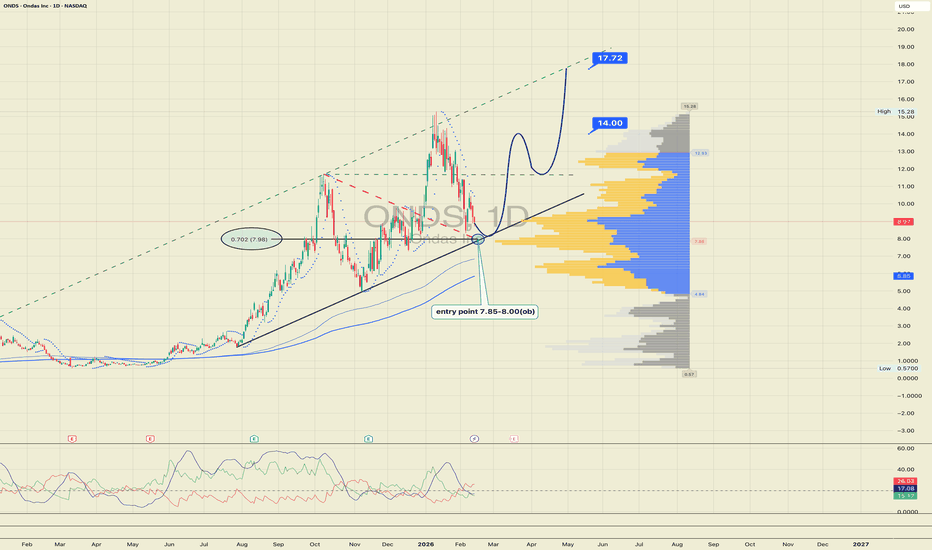
ONDS 1D: Drones at the structural runwayOn the daily chart Ondas continues to develop within a rising channel after a deep but technically healthy pullback. Price is holding the higher timeframe trendline that has supported the move since the initial impulse and is now returning to the 7.85–8.00 area, where prior accumulation was visible.
This zone aligns with multiple technical factors. The 0.702 Fibonacci retracement sits at 7.98. The rising trendline support intersects the same region, along with a previously formed order block. Price is not breaking through impulsively but testing the level with deceleration. ADX remains subdued, signaling compression rather than directional pressure. Volume between 7.80 and 8.20 reflects accumulation rather than aggressive distribution.
Structurally , higher lows remain intact within the expanding rising channel. The pullback into trendline support reads as a technical retest rather than a structural breakdown. As long as the 7.85–8.00 zone holds, the base scenario allows for a move toward 14.00 as the first liquidity reaction area. Above that, 17.72 represents the upper boundary of the channel and the prior extreme. These are not forecasts, but logical structural reaction zones.
Fundamentally , the company remains in a growth phase. Q3 2025 revenue reached 10.10M USD versus 7.03M USD estimated. Q4 2025 revenue is projected at 27.49M USD. Q3 2025 EPS came in at -0.03 USD, with Q4 estimated at -0.04 USD. Operating and free cash flow remain negative on a TTM basis, reflecting ongoing expansion and investment. Q3 financing cash flow of 394.23M USD indicates active capital raising to scale operations.
As long as price respects trendline support and the 7.85–8.00 zone, the structure suggests base formation within a rising channel rather than a breakdown.
Sometimes the runway matters more than the takeoff.