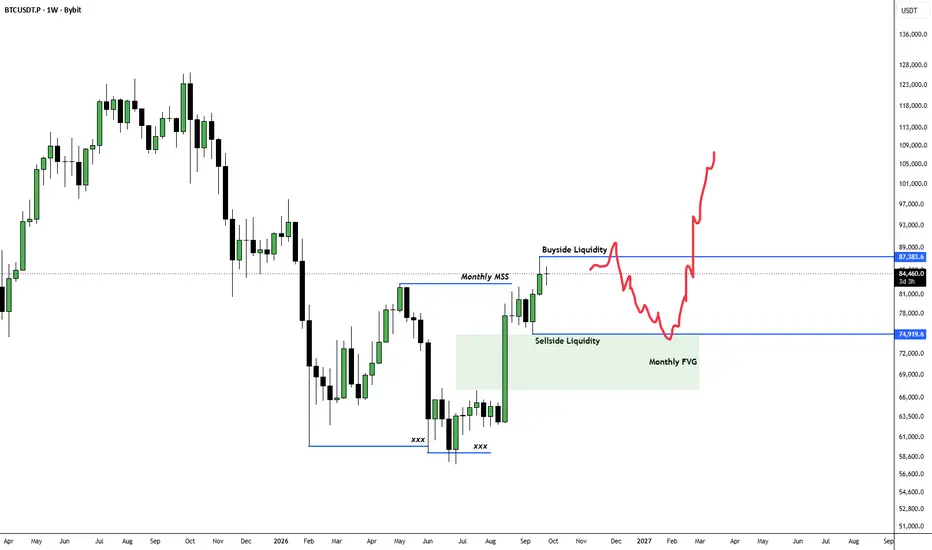
BTC HTF IDEAThis is the zone where Institutions would like to DCA.
So we could see atleast see 2 months of chop here.
- First we take out buyside liquidity and trap longs.
- Then flush the longs out while institutions build their orders through downtrend and take out Sellside liquidity.
- Fill the Monthly FVG and then start the journey to new ATH by 2027.
1) Monthly MSS
2) Multiple weekly close above 50sma on weekly
These two hint that the bear market is over.
Seasonality
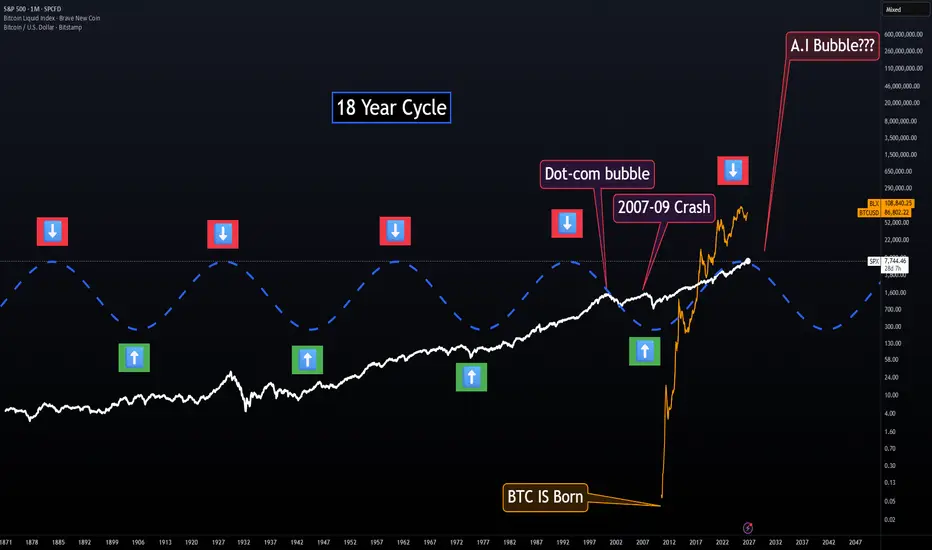
18-Year Cycle — Visual ModelThis is an easy-to-read visual version of my 18-Year Cycle model.
If you’re a visual person like me, this unfinished version makes the cycle much easier to see. The green arrows represent the stronger/good periods of the cycle, while the red arrows represent the higher-risk periods where major market stress and crashes have historically occurred.
Based on the way this model is lining up, it’s pointing toward another major risk window ahead. One possibility I’m watching is whether the current A
U.S. Election Cycle & BitcoinSolid blue lines mark presidential election windows.
Dashed blue lines mark midterm windows.
Bitcoin has repeatedly seen important price shifts around these periods. The goal is not to imply elections cause the moves, but to track whether the midterm timing window continues to align with major BTC cycle transitions.
NKE bottom is in?I'm starting a long-term position in NKE here - I like what I'm seeing in the earnings (EPS beat but lower guidance, hence the price drop), and I think the bottom is in around the $30-35 levels. I'm building my position slowly and holding over the next few years.
Why? Because it's exactly when the media and the Street are piling on a stock - "don't buy this," "it's a falling business" - that you know the bottom is in.
Yes, retail is down right now on lower consumer spending, and yes, retail is
GME's W PatternIts an overlay. The big macro pattern is from before 2019 to 2008 (first peak). This Pattern is also similar to the 2024 and now. All come down to about now. As always I have no idea but this is provocative and keeps you all going!
Best Regards and NFA
HAVE FUN AND ALWAYS:
OPEN TO DISCUSS :)
18-Year Cycle — Late 2020s Risk WindowThis chart looks at the 18-year market cycle and how major financial disruptions have repeatedly appeared around similar phases of the cycle.
The tops and bottoms of the red sine wave both represent financial-stress windows. The idea is not that only the peaks or only the troughs matter. Different crisis events have appeared around both extremes of the cycle, which is why the chart marks crashes, panics, bear markets, and financial disruptions near both the upper and lower turning points.
Hist
Short term trade Idea for BITCOIN - SHORTSWe could see a range form here before the next massive leg up.
We will see a lot of search and destroy PA for the next 2 months while Institutions build their orders here.
Looking for Sweep of Buyside Liquidity and then Sellside Liquidity.
We should see an ugly wick to downside in Oct or Nov to flush out longs.
Bitcoin Halving Cycle Midpoints Suggest a Final Leg DownBitcoin Halving Cycle Midpoints
The yellow lines mark each Bitcoin halving date, while the red lines mark the halfway point between each halving cycle.
What stands out is how Bitcoin has historically behaved after moving beyond those red midpoint markers. In prior cycles, that part of the cycle has tended to coincide with increased downside pressure before the next major halving window.
Based on this structure, I’m still expecting one final leg lower before I’m willing to call the cycle low.
Oil is in a bulish channel while the winter is commingTechnically, oil is bullish on the chart, sitting inside a bullish channel with no sign of a break so far. Fundamentally, we're heading into the cold season in northern countries "a red flag for the bulls like a bull fight" and finally, there's still no progress in Middle East and Russia exports. Short-term target is just the last short-term high as the ceiling, while ATH+ is the midterm target, we'll see...
Fed Leadership Cycle & Bitcoin Turning PointsThis chart highlights a repeating Bitcoin structure around major Federal Reserve leadership dates.
The blue circles are simply copy-and-pasted from one another to show how similar the price behavior looks around each event:
2014 — Janet Yellen
2018 — Jerome Powell
2021 — Powell renomination
2026 — Kevin Warsh
The point is not that a Fed chair change directly causes Bitcoin to fall. The idea I’m exploring is whether these dates are occurring around the same stage of a broader monetary, liquidi
SUI even after a 80% rally this chart isn't bullish enoughSame behaviour three times now. Each leg down has ended with a vertical spike through the range high that held for a handful of daily candles and then failed: 2 in January, 1.4 in May, and 1.2 this month. The 80% move off 0.65 looks impressive in isolation, but structurally it's the third instance of the same failed breakout, not a trend change.
The other problem is time. Real accumulation takes years of flat, boring range with volatility bleeding out of the market. What we have here is a base
My 3-Phase Bitcoin Bear Market Timing ModelThis is my Bitcoin Timing Model, designed to break the bear market cycle into three distinct phases.
The model is based on recurring timing relationships I’ve observed across previous Bitcoin cycles and the broader macro environment.
Phase 1 — Initial breakdown / transition into the bear market
Phase 2 — Continuation and consolidation as the cycle develops
Phase 3 — Final stage of the bear market, where I watch for the last major leg down and eventual cycle low
One of the more interesting c
USDCHF – Potential Move UpOn the higher timeframe (3D) , the larger structure of USDCHF shows a completed ABC correction.
Wave A was completed in July 2023 and developed as a Leading Diagonal. This was followed by a large Triangle pattern forming Wave B , which was completed in January 2025.
From there, USDCHF developed a strong five-wave impulse to the downside, forming Wave C . This is an important confirmation of the larger structure, as Wave C needs to unfold with an impuslive character.
The fifth wave of Wav
Bitcoin, Global M2 & Fed Chair TransitionsOne pattern stands out on this chart: shortly after each Fed leadership announcement or transition shown, Global M2 begins to weaken, liquidity dries up, and markets move toward a more risk-off environment.
New chair, new policy backdrop, then liquidity begins to shift.
This doesn’t mean the chair change causes the liquidity contraction, but the timing is worth watching as part of the broader liquidity cycle. Yellen took office in 2014, Powell in 2018, Powell was renominated in 2021, and Warsh
XAU/USD 23 November 2026 Intraday AnalysisH4 Analysis:
-> Swing: Bullish.
-> Internal: Bearish.
Bias and analysis to remain the same as analysis dated 30 June 2026.
Price did not print bullish CHoCH to indicate bullish pullback phase initiation. Price instead printed a new low followed by a bullish CHoCH
Price is currently trading within and established internal range, however, I will continue to monitor price with respect to depth of pullback.
Intraday expectation:
Price to trade up to either premium of internal 50% EQ, or
Bitcoin Wyckoff Accumulation 2026There are two Wyckoff models that the elites constantly use to deliver price to the right place at the right time!
The Distribution model - the plan from August 2025 unfortunately played out correctly back then. We just can’t determine when, meaning the exact timeframe when it will happen!
Right now, we may be forming an Accumulation model! The only question is: have we already had the Spring, or is it still coming closer to mid-October, before the U.S. elections in November, or not yet?
We’ll c
LINKUSDT Bullish Pennant Signals Major ContinuationLINKUSDT previously printed a major all-time high around the $53 level before entering an extended corrective phase that retraced approximately 90% of the entire bullish expansion. This correction ultimately culminated in a strong structural bottom near $4.70, where demand decisively absorbed selling pressure. Since establishing this low, price has transitioned into a recovery phase, gradually rebuilding bullish structure.
Currently, LINKUSDT is consolidating within a bullish pennant formation,
SMCI: The server king returns. Cisco opens a second doorSuper Micro Computer NASDAQ:SMCI again looks far more interesting from a fundamental standpoint than the chart alone might suggest. After a prolonged downtrend, the stock is attempting to form a reversal structure, and price is now around $40.10. The main support zone sits in the $29 to $33 range. That remains the key area buyers must defend. Above, the first serious resistance zone is around $54.73 to $58.05. A breakout there could open the door to $68.05 and then $80.73. The all-time high i
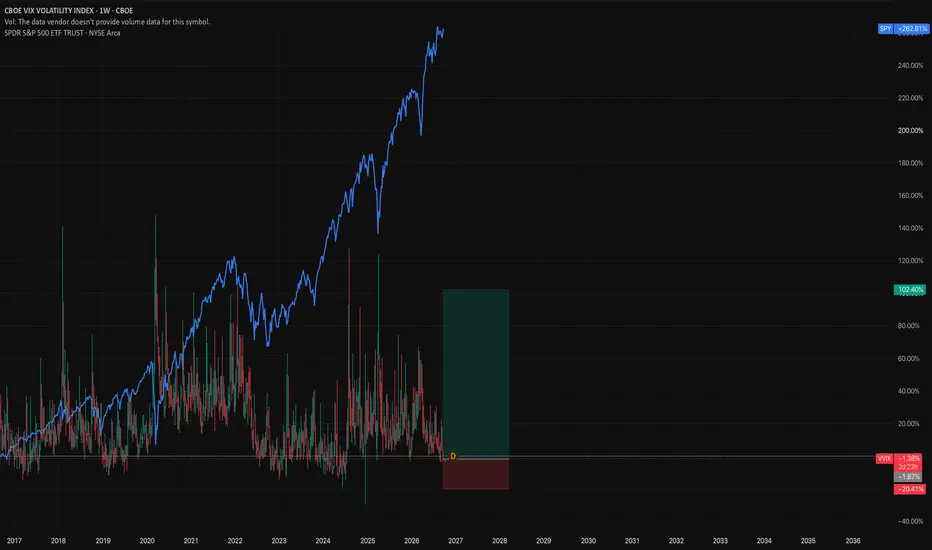
Roadmap for the rest of 2026 - Did you catch the signals?Market Pressure says:
Deterioration approaching Stress
breadth near washout territory
long-term breadth <60%
new lows surging
volatility beginning to rise
Sector performance says:
Leadership is narrowing
Energy strongest
Financials/Technology retain structure
Healthcare and Materials cooling
broad momentum opportunity set shrinking
Sector ratios say:
Concentration is increasing
Energy / Technology / Software still lead
RSP weak
QQQE weak versus QQQ
small caps weak
VIX/VVI
BTC 2026 Bottom SnipingTarget circle of bear market end, derived from a combination of the four year cycle dogma for time, and my personal power law dogma for price (TV won't let me turn on the power law model for a published idea).
If the price action fails to hit the circle in time, I highly doubt BTCUSD will ever fall to those price levels again in the future.
I continue to see a higher low as the most likely marker of the end of the bear market. This higher low is a time-adjusted double bottom in my power law mo
EUR/USD Long – Fundamental and Multi-Timeframe Technical AlignmeEUR/USD is presenting a potential bullish opportunity supported by fundamental, COT, seasonal and technical alignment.
Fundamental Analysis
The USD is fundamentally weaker compared with the EUR, supporting a bullish bias for EUR/USD.
COT Positioning
COT data shows that USD positions are decreasing, while EUR positions are increasing. This suggests improving institutional sentiment towards the euro relative to the US dollar.
Seasonality
Seasonal trends also support the bullish outlook:
Liquidity Grabs Explained: Why Price Hunts Your Stops ?Understanding liquidity 💧
Liquidity in trading isn't just "how easy it is to buy or sell." It's where the orders are sitting.
Every time price makes an old high or old low, retail traders park their stop-losses and breakout orders right around that level. Zoom out and those clusters of resting orders form pools of liquidity — easy fuel for a big move.
Why price "hunts" these levels:
Large players need volume to fill their orders without moving the market too much against them. Pushing price j