Gold 4H Market Structure & Key Resistance SetupGold 4H Market Structure & Key Resistance Setup
This educational Gold 4H chart presents a detailed analysis of price action, market structure, key support and resistance levels, momentum shifts, and the potential reaction from the current resistance area.
The chart begins with a period of mixed price action where Gold trades within a broad range. The candles repeatedly move between higher and lower levels, showing continuous interaction between buyers and sellers. Several bearish candles create lower swing points, while subsequent bullish candles attempt to recover those losses. This creates a clear sequence of short-term reactions that helps define the developing market structure.
As price continues moving through the range, multiple candles form around the lower support region. The repeated lower wicks show that sellers are pushing price down but buyers are consistently defending the area. These reactions create a foundation for the next bullish expansion. Smaller candles around the support zone represent consolidation, while stronger bullish candles indicate increasing buying pressure.
The market then begins to form higher lows. Each successful higher low demonstrates that buyers are becoming more aggressive and are willing to defend higher prices. The candles gradually shift from sideways movement into a stronger upward structure.
A significant bullish expansion occurs around the beginning of August. Several consecutive bullish candles push strongly upward from the lower consolidation area. This move represents a clear increase in momentum and takes price through multiple previous reaction levels. The large bullish candles demonstrate strong buying pressure, while the smaller candles appearing between them represent temporary pauses and short-term profit-taking.
As price moves higher, the market establishes a series of higher highs and higher lows. This creates a strong bullish structure on the 4H timeframe. The upward trend is further supported by the rising trendline and the sequence of higher reaction points.
Around the 4,319–4,373 region, price begins consolidating after the strong upward expansion. The candles become smaller and more compressed, showing that the market is temporarily balancing after a significant move. This area is important because it can act as a reaction zone if price returns to it.
Price then continues higher toward the 4,450.651 resistance area. Several candles approach this level but fail to produce a decisive sustained breakout. Repeated upper wicks and hesitation around the highs indicate that selling pressure is becoming more visible.
The 4,450.651 level therefore represents an important primary resistance. The candles near this region should be monitored for either a confirmed breakout or a rejection. A strong close above resistance followed by continuation would indicate renewed bullish momentum, while repeated rejection could lead to a corrective move.
Above this area, the 4,518.796 level represents a major resistance and higher-timeframe reference. This level is positioned above the current market structure and can become the next major upside objective if buyers successfully break and hold above the 4,450 region.
The latest candles show price moving sideways near the current market area around 4,396. The candles are relatively compressed compared with the earlier bullish expansion. This indicates that momentum has slowed and the market is currently deciding whether to continue upward or begin a deeper retracement.
The projected path on the chart illustrates a potential bearish reaction from the upper resistance region. The first expected reaction could move price back toward the 4,373.961 area, where buyers may attempt to defend the previous structure.
If selling pressure continues and price breaks through the intermediate support levels, the next important reference is the 4,319.380 region. This level can be treated as an important structural confirmation area. A strong bearish break and close below it would indicate that the recent bullish momentum is weakening.
The projected bearish move then points toward the 4,224.128 level, which is marked as the primary downside target. This area is important because it represents a previous structural reaction zone. Price may experience a temporary bounce or consolidation when approaching this level.
The 4,085.356 level represents another important support region. It is positioned near the base of the previous bullish expansion and can become a key reaction point if the market experiences a deeper correction.
Below that, the 4,025.159 demand zone provides another major area where buyers could potentially defend price. The repeated historical reactions around this region make it an important level for monitoring bullish rejection candles.
The lower 3,907.562 level represents a major support reference. A move toward this area would indicate a much deeper correction compared with the current structure. A decisive break below this region would significantly weaken the broader bullish structure visible on the chart.
From a candle-by-candle perspective, the key lesson is to focus on how individual candles combine to create structure. Strong bullish candles demonstrate expansion and buying momentum, while smaller candles indicate consolidation or temporary hesitation. Long upper wicks near resistance can indicate rejection, while lower wicks around support can show buying interest.
The chart also demonstrates why traders should not treat every candle as an independent signal. A single bearish candle inside a bullish structure does not automatically create a trend reversal. Likewise, one bullish candle near resistance does not automatically confirm a breakout. Confirmation should come from consecutive candles, structure breaks, and sustained closes beyond important levels.
The current market is positioned near an important decision area. Buyers need to maintain strength above the key support structure and eventually achieve a convincing breakout above the 4,450.651 resistance to continue the bullish expansion toward the 4,518.796 major resistance.
On the other hand, repeated rejection from resistance followed by bearish structure could create the corrective scenario shown by the projected arrow, with 4,373.961, 4,319.380, and ultimately 4,224.128 acting as important downside references.
Overall, this chart demonstrates a complete price-action sequence: consolidation, accumulation around support, bullish expansion, formation of higher highs, resistance testing, consolidation near the highs, and a potential corrective reaction. The most important concepts visible are market structure, momentum, support and resistance, trend development, reaction zones, breakout confirmation, and bearish rejection.
This analysis is intended for educational purposes. The projected path represents a technical scenario rather than a guaranteed market outcome. Proper confirmation, risk management, and independent analysis should always be used before making any trading decision.  Short
Short
SOLANA Elliott Wave Analysis: Impulse or Deeper Correction?SOLANA Daily Analysis | Nested 1–2 Structure or a Deeper Correction?
From an aggressive perspective, Solana’s current structure may be developing within a nested 1–2, followed by another 1–2 setup. Under this scenario, after completing Wave (II), the market may have formed two early impulsive phases, potentially preparing the larger structure for the next bullish expansion.
At the moment, a simple Zigzag appears to have developed. Therefore, simply seeing an upward move is not enough to confirm a bullish market. What matters is the emergence of a valid impulsive structure.
If the market begins another impulsive move, the peak of Wave B should be broken. After that, we would expect a corrective structure relative to the new advance. That would be the first meaningful green light for the bullish scenario.
However, the impulsive move must actually have an impulsive character. It could develop as:
A Classic Impulse
A Nested 1–2 Structure
Or a Leading Diagonal
So, the main focus is not simply on whether price rises. The real focus is on the structure price creates during that advance.
Conservative Scenario
The conservative scenario still allows for a deeper corrective development.
Within the current area, different corrective structures may still be acceptable in terms of time, depth, and increasing complexity. Therefore, the market may continue developing a more complex correction before making another decline.
That decline could be similar in character to Wave (II)—a Sharp correction that completes the larger corrective structure before the next major move begins.
Educational Point: The Wave (II) Structure
The most important educational point of this analysis is the structure of Wave (II).
In this section of the chart, a five-wave decline developed with several characteristics of an impulsive structure. The three core Elliott Wave rules were respected:
Wave 3 is not the shortest among Waves 1, 3, and 5.
Wave 4 does not enter the price territory of Wave 1.
In addition to the core rules, there is also a clear sense of alternation between Waves 2 and 4.
This is one of the observations and research findings from our work—Rana and I—after studying similar structures across different markets.
Sometimes the market creates a structure that, based on its internal rules and characteristics, closely resembles an Impulse Pattern, while many Elliott Wave analysts are still expecting a three-wave correction or an even more complex corrective pattern.
But the market is not obligated to move according to analysts’ expectations.
A similar structure developed earlier in this market. At the time, it could have created confusion because many analysts were looking for a corrective interpretation. However, the market eventually surprised them and began a strong advance.
For that reason, I will also include the earlier analysis below so you can compare that structure with the current market behavior.
Conclusion
For now, both scenarios should remain under observation.
The aggressive scenario requires the development of a valid impulsive move and a break above the peak of Wave B. After that, the formation of a corrective structure relative to the new advance would strengthen the bullish case.
On the other hand, until such a structure becomes clear, the conservative scenario remains valid. The correction may continue becoming more complex before the market makes another decline.
Ultimately, it is the structure price develops that will determine which scenario is correct—not simply the short-term direction of price.
Mehdi Abbasi | Mr. Nobody Elliott Wave Principle
Elliott Wave Structure • Rules • Evidence • Scenario Analysis
Solana
Jan 16, 2024
Bullish market in Solana
BTC Broke 64,400 - Pressing The Range Top.BTC Broke 64,400 - Pressing The Range Top.
BTC has broken through 64,400 and is trading 64,438, pressing up toward the 64,999 to 65,033 ceiling with a fresh bull announcement and top-quartile conviction. Tuesday's read was that a break of 64,400 puts the 65,033 ceiling back in play - and it did. The recovery off the floor has carried all the way to the range top. Now it meets the level that has capped every attempt, with euphoria showing after the strong run. Neutral.
Resistance: 64,759.19 - first level overhead
Key resistance: 64,999-65,033 - the ceiling, the breakout level
Current price: 64,438
Support: 64,400.89 - the level just broken
Key support: 63,796.21 - first support below
Structural floor: 63,625.81 - the shelf
Two paths from here:
It breaks 65,033 and the range resolves up. A push through the ceiling that has capped the range for weeks would finally resolve it higher. The strong recovery and fresh announcement give it momentum.
It rejects the ceiling again. 65,033 has rejected every attempt, and euphoria is showing after a fast run. A rejection here and a loss of 64,400 would drop it back into the range. The ceiling is the test.
BTC recovered all the way to the range top and is pressing the 65,033 ceiling that has capped every attempt. Breaking it resolves the range up; rejecting keeps the chop. The level that has defined the range is the whole test now.
Built with SYNTHESIS v3.3 | SOM / ACE / IMP / SYNTHESIS
Study, not financial advice. XAUUSD H1: Waiting for a Recovery Toward ResistanceThe XAUUSD H1 chart shows that the short-term structure has weakened significantly after price broke below the rising channel. The sharp decline from around 4,390 pushed price down toward the 4,330 area, indicating that sellers are temporarily in control.
After the breakdown, XAUUSD is showing a mild recovery around 4,356. Above, the 4,378–4,383 zone is the nearest resistance area and also the level that was recently broken. This will be an important area to assess whether the current recovery is simply a retest or whether price can recover more strongly.
Entry:
Prefer a Sell setup if XAUUSD retraces toward 4,378–4,383 and shows a clear rejection signal. In that case, selling pressure could return and push price toward 4,350, followed by the 4,320–4,330 low zone.
Invalidation:
The bearish scenario will weaken if price clearly breaks above 4,383 and holds above this resistance zone. In that case, the short-term structure should be reassessed before looking for another Sell opportunity. Long 
Long 
XAUUSD – ABC Rebound Before Bearish RotationGold is holding a short-term recovery structure after bouncing from the 4,320 area, but this move still looks more like an A-B-C rebound than a full bullish reversal. From Kelly’s view, price may continue pushing higher first into resistance, then face renewed selling pressure once the corrective structure is completed.
⟡ Market structure
The chart shows a completed selloff into the 4,320–4,330 region, followed by a rebound forming an A-B-C pattern.
Wave A has already pushed price back above 4,350, while wave B created a shallow pullback. If buyers stay in control in the short term, wave C can extend toward the resistance band around 4,370 first, and possibly into the higher sell zone near 4,392–4,398.
That upper zone is important because it aligns with the projected end of the corrective wave and the 1.618 extension area marked on the chart. If price reaches that zone and loses momentum, the market may rotate lower again.
➤ Key levels
◌ Current price area: 4,360
◌ Near resistance: 4,368–4,372
◌ Main sell zone: 4,392–4,398
◌ Short-term support: 4,345–4,350
◌ Lower downside target: 4,330–4,333
⌁ Trading scenario
Kelly’s preferred path is a bullish push first, with price trying to complete wave C into 4,370 and then 4,392–4,398.
If gold reacts bearishly from that zone, sellers may take control again and drive price back toward 4,345, then deeper into 4,330.
◌ Invalidation
If price breaks cleanly above 4,398 and holds, the bearish follow-up scenario becomes weaker and gold may extend higher.
▸ Do you think gold will complete wave C into the sell zone first, or reject earlier from 4,370? Short 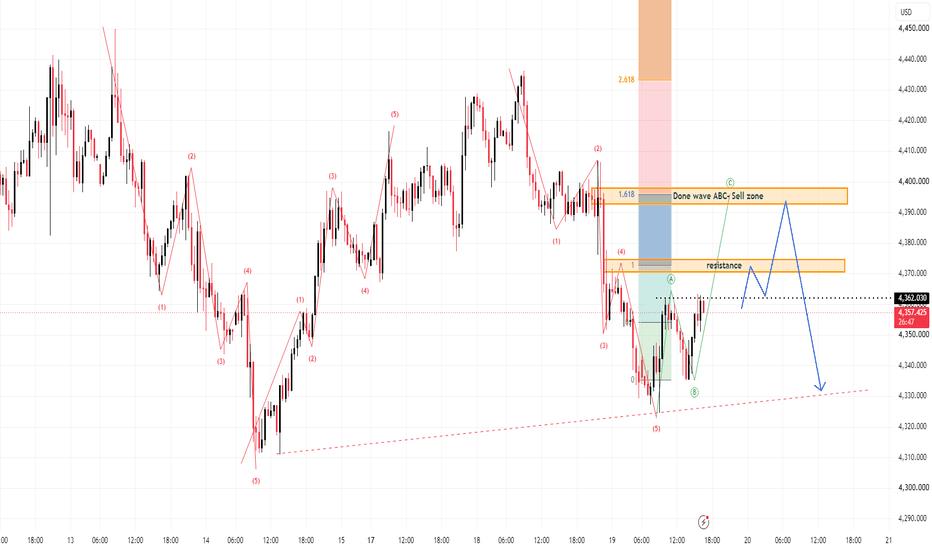
Dalmia Bharat: Bullish Consolidation Near BreakoutDalmia Bharat is showing a bullish recovery structure on the daily chart after finding support near the ₹1,620–₹1,650 zone.
The stock has formed a series of higher lows and is currently consolidating around ₹1,850–₹1,865, with price moving along a rising short-term trendline.
🔍 Technical Setup
Timeframe: Daily
Current Price: ~₹1,864
Structure: Bullish consolidation / ascending support
Immediate Resistance: ₹1,865–₹1,880
Support: ₹1,850
Major Support: ₹1,794
Trend Support: ~₹1,728
🎯 Target Zone
A sustained breakout above the current consolidation/resistance area could open the way toward:
Target 1: ₹2,040
Target 2: ₹2,080
Target 3: ₹2,120
📌 Trade View
Bullish above ₹1,850–₹1,865
A strong close above the recent swing resistance, preferably with volume confirmation, would strengthen the breakout setup.
⚠️ Invalidation: A decisive breakdown below the rising support structure would weaken the bullish thesis.
Disclaimer: This idea is for educational purposes only and is not investment advice. Please do your own research and manage risk appropriately.  Long
Long
Long 
Short 
 Long
Long
Boeing deal changes everything: catching a long on $ACHRNYSE:ACHR
On the daily chart, conditions for opening a long position have formed. The main technical factor is the true breakout above the upper boundary of the long-term descending channel. Price exited it with a powerful impulse, met resistance at the MA200, and then turned into a correction from it. Now the asset is falling toward the gap fill zone. This decline is purely technical and is targeting the 5.47–5.60 range. This area represents a strong price confluence zone: full gap fill, liquidation of the price imbalance, the 50% Fibonacci retracement level, and the MA100.
The technical channel breakout is fully confirmed by the fundamental triggers of August 2026. The acquisition of Archer's Boeing Wisk Aero, Insitu, and SkyGrid divisions transforms the company into a significantly more diversified platform for the aerospace and defense industries, combining eVTOL, autonomous systems, drone technologies, and AI. Insitu adds more than $200 million in annual revenue, while Boeing receives a 19.75% stake in Archer and becomes a strategic partner. This significantly strengthens Archer's financial and technological base during its scaling and final FAA certification phase.
An important market marker is the nature of the volumes: the channel breakout occurred on abnormally high institutional volumes, with average volume rising to 52 million shares, while the current pullback is happening on sharply declining volumes, around 31 million shares. This indicates a reduction in seller pressure after the impulse breakout and allows us to view the current correction as a potential retest of the broken structure.
Position entry is planned with limit orders within the 5.47–5.60 zone. The first target is 8.80, and the medium-term target is 13.00.
The scenario loses relevance if price confidently returns back below the broken descending structure and loses the support zone.
This publication is for analytical purposes only and does not constitute individual investment advice. Share your thoughts in the comments and don't forget to support the idea with a like if you found the analysis useful!  Long
Long
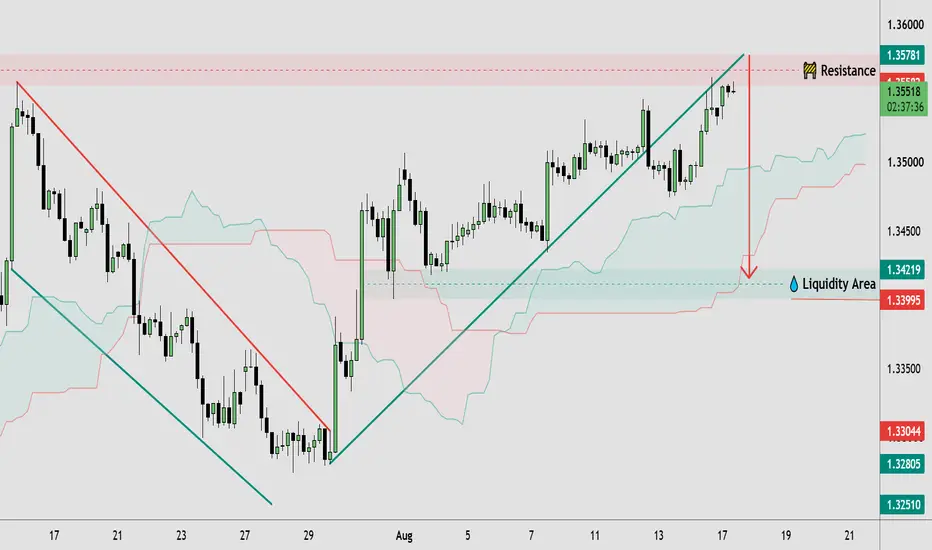
GBPUSD: Resistance Test & Liquidity Pullback Setup🔹 GBPUSD is showing a clear recovery structure, with price forming higher highs and higher lows while respecting the rising trendline. The current move is approaching a marked resistance zone around 1.3570–1.3580, where price appears to be facing potential selling pressure. The structure remains constructive while price holds above the recent higher-low area, but the resistance zone could become important for the next directional move. The highlighted liquidity area around 1.3420 also remains a key reference if price starts to retrace.
🔸 If GBPUSD breaks and holds above the resistance zone, the bullish structure could remain supported and further upside may develop after confirmation. However, rejection from this area could lead to a corrective move toward lower support and the marked liquidity zone. Traders may wait for clear price confirmation around resistance before considering any trade, while a failure of the rising structure could signal a deeper pullback. This GBPUSD price action setup highlights the importance of market structure, resistance, support, breakout confirmation, and liquidity.
This analysis is for educational purposes only and does not constitute financial or investment advice. Always conduct your own research before making trading decisions. XAUUSD: Resistance Test — Pullback or Breakout?🔹 XAUUSD is showing a broadly bullish market structure, with price recovering from the 4,320 area and forming higher highs and higher lows along the rising trendline. Price is currently trading around 4,418 and approaching the highlighted resistance zone near 4,460–4,470. This area could become an important price-action decision point, as previous upward movement has faced selling pressure around similar highs. The marked 4,345–4,360 region remains a notable liquidity area beneath the current structure.
🔸 If XAUUSD continues to hold above the rising structure, a breakout and sustained acceptance above resistance could suggest further bullish momentum. However, rejection from the 4,460–4,470 zone could lead to a pullback toward the nearby liquidity area, where traders may watch for confirmation before considering any trade. A clear break below the rising structure could weaken the current bullish market structure and shift attention toward lower support zones.
This analysis is for educational purposes only and does not constitute financial or investment advice. Always conduct your own research before making trading decisions. Short 
Japan 225 Faces Heavy Selling Pressure – Will Key Support Hold?Market Structure
The short-term structure has turned bearish after a series of lower highs and strong bearish candles. Momentum currently favors sellers unless buyers can quickly reclaim higher levels.
Key Resistance
First Resistance: 66,200–66,500
This area is the first recovery hurdle and may attract fresh selling pressure if price rebounds.
Second Resistance: 67,200–67,600
A move back above this zone would improve the short-term outlook and reduce bearish pressure.
Key Support
First Support: 65,400–65,600
Price is approaching this important support zone, where buyers may attempt to slow the current decline.
Second Support: 64,800–65,000
If the first support fails, this area becomes the next major demand zone and could determine whether a larger correction develops.
Market Sentiment
Market sentiment has shifted to cautiously bearish.
The recent decline reflects weakening buying momentum and increasing profit-taking. While the broader trend remains constructive over the medium term, short-term momentum currently favors sellers until a meaningful recovery develops.
Please share your view below:
Will Japan 225 find support around 65,500 and rebound? Or is this the beginning of a deeper correction?
More market structure and key level updates will be shared regularly.  Long
Long
Ethereum Holds Above Key Support – Can Bulls Reclaim 1,920?Market Structure
The short-term structure has improved with higher lows forming over the past several sessions. Momentum has turned slightly positive, although the market remains within a broader consolidation range.
Key Resistance
First Resistance: 1,910–1,920
This is the immediate resistance where several recent rallies have stalled.
Second Resistance: 1,940–1,960
A successful breakout above 1,920 could open the way toward this previous swing high area.
Key Support
First Support: 1,890–1,900
This zone now acts as the nearest support and is critical for maintaining the current recovery.
Second Support: 1,870–1,880
A break below this area would weaken the bullish outlook and shift momentum back toward sellers.
Market Sentiment
Market sentiment is cautiously bullish.
Buyers have regained some confidence after the recent rebound, but resistance remains close overhead. A breakout would likely attract additional buying interest, while another rejection could keep Ethereum trapped in a consolidation range.
Please share your view below:
Can Ethereum break above 1,920 and continue its recovery? Or will resistance trigger another rejection?
More market structure and key level updates will be shared regularly.