EURUSD Long: Rising Trend Line Supports Further Upside To 1.1710Hello traders! Here’s my technical outlook based on the current EURUSD (2H) chart structure. EURUSD previously traded inside a descending structure before breaking above the Supply Line and shifting bullish. Price then formed a rising structure and moved toward the 1.1710 Supply Zone, where sellers rejected the upside.
Currently, EURUSD is trading below the 1.1710 Supply Zone while holding above the 1.1650 Demand Zone and rising trend line. The recent pullback suggests a possible retest of supp
Trend Lines
Gold support calling for attentionUpside momentum – which has been bolstered by lower real yields and the USD touching gloves with three-month lows – has slowed in recent days. Although I do not consider this to be a solid signal, the Relative Strength Index also registered overbought conditions.
Technically, however, the yellow metal has breached two key trendline resistances (taken from highs of US$5,419 and US$5,598), demonstrates scope for further outperformance to resistance between US$4,857 and US$4,764, and is on the do
XAUUSD BUY OPPORTUNITYGold is heading to a zone where it meets an Untouched FVG and 0.382 Fibo leve for the first time.
You can set your buy limits in that zone or wait the price to play and give you a nice price action first. This is not a financial advise, do your own research.
SL below that green zone.
Good Luck
XAUUSD — Bearish Structure Below 4,600
Gold is starting to lose upside momentum after rejecting from the upper side of the rising channel. From this chart, the latest rebound still looks corrective, which keeps the short-term bias tilted to the downside and supports the idea of one more bearish leg.
⟡ Market structure
Price previously advanced inside an ascending channel, but after peaking near the upper boundary, momentum faded and the market began to print a weaker lower-high sequence. The Elliott Wave structure on the chart su
XAUUSD — Strong Trend, But the Retest MattersGold is still showing a strong bullish structure after the breakout from the lower trendline area.
Price is now holding around 4,625 - 4,640, close to the short-term buy reaction zone.
The momentum is positive.
But when the market has already moved strongly, the cleanest plan is not to chase.
The cleanest plan is to wait for the next reaction.
The simple read
4,629 is the first level buyers need to protect today.
If gold holds this area, the bullish continuation idea remains active.
Pric
XAUUSD — The Bounce May Not Be Safe YetGold is trying to stabilize after losing momentum from the upper channel area.
Price is now moving around 4,625 - 4,635, close to the short-term breakdown support near 4,618.
This is where traders need to be careful.
A bounce from support can look bullish.
But if the bounce only returns into resistance, it can become a trap.
The simple read
4,618 is the first level to watch.
If gold stays above this area, price may recover toward 4,663.
But 4,663 is the Sell Scalping / React Fibo Zone.
XAUUSD — 4,627 Retest or 4,546 Sweep?Gold is still moving inside a bearish short-term channel.
After losing the previous support structure, price is now trying to react around the Small FVG / Buy Scalping area near 4,597.
This is a sensitive zone.
A small bounce can appear from here.
But the bigger question is:
Will that bounce become real recovery, or only a retest before sellers continue?
The simple read
4,597 is the first reaction zone today.
If gold holds above this area, price may create a short-term bounce toward 4,62
XAUUSD — The Bounce Is Not Safe YetGold is now showing weaker short-term momentum after losing the 4,626 support area.
Price is trading around 4,615 - 4,620, and this is no longer the clean buy continuation zone from before.
The market may still bounce.
But the important question is:
Will that bounce be real recovery, or only a retest before another drop?
The simple read
4,626 is now the key retest level.
If gold returns into 4,626 - 4,642 and fails to hold higher, sellers may stay in control.
Above that, 4,658 remains th
SELL TATA POWER**5 Key Rules for Trendline Breakout Trading:**
* **Valid Trendline:** Draw a line connecting at least 2–3 major swing highs or lows.
* **Candle Close:** Enter only after the candlestick closes clearly beyond the trendline.
* **Volume Confirmation:** Ensure high volume on the breakout candle to confirm strength.
* **Stop-Loss Placement:** Set a stop-loss just below the breakout candle or recent swing low.
* **Target Setting:** Aim for the next major resistance level or a minimum 1:2 Risk-to-Rew
XAUUSD – Bearish Wave Toward 4,500
Gold is showing a short-term bearish Elliott Wave structure after failing to extend higher from the recent top. From Kelly’s view, price is now reacting under the wave 3 sell zone, which keeps the downside scenario active. If sellers stay in control, gold could continue lower, first into the liquidity buy zone, then deeper toward the end wave 5 area.
⟡ Market Structure
The current structure suggests gold may be building a fresh downside leg after the rejection near the upper resistance area.
Why can't you always catch the market trends?Gold Price Trend Analysis:
Gold Technical Analysis: Gold prices rallied in the previous trading day before consolidating, closing with a high-level doji candlestick. From a multi-timeframe technical perspective, the overall uptrend for gold remains intact, with short-term volatility leaning towards strength. The daily chart shows a complete upward channel, and the medium- and long-term moving averages maintain a bullish alignment, indicating that the overall upward trend has not changed. Howeve
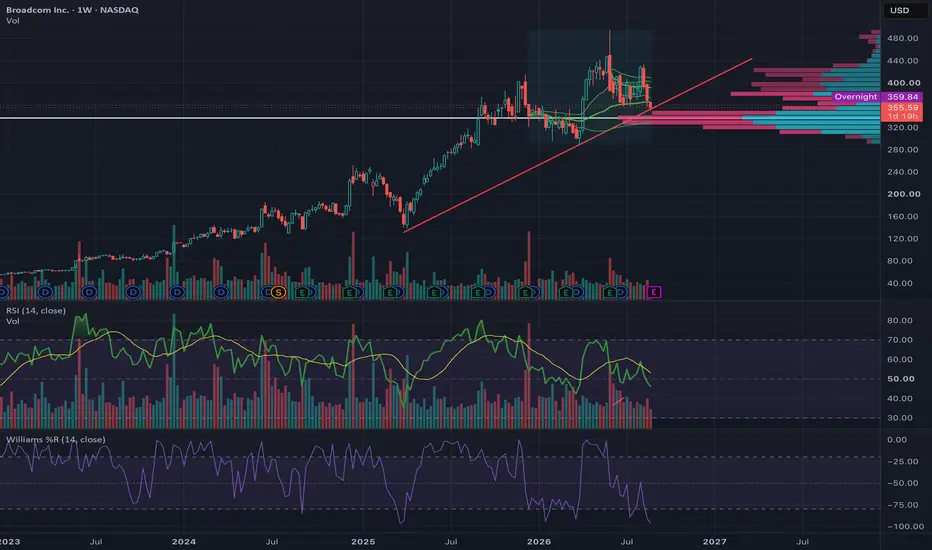
$AVGO Trend Line Support - Q2 ER SetupNASDAQ:AVGO has pulled back to trend line support providing a great opportunity for risk vs reward going into the earnings report being released on September 2nd 2026. Today played out exactly as predicted with the price slightly breaking below the trend line to take out stops and recovering above the trend line to close out the day.
This provides a great setup in terms of risk vs reward going into the Q2 earnings report for NASDAQ:AVGO as recent news of Marvel NASDAQ:MRVL announcing an ex
GU ShortCURRENTLY: I'm looking for price to go short to break previous support/resistance level and continue to -27 and -61.8 on minor FIB, retesting the upward H1 trendline.
------------------------------------------------------------
M: Downtrend, respecting the highs
W: Uptrend, price made HHs but hitting resistance
D: Uptrend, price made a HL, but hitting resistance
4H: Downtrend, price retraced 61.8% and hit -27%
1H: Uptrend, price retraced 50% and passed -61.8% + BEARISH divergence on RSI
AGNC | Continued stock growth- Timeframe: Weekly
- Trade type: Buy stop order
- Price: 10.93
- Take Profit: Open
- Stop Loss: 10.53 (-3.70 %)
Idea: Long on a breakout above last week's high - bullish momentum continuation.
Entry: Buy stop above last week’s high.
Stop-loss: Below the low of the same candle.
If the weekly candle closes below this level, the trade is invalidated.
ELLEN Breakout Retest +Golden Cross | Bullish Continuation SetupELLEN 🚀 Breakout Retest + Golden Cross | Bullish Continuation Setup
After breaking above the ₹303–₹310 resistance zone, the stock has successfully retested the breakout area and is currently trading above it.
🔹 Resistance breakout
🔹 Successful retest of previous resistance as support
🔹 Golden Cross confirmation
🔹 Higher-high / higher-low structure developing
Key support: ₹303–₹310
Immediate resistance: ₹330–₹340
Next zone: ₹340–₹350
As long as the ₹303–₹310 breakout zone holds, the bullish s
NZDUSD Retracement started ??After a big rally price has finally reached a strong resistance level of 0.5988 intact since Feb 2026, many upswings had faced rejections from this level.
price has already started to consolidate in a sideways direction after retesting this zone and had broken below the immediate support of 0.5949, which signals bullishness exhausting and bears taking control.
Over all structure is aligns with the upcoming decline as we had seen in the past multiple times each time price had given breakout abo
NZDUSD: Bearish Breakdown Following Symmetrical Triangle PatternNZDUSD is displaying strong bearish momentum on the 1-hour timeframe after breaking down from a consolidation pattern and key support structure.
Technical Breakdown: Price broke below the ascending trendline of a symmetrical triangle / wedge structure and pushed cleanly past the support zone near 0.59551.
Trade Plan: Following the strong red momentum candle, we are expecting price to continue lower toward key downside structure levels. Traders can look for a minor pull-back/retest toward the b
MDB: Double Breakout — Which Level Holds on the Retest?MongoDB has just delivered an interesting double-breakout on the weekly chart.
First, price broke the multi-year descending trendline that had been suppressing the stock since the 2021 peak.
Then came the bigger confirmation: Break of Structure above ~$440.
And we have a weekly close around $460. 📈
🔥 The setup
🔹 Trendline breakout ✅
🔹 BOS above ~$440 ✅
🔹 Weekly close above the breakout zone ✅
🔹 Momentum expanding strongly
🔹 Next major resistance: ATH ~$588, while an intermediate resistance
AAPL | August 26, 2026 | Time Frames, Confluence & Finding LiquiToday's AAPL review focused on time frames, confluence, and learning where to look for liquidity before taking a trade.
We started with the time frames because context comes first. Instead of looking at one chart and immediately deciding where Apple is headed, I'm using multiple time frames that actually fit my day-trading strategy to understand what price is doing.
From there, we looked for confluence.
In today's video, I covered:
* Using multiple time frames to build context before looking
Cairo Educational Services - high risk - interesting trade@CAED — Timeframe: Daily**
Clear long-term uptrend, but what stands out is that after every correction, prices have risen roughly 100% from 2024 to now. Currently, a daily FLAG pattern is forming, meeting most conditions except two:
- Breakout above the flag's upper boundary must come on high volume
- Duration before breakout
Target = The full upward distance preceding the last correction.
Trade plan:
- Entry: Daily close above 135 with volume expansion (bullish flag breakout)
- Stop loss: 1
Goldman Sachs Could Be Breaking OutGoldman Sachs has pulled back after hitting record highs, and some traders may think it’s breaking out.
The first pattern on today’s chart is the rally on July 14 after earnings beat estimates. That may reflect bullish fundamentals.
Second, the Wall Street bank made a series of lower highs from late July through last week. It closed above that falling trendline yesterday -- plus its 50-day simple moving average. That might be viewed as a breakout.
Third, GS bottomed around $1,000 in early Ju
Zahraa Maadi - ending of sideway - low risk@zmid - timeframe: 1 day
The long-term uptrend remains intact after a daily close above 7.80 with volume exceeding 80 million shares.
Sideways action from July 27 until today formed an ascending triangle, confirmed today by an ultra-high-volume daily close above 7.80.
Trade plan:
- Entry: 7.85–7.95
- Support: 7.80 | Stop-loss: 7.30
- Minimum target: 8.50
Why minimum? The stock is in a clear long-term uptrend. While buyer power announced itself in a market taking profits up to 1.30%, Zahraa M
MongoDB: The Breakout That Could Unlock a 220% Move for $MDBOn Friday, NASDAQ:MDB retested the breakout confirmation level, providing what I see as a great buying opportunity around a strong demand area and potentially an amazing trade with great R/R.
Looking at the 4H chart, we can see a symmetrical triangle that has been developing since January 2026. On August 10, the price broke above the $412 breakout confirmation level and rallied all the way to $472.
At that point, the chart was already extremely overextended, with the stock up more than 60% i