Gold Braces for NFP VolatilityResistance
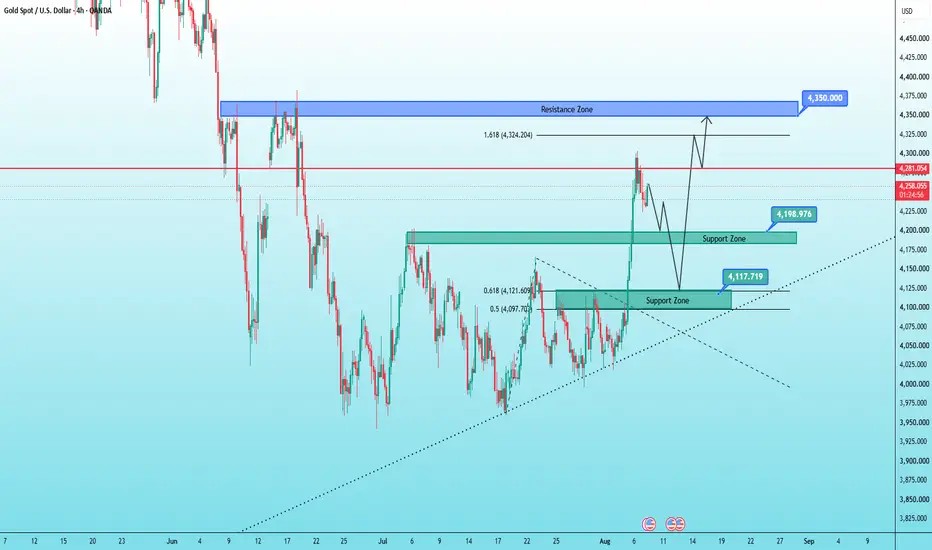
🔴 **Nearest Resistance: 4,281 – 4,300**
* This is the price zone where the recent strong rally was rejected.
* If price revisits this area and forms a bearish reversal candlestick pattern (such as a Pin Bar or Bearish Engulfing), the probability of a pullback will increase.
🔵 **Major Resistance: 4,340 – 4,357**
* This is a key Supply/Resistance zone identified on the chart.
* It is also close to the **1.618 Fibonacci Extension level (4,324)**.
* If price breaks above 4,300, the next upside target will be the 4,340–4,357 resistance zone.
---
Support
🟢 **Support 1: 4,190 – 4,200**
* This is the first support zone following the recent breakout.
* Price may retest this area before continuing its bullish trend.
🟢 **Support 2: 4,100 – 4,120**
* This is a strong demand zone and the previous breakout area.
* If the market experiences a deeper correction, this will be an important zone to watch for potential Buy opportunities.
🟢 **Trend Support**
* The ascending trendline remains intact.
* As long as price stays above this trendline, the H4 trend remains bullish.
---
TRADING PLAN
BUY GOLD: **4200 – 4198**
**Stop Loss:** 4190
**Take Profit:**
* TP1: +200 pips
* TP2: +500 pips
* TP3: +1000 pips
---
SELL GOLD: **4348 – 4350**
**Stop Loss:** 4360
**Take Profit:**
* TP1: +200 pips
* TP2: +500 pips
* TP3: +1000 pips
 Long
Long
 Long
Long
ETHUSDT - Ready for Continued GrowthBINANCE:ETHUSDT is consolidating above 1898 following a distribution phase. From a technical perspective, the daily structure remains constructive, with ETH showing relative strength compared to Bitcoin, which increases the probability of further upside
Bitcoin is gradually recovering and approaching the key 65,150 trigger level. A breakout above this zone could provide additional support for the broader crypto market.
Against this backdrop, Ethereum has broken out of its local bearish corrective structure and entered a new bullish phase. Buyers are actively defending the 1898.5 support zone, keeping the door open for a continuation toward the 1936–1967 resistance area. At the moment, ETH continues to outperform Bitcoin
Resistance levels: 1936, 1967
Support levels: 1898, 1885
A retest of the nearest support zone remains possible. A long squeeze (liquidity sweep) around this area could become the technical catalyst for another bullish impulse toward the stated upside targets
Best regards,
R. Linda  Long
Long
XAUUSD: Waiting for Wave 5 Buy Setup
Gold is showing a strong bullish continuation after breaking above the previous resistance structure. From Kelly’s view, the market has already built a clear recovery wave, and the current price action suggests that XAUUSD may only need one corrective pullback before continuing higher into the next Elliott Wave target.
The key idea is simple: gold is bullish, but the best setup is still to wait for a clean buy zone reaction instead of chasing after a sharp rally.
⟡ Market structure
The chart shows gold recovered strongly from the rising support area and pushed through the previous resistance near 4,110–4,120. This breakout is important because the zone that acted as strong resistance earlier may now become a support base if price retests it.
Gold is currently trading around 4,171 after a sharp upside move. Because price has already moved strongly, a short-term correction is normal. The key area to watch is the 4,110–4,120 zone, marked as the Buy wave 5 area.
If buyers defend this zone, gold may continue higher towards the Fibonacci 1.618 target area around 4,220–4,225, where the chart marks the possible end of wave 5.
➤ Key levels
◌ 4,110–4,120: Buy wave 5 zone and key retest area
◌ 4,160–4,175: current price reaction area
◌ 4,220–4,225: End wave 5 / Fibonacci 1.618 target
◌ 4,060–4,075: lower support if correction becomes deeper
◌ Below 4,060: area where the bullish setup starts to weaken
◌ Above 4,225: bullish extension zone if momentum remains strong
⌁ Elliott Wave view
From an Elliott Wave perspective, gold appears to be forming a bullish 5-wave structure after the previous correction ended near the lower trendline.
Wave 1 created the first recovery leg from the base.
Wave 2 pulled back but respected the bullish structure.
Wave 3 pushed strongly higher and broke through resistance.
Wave 4 may now form as a controlled correction back towards 4,110–4,120.
If this zone holds, wave 5 may continue towards 4,220–4,225.
This is why Kelly would not buy aggressively at the current high. The better plan is to wait for wave 4 to finish, then look for confirmation that wave 5 is starting.
▸ Trading scenario
Preferred scenario: wait for gold to correct into the buy zone and show bullish confirmation.
Entry zone: 4,110–4,120 if bullish confirmation appears
Stop loss: below the confirmed wave 4 low or below 4,060
Take profit 1: 4,175
Take profit 2: 4,200
Take profit 3: 4,220–4,225
Alternative scenario: if gold breaks below 4,060 with strong bearish pressure, the bullish wave 5 setup weakens. In that case, price may return to a deeper support area before forming a new recovery structure.
⌁ Kelly’s view
For Kelly, the bullish structure is still strong, but price is now close to an upper reaction area. That means patience is important.
The cleaner plan is to wait for a pullback into 4,110–4,120. If buyers defend this zone, gold may continue the next bullish wave towards the Fibonacci target above.
Gold is still in a bullish Elliott structure.
If the buy zone holds, wave 5 may continue towards 4,220–4,225.
Share your view below.
Long 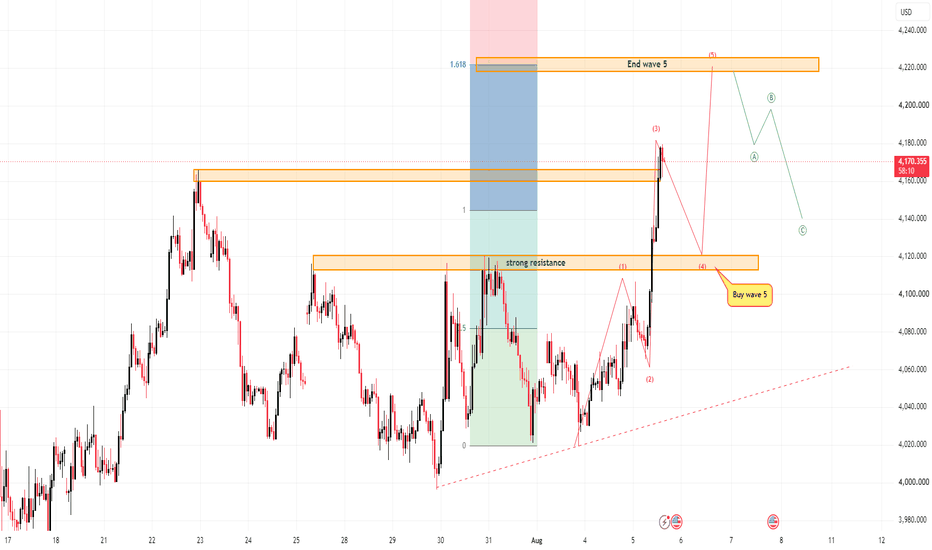
XAUUSD 30M Market Outlook | Order Block & Price ActionGold is currently trading near the 4,057 area after reacting from the lower demand zone and moving into a short-term consolidation phase. The chart highlights important Order Block zones, Market Structure Shifts (MSS), and key liquidity areas that may influence the next price movement.
The current structure suggests that price may continue consolidating between the nearby support and resistance levels before a clearer directional move develops. The projected bullish scenario is based on a possible reaction from the current support area, followed by a move toward the marked imbalance and upper Order Block zone. However, this scenario requires confirmation and is not a guaranteed prediction.
Key Areas to Watch
🔹 Immediate Support: Around 4,048–4,052
🔹 Current Price Area: Around 4,057–4,063
🔹 Potential Resistance / Imbalance: Around 4,075–4,080
🔹 Major Supply Order Block: Around 4,110–4,120
🔹 Lower Demand Order Block: Around 4,000–4,005
Trading Approach
• Wait for a clear MSS, strong candle close, or confirmed price reaction before considering an entry.
• Avoid entering while price remains inside the consolidation range.
• A confirmed break above the nearby resistance may support further bullish continuation.
• A break below the marked support area may invalidate the bullish idea and increase the possibility of a deeper retracement.
• Use a predefined stop-loss and manage risk according to your trading plan.
• High-impact economic news may create increased volatility, spread expansion, or false breakouts.
Note: This chart represents a technical market outlook for educational purposes only. It is not financial advice, investment advice, or a guarantee of future performance. All trading involves risk, and traders should conduct their own analysis before making any decision. Long 
GOLD - A short squeeze could lead to a correction ICMARKETS:XAUUSD is advancing during the Asian session as part of a distribution phase, testing the 4166–4195 resistance zone. The move is being driven by Western comments regarding negotiations in the Middle East. However, Iran has yet to respond, leaving geopolitical uncertainty elevated.
The U.S. dollar remains in consolidation following last week's decline, which was largely triggered by intervention in the Japanese yen. Gold showed little reaction to the weaker dollar and continued trading sideways. Today's rally is primarily geopolitically driven, but the backdrop remains fragile because the market has only heard one side of the story. Any unexpected development could quickly reverse the move.
At the same time, the Federal Reserve's hawkish stance and uncertainty surrounding the negotiations may continue to limit upside potential. The sustainability of the current recovery will depend on developments in the Strait of Hormuz and upcoming U.S. labor market data.
Resistance levels: 4166, 4195
Support levels: 4130, 4116
From a technical perspective, gold has broken above 4166, but buyers have so far been unable to build on the breakout. A false breakout from this resistance zone could trigger a corrective move under the pressure of the broader bearish trend. The 4195 level also remains a key liquidity zone. A short squeeze into either resistance area could provide the catalyst for a decline toward 4130–4110.
Best regards,
R. Linda Short 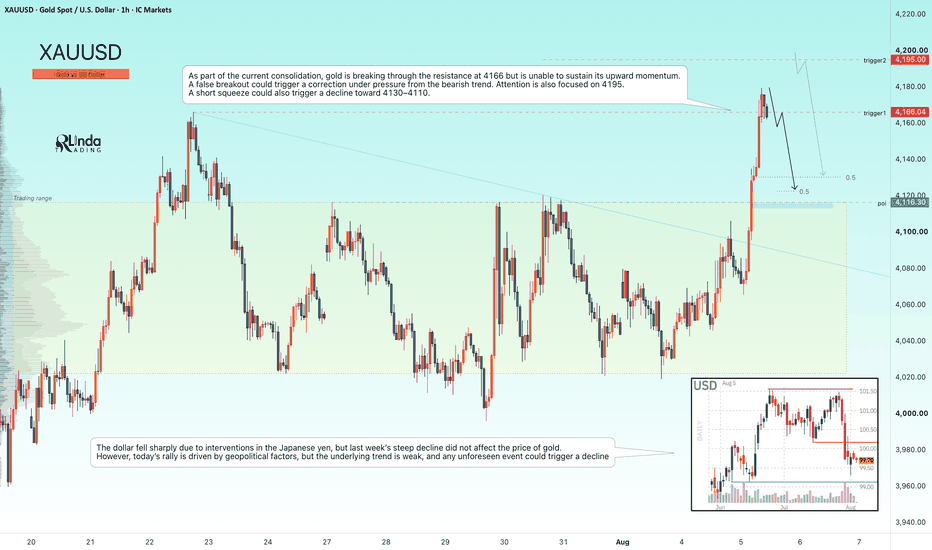
 Long
Long
XAUUSD: Wave 4 Pullback Before Wave 5
Gold is showing a bullish recovery structure after reacting strongly from the lower support area. From Kelly’s view, the current chart suggests that XAUUSD is now moving through wave 4 correction, and if this pullback holds above support, the next bullish wave may continue towards the Fibonacci resistance zone.
The key idea is simple: gold is still building an upward structure, but buyers need to defend the wave 4 zone before wave 5 can develop cleanly.
⟡ Market structure
The chart shows gold recovered from the lower area near 4,020 and created a short-term bullish sequence. Price is now trading around 4,057 after rejecting slightly from the 4,070–4,080 area.
This pullback does not break the bullish structure yet. Instead, it looks like a normal wave 4 correction inside the current Elliott setup.
The important support zone is around 4,045–4,052. If gold holds this area and forms bullish confirmation, price may continue higher towards 4,067, 4,078, and the main wave 5 completion zone near 4,105–4,110.
➤ Key levels
◌ 4,045–4,052: wave 4 buy zone and short-term support
◌ 4,057: current price reaction area
◌ 4,067: first resistance checkpoint
◌ 4,078–4,088: strong Fibonacci resistance area
◌ 4,105–4,110: end wave 5 target zone
◌ Below 4,030: area where the bullish setup starts to weaken
⌁ Elliott Wave view
From an Elliott Wave perspective, gold may be forming a bullish 5-wave recovery after the previous bearish structure slowed down.
Wave 1 created the first recovery push from the low.
Wave 2 corrected but held above the base.
Wave 3 pushed price into the 4,067–4,078 resistance area.
Wave 4 is now likely forming as a controlled pullback near 4,045–4,052.
If this zone holds, wave 5 may continue towards 4,105–4,110.
The downtrend trendline above is still important. A clean break above that trendline would make the bullish continuation stronger, while rejection near the line may create short-term volatility.
▸ Trading scenario
Preferred scenario: wait for gold to hold the wave 4 zone and show bullish confirmation.
Entry zone: 4,045–4,052 if bullish confirmation appears
Stop loss: below the confirmed wave 4 low or below 4,030
Take profit 1: 4,067
Take profit 2: 4,078–4,088
Take profit 3: 4,105–4,110
Alternative scenario: if gold breaks below 4,030 with strong bearish pressure, the bullish wave 5 setup weakens. In that case, price may need to retest the lower base around 4,020 before building a new recovery structure.
⌁ Kelly’s view
For Kelly, gold is still holding a bullish short-term structure, but the market is currently in the decision zone. The best plan is not to chase price near resistance, but to wait for the wave 4 pullback to complete.
If buyers defend 4,045–4,052, gold may continue into wave 5 and target the Fibonacci resistance above.
Gold is correcting inside a bullish Elliott setup.
If wave 4 holds, the next move may continue towards 4,105–4,110.
Share your view below.
Long 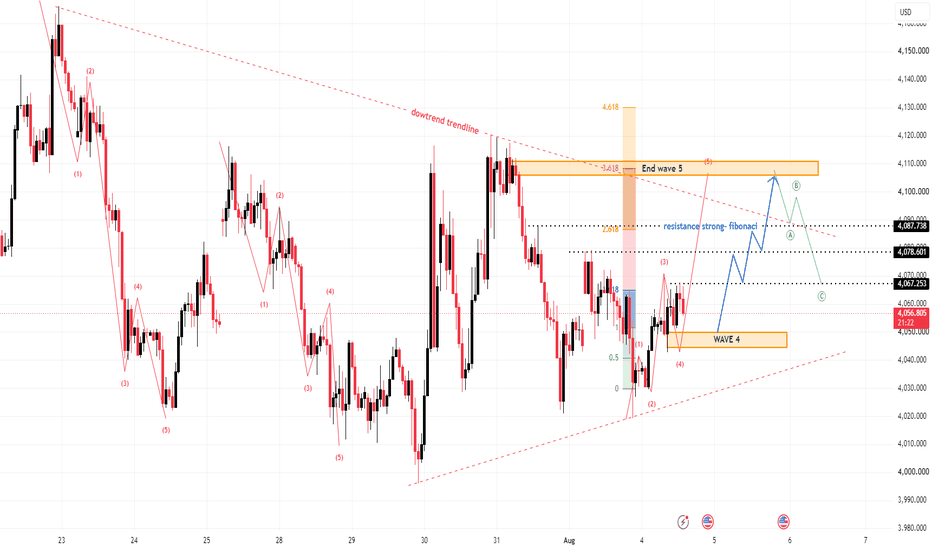
NZDUSD - Ready for growth within the trend Following a strong rally, FX:NZDUSD is now retesting the former resistance of its trading range, which has turned into support. This creates an opportunity for the bullish trend to continue.
The U.S. Dollar Index has broken its recent market structure, and continued dollar weakness could provide additional support for the pair
From a technical perspective, NZDUSD is performing a classic support retest within its countertrend recovery, while buyers are actively defending the 0.5863 level. Sustained consolidation above this trigger could become the catalyst for another bullish impulse
Resistance levels: 0.5908, 0.6000
Support levels: 0.5863, 0.5825
As long as price remains above 0.5863, the pair has the potential to extend its recovery, supported by the current weakness in the U.S. Dollar Index
Best regards,
R. Linda EURJPY - Long squeeze on support amid a bullish trend FX:EURJPY has fallen sharply following the Bank of Japan's intervention, triggering a long squeeze below key support. A recovery back into the trading range could provide the foundation for a bullish rebound
The market is currently stabilizing after the sharp decline, with price testing what was previously the daily range support, now acting as resistance.
A move back above the 180.80 level, followed by sustained consolidation, would confirm the recent breakdown as a false breakout and could trigger a bullish impulse
Resistance levels: 182.10, 183.56
Support levels: 180.80, 179.50
If buyers manage to reclaim and hold 180.80, the pair could regain upside momentum, opening the way for a recovery toward the next resistance levels
Best regards,
R. Linda Gold Is Trading Sideways, Awaiting Key Economic News.XAUUSD Technical Analysis (H1)
Price continues to trade within a symmetrical triangle pattern, with the long-term descending trendline still capping the upside momentum. At the moment, price remains above the key support zone but lacks sufficient momentum for a breakout, indicating that the market is still in a consolidation phase before the next directional move.
Key Resistance
🔵 4,095 – 4,100 – Immediate resistance, aligned with the long-term descending trendline and acting as the key decision zone for the next trend.
Key Support
🟢 4,015 – 4,020 – Immediate support, coinciding with the demand zone and the ascending trendline.
⸻
Trading Scenarios
📈 Bullish Scenario: If price holds above the 4,015 – 4,020 support zone and an H1/H4 candle closes above 4,095 – 4,100, the bullish trend could extend toward the 4,135 resistance area.
📉 Bearish Scenario: If price breaks below the 4,015 – 4,020 support zone, selling pressure is likely to increase, opening the way for a deeper pullback toward lower support levels.
⸻
Trading Strategy
* Prioritize waiting for a confirmed breakout or breakdown before entering any trade.
* Avoid trading while price remains trapped within the current narrow consolidation range.
⸻
Trading Plan
🟢 BUY GOLD
* Entry: 4,015 – 4,017
* Stop Loss: 4,005
* Take Profit: 200 / 500 / 1000 pips
🔴 SELL GOLD
* Entry: 4,095 – 4,097
* Stop Loss: 4,107
* Take Profit: 200 / 500 / 1000 pips
Risk Management
* Risk no more than 1–2% of your account equity per trade.
* Wait for confirmation before entering any position.
* Consider moving your Stop Loss to breakeven once the trade reaches a reasonable profit level to protect your capital and reduce risk. How Will Gold Perform at the Start of the New Week?XAUUSD Technical Analysis (H1)
Based on the chart, price is consolidating above a key support zone while forming a Higher Low structure, although it remains under pressure from the long-term descending trendline. The trading range is gradually narrowing, suggesting that the market may be approaching a significant volatility breakout.
Trend
* Short-term: Neutral with a bullish bias.
* Price continues to hold above the 4,040 – 4,046 support zone, indicating that buyers are defending the bullish market structure.
* A confirmed H1/H4 candle close above the 4,090 – 4,096 resistance zone is required to validate a bullish continuation.
Resistance Levels
🔵 4,090 – 4,096 – Major resistance, aligned with the long-term descending trendline.
* A successful breakout above this zone would open the way toward 4,120, followed by the next target at 4,135.
Support Levels
🟢 4,040 – 4,046 – Immediate support and the key zone determining the short-term market direction.
🟢 4,019 – Strong support, aligned with the ascending trendline and the base of the current Higher Low structure.
⸻
Trading Plan
🟢 BUY GOLD
* Entry: 4,021 – 4,019
* Stop Loss: 4,009
* Take Profit: 200 / 500 / 1000 pips
🔴 SELL GOLD
* Entry: 4,095 – 4,097
* Stop Loss: 4,107
* Take Profit: 200 / 500 / 1000 pips
Risk Management
* Risk no more than 1–2% of your account equity per trade.
* Wait for a confirmed breakout or rejection signal before entering any position.
* Consider moving your Stop Loss to breakeven once the trade reaches a reasonable profit level to protect your capital and reduce risk. Short 
XAUUSD: Bullish Wave Structure Is Building
Gold is trying to rebuild bullish momentum after defending the lower reaction area near 4,050. From Kelly’s view, the chart is showing an early Elliott recovery structure, but buyers still need confirmation above the short-term resistance before the next upside wave becomes stronger.
The key idea is simple: gold is recovering, but the clean bullish continuation needs price to hold above support and confirm the next wave 4 base.
⟡ Market structure
The chart shows gold previously rejected from the 4,160 area and moved lower inside a corrective structure. However, price has now reacted from the lower base and started forming a new short-term bullish sequence.
Current price is around 4,065. The nearest support is around 4,048–4,055, where buyers have already shown reaction. If gold continues to hold above this zone, the next important area to watch is the 4,085–4,090 zone marked as “Buy wave 4 after the price confirms.”
A clean break and hold above this zone may open the path towards the 4,110–4,115 resistance first. If bullish momentum expands, gold may continue towards the larger wave 5 target around 4,160–4,165.
➤ Key levels
◌ 4,048–4,055: short-term support and current recovery base
◌ 4,065: current price reaction area
◌ 4,085–4,090: buy wave 4 confirmation zone
◌ 4,110–4,115: nearest resistance and breakout checkpoint
◌ 4,160–4,165: major resistance and possible wave 5 target
◌ Below 4,040: area where the bullish setup starts to weaken
⌁ Elliott Wave view
From an Elliott Wave perspective, gold may be forming a new bullish 5-wave structure after the recent correction.
Wave 1 has started from the lower base.
Wave 2 created a pullback but did not fully break the recovery structure.
Wave 3 may develop if price breaks above 4,085–4,090 with strength.
Wave 4 may later retest that area as support.
Wave 5 could then extend towards 4,160–4,165, where the chart marks the upper target zone.
This is why Kelly is watching confirmation carefully. The bullish view is improving, but the market still needs to prove that the recovery is not only a small corrective bounce.
▸ Trading scenario
Preferred scenario: wait for gold to confirm above the 4,085–4,090 area, then look for bullish continuation.
Entry zone: 4,085–4,090 after confirmation or retest
Aggressive buy zone: 4,048–4,055 only if bullish reaction appears
Stop loss: below the confirmed swing low or below 4,040
Take profit 1: 4,110–4,115
Take profit 2: 4,160–4,165
Take profit 3: higher only if wave 5 breaks with strong momentum
Alternative scenario: if gold breaks below 4,040 with strong bearish pressure, the bullish Elliott structure weakens. In that case, price may return to a deeper support area before forming a new recovery base.
⌁ Kelly’s view
For Kelly, gold is showing a bullish recovery structure, but confirmation is still the main condition. The strongest setup is not to chase the current price, but to wait for price to reclaim the wave 4 confirmation zone.
Gold is building a bullish Elliott structure.
If buyers hold support and confirm above 4,085–4,090, the next wave may continue towards 4,110 and 4,160.
Share your view below.
Long 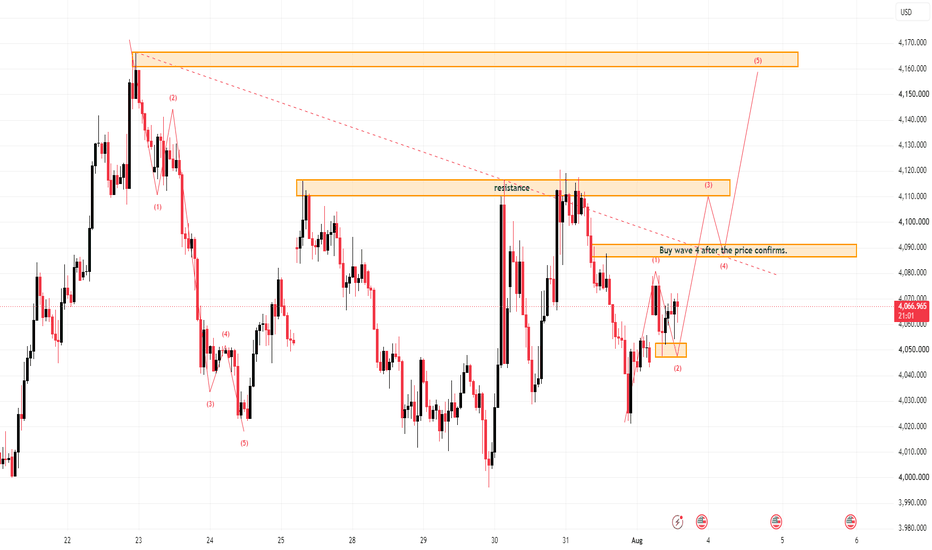
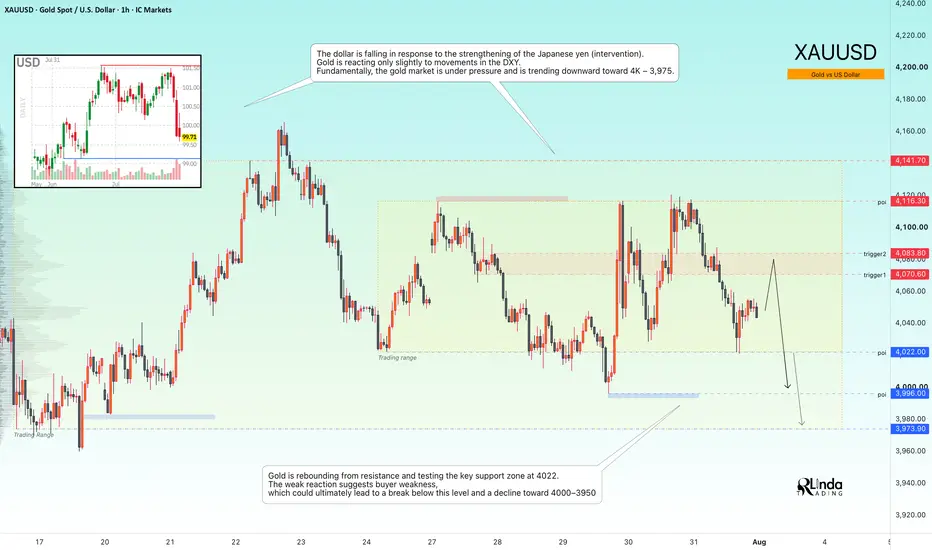
GOLD - Consolidation Amid a Bearish Trend ICMARKETS:XAUUSD remains trapped within the 4022–4116 trading range as markets await the next major economic catalysts. From a technical perspective, however, the broader bearish trend continues to dominate
The U.S. dollar has weakened following renewed strength in the Japanese yen, driven by intervention efforts. Despite this, gold has shown only a muted response to the decline in the DXY. Fundamentally, the metal remains under pressure, with the market still favoring a move toward the 4000–3975 area.
The fundamental backdrop remains challenging for gold. The Federal Reserve is facing an unusually deep policy divide, with three members favoring another rate hike, uncertainty surrounding Governor Waller's outlook, weaker U.S. macroeconomic data (GDP at 1.5%, PCE easing to 3.3%), and renewed geopolitical tensions in the Middle East. Higher oil prices continue to reinforce inflation concerns and support a more hawkish Fed outlook.
Technically, gold has rejected resistance and is now testing the key 4022 support level. The weak buying response suggests limited bullish momentum, increasing the probability of a downside breakout toward 4000–3950
Resistance levels: 4070, 4083, 4116
Support levels: 4022, 3996, 3973
Before the broader decline resumes, the market may first retest the 4070–4083 resistance zone from the session open. The 4116 level also remains a key area to watch. A short squeeze into these resistance levels could provide the catalyst for another bearish reversal toward 4000.
Best regards,
R. Linda Long 
 Long
Long
Education 
Gold H2: NFP Sweep Before the Next Rally?
Gold is trading inside a key H2 decision zone as traders wait for today's US Non-Farm Payrolls.
After rejecting the 4,110–4,120 supply, price has formed a bearish correction and is now approaching the psychological 4,000 demand area.
From an ICT perspective, this looks like a classic liquidity setup rather than a confirmed trend reversal.
📊 H2 Structure
• Bearish correction after HTF supply rejection.
• Imbalance remains around 4,055–4,060.
• Major demand rests at 3,995–4,005.
• HTF demand below at 3,960–3,970.
The market may not be ready to rally immediately.
A sweep below 4,000 could provide the liquidity Smart Money needs before reversing higher.
Bullish Path
✅ Sweep 4,000 liquidity
✅ Bullish MSS
✅ Reclaim FVG
🎯 Targets:
4,060 → 4,120 → 4,166
Bearish Path
A strong NFP report could strengthen the USD and push Gold below 4,000, opening the door toward 3,970 before buyers return.
With one of the biggest macro events of the month only hours away, patience may offer better opportunities than chasing price.
💬 Is Gold preparing for a final liquidity grab below $4,000, or will NFP ignite the next bullish expansion immediately? Long 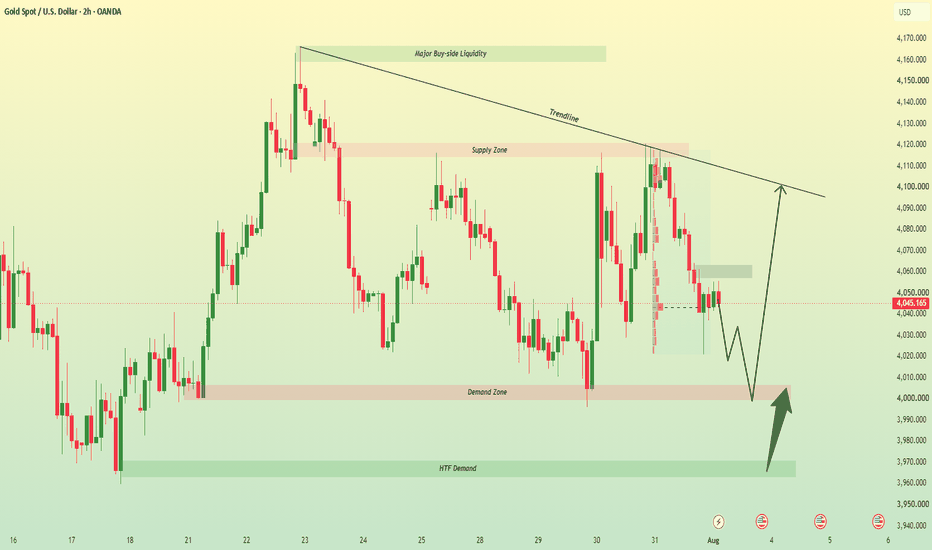
XAUUSD: Weekly Elliott Wave May Need One More LowGold is still trading under the larger downtrend structure, and the weekly chart has not confirmed a full bullish reversal yet. From Kelly’s view, the current market is moving sideways above key support, but as long as price remains below the descending trendline and the 4,201 resistance area, the bearish Elliott structure still needs attention.
The key idea is simple: gold may continue lower first to complete the final Elliott wave, then a larger ABC recovery may appear later if buyers defend the lower Fibonacci zone.
⟡ Market structure
The chart shows gold has been moving under a clear downtrend trendline after the previous major bullish cycle ended. Price is currently trading around 4,045, while the nearest key support zone is around 3,960.
This 3,960 area is important because it is the last visible support before the larger Elliott Wave End zone below. If gold loses this support with strong pressure, price may continue towards the Fibonacci 2.618 target area around 3,730–3,780.
The main resistance above remains 4,201. Gold needs to break above this zone and the downtrend trendline before the weekly bullish recovery becomes more reliable.
➤ Key levels
◌ 4,045: current price reaction area
◌ 3,960: key support zone and weekly decision level
◌ 3,730–3,780: Elliott Wave End / Fibonacci 2.618 target zone
◌ 4,100–4,150: short-term rebound resistance
◌ 4,201: main resistance and bullish confirmation area
◌ Above 4,201: area where the bearish weekly structure weakens
⌁ Elliott Wave view
From an Elliott Wave perspective, gold still appears to be developing the final stage of a larger bearish 5-wave cycle.
Wave 1 started after the major top formed.
Wave 2 created a strong corrective recovery but failed below the downtrend structure.
Wave 3 delivered the main bearish expansion.
Wave 4 has developed as a sideways consolidation near the current area.
Wave 5 may still need one more downside move towards the 3,730–3,780 Fibonacci zone before the structure becomes complete.
If wave 5 ends near the lower Fibonacci target, Kelly will watch for an ABC recovery. That would mean gold first forms wave A upward, then wave B pullback, and finally wave C recovery towards the 4,100–4,201 resistance area.
▸ Trading scenario
Preferred scenario: wait for gold to react below resistance and confirm whether sellers still control the weekly structure.
Sell zone: 4,080–4,150 if bearish rejection appears
Stop loss: above the confirmed rejection high or above 4,201
Take profit 1: 3,960
Take profit 2: 3,850
Take profit 3: 3,730–3,780
Alternative scenario: if gold breaks above 4,201 and holds above the downtrend trendline, the bearish Elliott wave setup weakens. In that case, price may start an earlier ABC recovery before reaching the lower Fibonacci target.
⌁ Kelly’s view
For Kelly, the weekly structure is still cautious. Gold is holding above support, but it has not broken the main downtrend line yet.
The cleaner plan is to watch whether 3,960 holds or breaks. If this support fails, the final Elliott wave may continue towards the Fibonacci 2.618 zone. If buyers defend the lower area, gold may prepare for a larger ABC recovery.
Gold is still below the main trendline.
One more bearish wave may complete the Elliott structure before a stronger recovery appears.
Share your view below.
Short 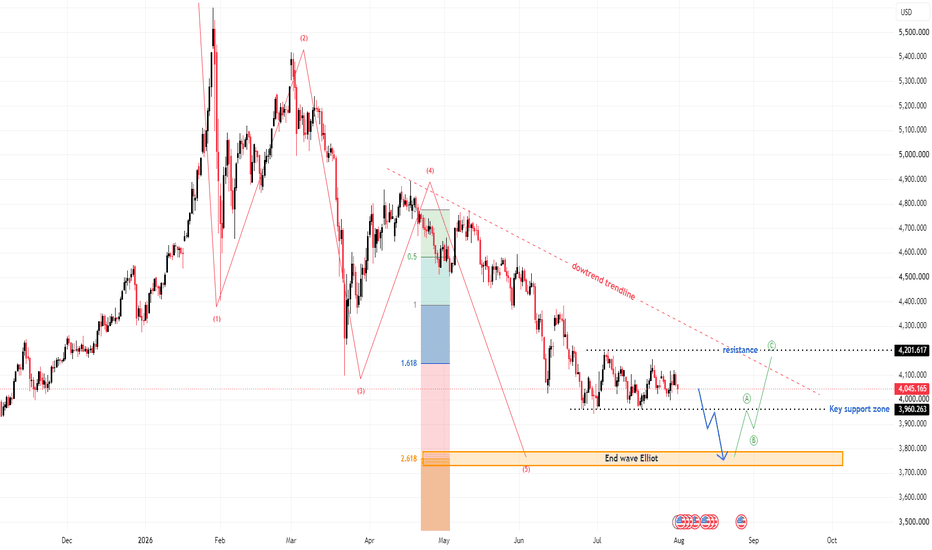
GOLD - The bearish trend continuesICMARKETS:XAUUSD remains in a medium-term bearish trend. The recent attempt to break above 4116 failed, and the market has once again transitioned into a selling phase
Gold is currently caught between geopolitical tensions, which tend to strengthen the U.S. dollar, and expectations surrounding upcoming central bank decisions. The next directional move will largely depend on developments in the Middle East and signals from the Bank of Japan. A continued hawkish stance from the Federal Reserve and a stronger dollar are likely to keep gold under pressure, while a weaker dollar and geopolitical de-escalation could support a recovery.
Bullish drivers: Geopolitical de-escalation, U.S. dollar weakness, A less aggressive Bank of Japan, Weaker-than-expected U.S. economic data
Bearish drivers: Escalation of geopolitical tensions (supporting the U.S. dollar), Renewed strength in oil prices, Strong U.S. macroeconomic data, Hawkish Federal Reserve rhetoric
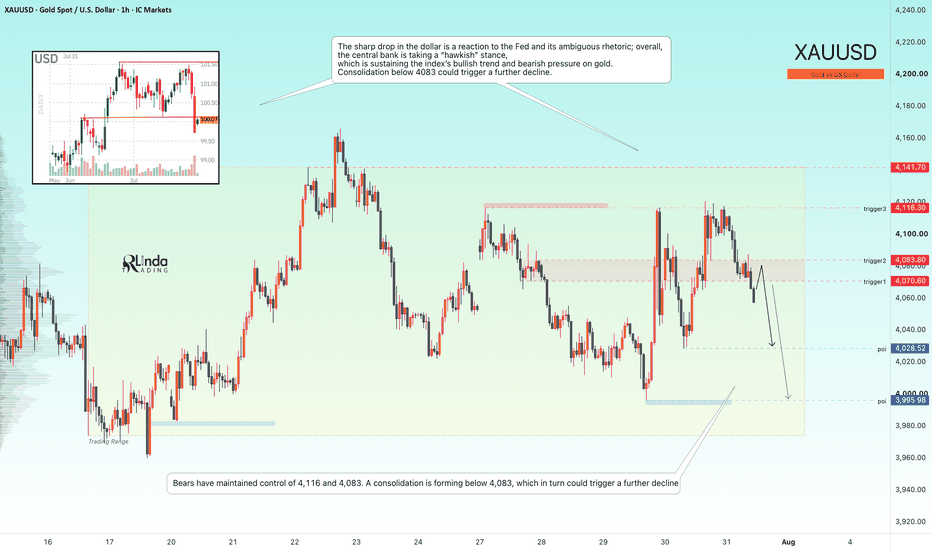
Resistance levels: 4070, 4083, 4116
Support levels: 4028, 3995
The sharp decline in the U.S. dollar was largely a reaction to the Fed meeting and its mixed communication. However, the broader policy stance remains hawkish, supporting the longer-term bullish trend in the dollar and maintaining bearish pressure on gold.
Bears have successfully defended both 4116 and 4083, while price is now consolidating below 4083. Sustained trading beneath this level could provide the technical catalyst for another leg lower
Best regards,
R. Linda Short