COIN GEX - Breakout Above 170, Potential Gamma SqueezeCOIN printed a double bottom on the daily chart, then reclaimed structure and cleared 170 – C1 / Ab1 . Spot is now near 180.50 , holding above the former Call Wall.
With 170 accepted, price has entered the positive gamma extension zone — gamma squeeze potential opens toward the 200 multi-metric cluster if momentum holds.
🔶 Regime Context 🔶
Price is trading well above HVL 155 , keeping COIN inside a positive GEX regime . The double bottom below, then the push back through HVL and into a C1 clear, frames this as a structural reclaim — not a random spike.
🔶 Options Structure Context 🔶
👉 170 – C1 + Ab1 — highest call wall + largest absolute gamma; cleared, now the breakout reference that must hold
Confluence at 170:
C1 — highest call NETGEX
Ab1 — largest absolute gamma
That makes 170 a clear reaction zone — clearing it is what can trigger a potential gamma squeeze .
👉 200 – nCV + COI + AbOI — next overhead magnet
Confluence at 200:
nCV — strongest net call volume
COI — highest call open interest
AbOI — highest absolute open interest
Together, 200 is a call-inventory and call-flow cluster — the natural squeeze target if extension holds.
🔶 Downside Structure 🔶
👉 170 – C1 / Ab1 — first line that must hold for the squeeze thesis
👉 155 – HVL — regime pivot; loss of HVL would weaken the positive-regime read
👉 140 – P1 — strongest put wall / downside floor
🔶 Options Sentiment 🔶
CALL$ 84.5% means call options at an equivalent distance from spot are priced 84.5% higher than the corresponding puts — this is elevated call pricing skew .
On the Options Oscillator, the filled green histogram remains elevated at the right edge — call pricing skew is still strong, not fading.
IVRank 77.2
IVx 86.2
CALL$ 84.5% — call pricing skew
Implied move ±6.27% (±11.3)
Price is also reclaiming the 50 SMA area, while the declining 200 SMA sits near the 200 confluence — technical overhead aligned with the options cluster.
🔶 Key Structure to Watch 🔶
170 — C1 + Ab1 cleared; must hold
200 — nCV + COI + AbOI squeeze magnet
155 — HVL / regime pivot
140 — P1 put wall
For now, COIN is a double-bottom reclaim + C1/Ab1 clear setup, with squeeze potential toward 200 .
The key question is whether price can hold above 170 and extend toward 200 — or whether the Call Wall rejects and sends the move back toward HVL 155 .
Volatility
Nice 4H bullish candle close and Ready to take offI think Near is ready to take Off after close a clean 4h bullish candle and make corrective move to it's recent support Zone. I personally hunt the nice 4.5 R Trade but you can adjust when market move.
As always Disclaimer On, use proper Risk money management. Trading is a risky and you can lose all of your money if not educate well.
Alphabet – Can Earnings Volatility See a Range Breakout?Alphabet reports its earnings after the market close on Wednesday at a pivotal time in an on-going debate amongst retail traders and investors, over whether the AI trade is a bubble that is starting to deflate or is just taking a breather before initiating its next leg higher.
Alphabet, the owner of Google, is known as a hyperscaler, a company that operates a huge global cloud computing infrastructure. Its Google cloud platform is one of the giants powering the world’s AI, data and internet services, alongside Amazon Web Services (AWS) and Microsoft Azure. More importantly, it’s the first of these key companies to report its earnings. With traders extremely sensitive to levels of AI capital expenditure and on red alert for any signs suggesting this huge spending is starting to generate some significant returns, the outcome of this event could be important, not just for the Alphabet shares but also short-term sentiment toward the entire market.
The Alphabet share price topped at an all-time high of 404.38 on May 18th and has since been range trading between a low of 333.20 hit on June 26th and a high of 374.23 briefly seen on Thursday July 16th, before jitters resurfaced surrounding the AI model released by Chinese startup Moonshot, which saw prices drop back down to a low of 345.51 at the Friday close. However, at the start of this week, the Alphabet price has since rebounded to trade back at 353.15 ahead the company’s earnings release tomorrow.
Interestingly, with so much potential for price volatility resting on the outcome of these earnings, the technical outlook provides a key snapshot of the important levels traders may find useful to monitor, depending on how far the Alphabet results and management guidance deviate from market expectations.
Technical Update: Range Activity Builds Ahead of Earnings between 333.20 and 377.83.
The important focus for Alphabet this week is the release of its latest earnings report after the close on Wednesday and the potential for increased volatility that could result.
As the chart above shows, the earnings data could be important for the Alphabet stock price, with potential for more prolonged directional phases of price activity developing, especially as recent moves have seen prices confined within a sideways range between 333.20 (June 26th low) and 377.83 (61.8% retracement).
We discuss the technical outlook below and attempt to identify the key support and resistance levels that may become relevant if a breakout was to occur.
Potential Resistance Levels:
It appears that the Bollinger mid-average currently at 353.15 could represent the first resistance level this week. How this level is defended on a closing basis may be a gauge on short term price activity. If the Alphabet stock price was to close above 353.15 further upside strength may ensue, but while it caps prices, downside pressure may continue to materialise.
As the chart below shows, if the Alphabet share price were to close above 353.15, it could open potential to test 377.83, which may mark the upper extremes of the current sideways range. 377.83 is equal to the 61.8% retracement level calculated from the May high to June low and could be the key resistance to monitor.
If closes in price are seen above the resistance at 377.83 this week, it might suggest scope for moves to higher levels. This could shift the focus towards 389.63, which is equal to the May 27th high, even on towards 404.38, the May 18th upside extreme.
Potential Support Levels:
While the mid-average resistance at 353.15 continues to cap prices on a closing basis, the risk of further downside pressure may increase. This could shift the focus for traders toward a key support at 333.20 (June 26th session low), which could highlight the current lower range extreme.
A closing break below 333.20 may open potential for further declines to 322.85, which is the 61.8% retracement level (March low to May high). A closing break below 322.85 could see moves extend toward 309.44, which is the April 9th session low.
The material provided here has not been prepared accordance with legal requirements designed to promote the independence of investment research and as such is considered to be a marketing communication. Whilst it is not subject to any prohibition on dealing ahead of the dissemination of investment research, we will not seek to take any advantage before providing it to our clients.
Pepperstone doesn’t represent that the material provided here is accurate, current or complete, and therefore shouldn’t be relied upon as such. The information, whether from a third party or not, isn’t to be considered as a recommendation; or an offer to buy or sell; or the solicitation of an offer to buy or sell any security, financial product or instrument; or to participate in any particular trading strategy. It does not take into account readers’ financial situation or investment objectives. We advise any readers of this content to seek their own advice. Without the approval of Pepperstone, reproduction or redistribution of this information isn’t permitted.
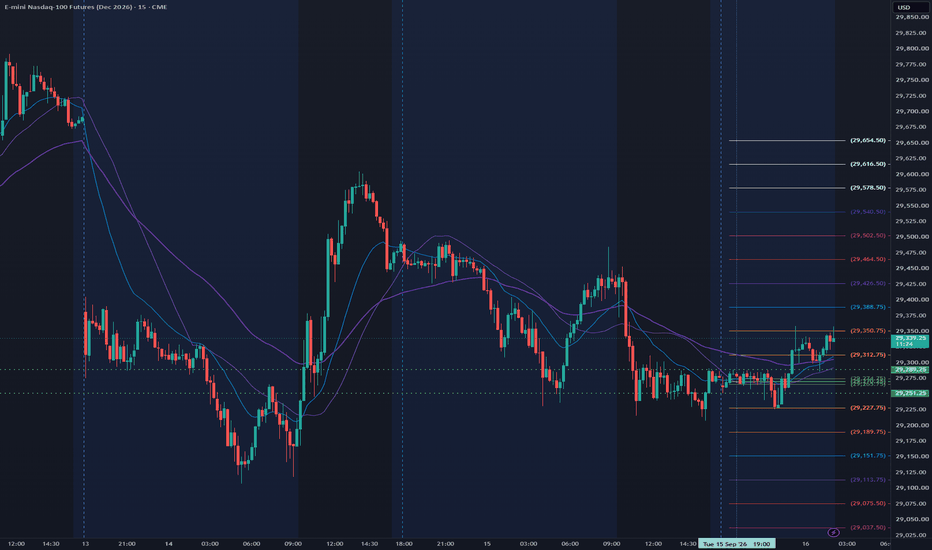
NQ Power Range Report with FIB Ext - 7/22/2026 SessionCME_MINI:NQU2026
- PR High: 29310.75
- PR Low: 29253.00
- NZ Spread: 80.25
No key scheduled economic events
Session Open Stats (As of 12:15 AM)
- Session Open ATR: 652.44
- Volume: 34K
- Open Int: 290K
- Trend Grade: Short
- From BA ATH: -6.0% (Rounded)
Key Levels (Rounded - Think of these as ranges)
- Long: 31904
- Mid: 29517
- Short: 27131
Keep in mind this is not speculation or a prediction. Only a report of the Power Range with Fib extensions for target hunting. Do your DD! You determine your risk tolerance. You are fully capable of making your own decisions.
BA: Back Adjusted
BuZ/BeZ: Bull Zone / Bear Zone
NZ: Neutral Zone
XRP Price Prediction Today: Can Bulls Break $1.20XRP price today is trading above $1.10 after gaining nearly 4%, while Bitcoin has climbed back above $65,000. The recent recovery has improved market sentiment, but XRP still needs to move above $1.20 to confirm a stronger uptrend.
The $1.20 level has acted as a strong resistance in recent weeks.
According to analyst, a sustained move above this level could push XRP toward the next resistance zone between $1.24 and $1.28. A break above $1.29 would strengthen the bullish trend.
On the downside, XRP needs to stay above $1.13 to maintain the current recovery. A drop below $1.10 could erase recent gains.
XRP Price Rises as Funding Rates Fall
One unusual signal during the latest rally is the sharp drop in XRP funding rates.
Funding rates fell 240% in one day, even as XRP moved above $1.13. At the same time, trading volume increased 64% over the past 24 hours.
This suggests the price increase is being supported by spot buying rather than excessive leveraged trading, making the move appear healthier than a leverage-driven rally.
Whale Buying Continues
Large XRP holders added around 70 million XRP during the recent price recovery. Despite this accumulation, XRP has remained below $1.20, showing that buying pressure has not yet been strong enough to trigger a larger breakout.
Network Activity Remains Weak
Active XRP addresses have dropped to around 20,000, the lowest level in nearly a year. Lower network activity suggests fewer users are currently interacting with the XRP Ledger, even as the price attempts to recover. At the same time, new capital entering XRP remains limited, which has slowed upward momentum.
Key XRP Price Levels
$1.10 – Major support
$1.13 – Short-term support
$1.20 – Key resistance
$1.24-$1.28 – Next resistance zone
$1.29 – Level that could open the way for a stronger rally
XRP has started to recover, supported by higher trading volume and continued accumulation by large holders. However, the price remains below its key resistance, network activity is near a one-year low, and fresh buying remains limited. Holding above $1.13 and breaking $1.20 will be the next important signals to watch.
$SOL Sitting on a Low-Volume Pocket. Watching for the SweepWatching CRYPTOCAP:SOL and I'd like to see this scenario play out. There's a local liquidity zone with no volume in it. Price clearly won't linger there, so we've got two options here.
Price flies through that low volume zone off this liquidity and holds above (no trade).
Liquidity grab and a return to the zone near 0.5.
The second scenario is the one that gives me a chance to enter a position. Watching closely, I'll be looking for a break on the lower timeframe in case of a sweep and absorption, and opening the trade if the conditions are there.
NFA!
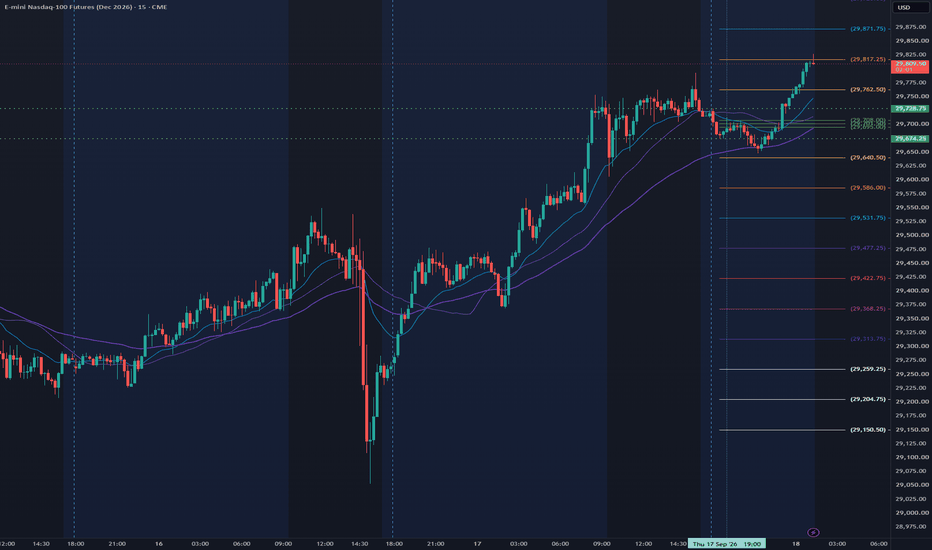
NQ Power Range Report with FIB Ext - 7/21/2026 SessionCME_MINI:NQU2026
- PR High: 28803.50
- PR Low: 28701.00
- NZ Spread: 229.0
No key scheduled economic events
Session Open Stats (As of 12:35 AM)
- Session Open ATR: 671.49
- Volume: 48K
- Open Int: 286K
- Trend Grade: Short
- From BA ATH: -6.5% (Rounded)
Key Levels (Rounded - Think of these as ranges)
- Long: 31904
- Mid: 29517
- Short: 27131
Keep in mind this is not speculation or a prediction. Only a report of the Power Range with Fib extensions for target hunting. Do your DD! You determine your risk tolerance. You are fully capable of making your own decisions.
BA: Back Adjusted
BuZ/BeZ: Bull Zone / Bear Zone
NZ: Neutral Zone
XAUUSD (1H) - Bearish SetupGold has rallied into a key resistance zone after a strong bullish impulse, but I believe the upside is becoming limited. Price is now approaching an area where sellers could step back in.
My bearish thesis:
Price is trading near a significant resistance level.
The recent move looks overextended on the 1H timeframe.
I'm expecting a rejection from this zone, which could lead to a corrective move lower.
Risk is clearly defined above the recent swing high.
Trade Idea:
Bias: Bearish
Entry: Around the current resistance zone
Stop Loss: Above the recent high (~4070)
Target: Around 4006 (as shown on the chart)
Risk-to-Reward: Approximately 1:2
Trade Management:
✅ Once the trade reaches 1:1 Risk-to-Reward, I'll move my Stop Loss to Break-Even (Entry) to protect capital.
🎯 Then I'll let the remaining position run toward the final target.
I'll be watching for bearish confirmation before adding to the position. If buyers manage to break and hold above resistance zone, this setup becomes invalid.
Always manage your risk. This is my personal analysis, not financial advice.
#XAUUSD #Gold #Forex #TradingView #PriceAction #TechnicalAnalysis #Bearish #RiskManagement
Advanced GARCH Volatility Analysis● 🏛️ The Conceptual Origin
- The evolution of quantitative financial modeling has long grappled with the inherent instability of market variance, an observable phenomenon where periods of high turbulence cluster sequentially before dissipating into compression phases.
- Traditional analytical paradigms frequently assume a constant variance over time, a critical flaw that consistently fails to capture the true microstructural realities of modern order flow, algorithmic liquidity provision, and sudden institutional intervention.
- The Generalized Autoregressive Conditional Heteroskedasticity (GARCH) methodology emerged from the strict academic necessity to map these non-linear variances, providing a dynamic framework that respects the shifting gravitational pull of market sentiment.
- By anchoring this autoregressive logic strictly to volume anomalies rather than mere price derivation, the resulting architecture constructs a multi-dimensional perspective of market participation, completely insulating the analyst from the noise of low-volume manipulation tactics.
- This conceptual foundation dictates that every expansion in volatility carries a memory footprint, echoing through subsequent trading sessions and predictably altering the threshold for future price discoveries.
• The Heteroskedastic Reality
- Acknowledging that volatility is strictly conditional and time-dependent allows the algorithmic framework to move far beyond the lagging, static nature of traditional standard deviation metrics.
- The engine meticulously evaluates the residual statistical errors from past structural price action, treating historical volatility shocks as foundational baseline metrics for anticipating future systemic expansions.
- By abstracting the underlying mathematics away from public view, the integrity of the predictive variance models remains intact, ensuring that reverse-engineering attempts fall short of capturing the true alpha-generating mechanisms.
- Integration with absolute confirmed-bar evaluation logic ensures that historical mapping remains permanently fixed upon bar close, eradicating any possibility of historical signal repainting or real-time illusion.
● 📈 Narrative Technical Analysis
- When deploying this framework across live market environments, the narrative of price action transforms from a chaotic sequence of ticks into a highly legible auction process governed by volume-weighted boundaries.
- As price approaches significant liquidity pools, the volumetric volatility calculations act as an early warning system, highlighting the specific threshold where passive resting orders are overwhelmed by aggressive market execution.
- The system utilizes sophisticated structural regression milestones to identify where the current volatility regime deviates significantly from its historical autoregressive mean.
- Consolidation box mapping becomes highly contextualized; instead of merely viewing a range as sideways price movement, the analyst views it as a pressurized environment where the conditional variance is rapidly decaying, signaling an imminent and violent expansion.
- Volume profile anomalies are cross-referenced with the volatility outputs to validate whether a structural breakout is backed by genuine institutional commitment or is merely a low-participation retail trap designed to engineer liquidity.
• Confluence of Variables
- The true power of this analytical approach is fully realized when volumetric variance is analyzed in strict confluence with established Wyckoff mechanics, identifying accumulation and distribution phases through the lens of expanding or contracting variance.
- Market microstructure nuances, such as the speed of the tape and the density of the order book, are abstractly represented through the continuous rendering of the volatility baseline.
- Signal evaluation is strictly filtered by the dominant underlying trend regime, preventing the execution of mean-reversion tactics during periods of infinite directional variance.
- Every technical validation relies exclusively on confirmed data points, stripping away the visual clutter of standalone histogram layers and redundant bands to provide a clean, uncompromising view of the raw asset behavior.
● 🏢 Institutional vs. Retail Perspective
- The dichotomy between institutional operators and retail participants is most glaringly evident in their respective interpretations and applications of volatility data.
- Retail traders consistently view volatility as an unpredictable hazard, frequently tightening stops or exiting structural positions prematurely out of fear when market velocity abruptly increases.
- Conversely, institutional quantitative desks perceive volatility as the primary oxygen of the market, utilizing variance expansions as the optimal environment to offload massive inventory without incurring detrimental slippage.
- The GARCH-based volumetric approach aligns the user with the institutional mindset, quantifying the exact conditions under which smart money actively hunts for stop-loss liquidity to fill institutional-sized blocks.
- While the retail sector obsessively chases lagging moving average crossovers, the professional tier is actively calculating the probability of a variance shift, positioning themselves ahead of the inevitable momentum ignition.
• Asymmetric Execution Mechanics
- Institutional operators demand an asymmetric risk-to-reward ratio on every deployment, a standard that is mathematically impossible to achieve without a rigorous understanding of conditional heteroskedasticity.
- The model effectively highlights structural exhaustion points where the current volatility cycle has mathematically overextended its statistical boundaries, signaling a high-probability reversal zone.
- Retail traders often fall victim to the illusion of safety during low-volatility regimes, unaware that these exact conditions are being utilized by larger entities to build hidden, un-leveraged exposure.
- By stripping away lagging retail indicators, the framework focuses purely on the raw, undeniable footprint of institutional volume, mapping the true narrative of the financial auction process.
● ⚙️ Strategic Variance
- The operational application of this indicator must drastically shift in direct response to the overarching market environment, as variance models do not operate efficiently under a singular, rigid execution doctrine.
- During aggressively trending regimes, the baseline volatility metric will establish an elevated floor, indicating that pullback sequences should be treated as brief pauses in momentum rather than structural failures.
- Within ranging environments, the conditional variance will typically compress to historical lows, warning the analyst that mean-reverting strategies will eventually be decimated by the inevitable volatility breakout.
- High-volatility environments require a complete recalibration of structural targets; the expected range of price bars expands exponentially, demanding that the analyst widen structural invalidation levels to avoid being prematurely stopped out by algorithmic noise.
- The mathematical engine seamlessly transitions between these diverse states, continuously recalculating the autoregressive thresholds without requiring manual intervention from the operator.
• Environmental Adaptation
- The abstraction of complex algorithms ensures that the indicator dynamically adapts to shifting tick volume paradigms across differing asset classes, from high-beta equities to algorithmic forex pairs.
- Fixed, time-based segmentation drift is entirely eliminated by forcing all structural anchor points to lock precisely onto verified changes of character, ensuring that the analytical lens remains perfectly aligned with the market's true rhythm.
- False breakouts are systematically identified and ignored when the corresponding volumetric variance fails to breach the required quantitative threshold, preserving capital for legitimate structural shifts.
- The elimination of arbitrary manual anchor points guarantees that the output remains purely objective, preventing the analyst's cognitive biases from polluting the mathematical reality of the chart.
● 🧠 Psychological Architecture
- The implementation of a quantitative volatility framework is as much a rigorous exercise in psychological discipline as it is in applied mathematical analysis.
- Human cognition is inherently flawed when processing probabilistic outcomes, often heavily weighting recent emotional trauma over long-term statistical reality, leading to persistent hesitation during valid signal generation.
- The objective rendering of conditional variance serves as an essential psychological anchor, forcing the operator to acknowledge the absolute mathematical facts of the market rather than succumbing to fear or euphoria.
- By eliminating superficial chart chatter and focusing strictly on verifiable data, the framework actively dismantles the psychological hurdles associated with analysis paralysis.
- The trader is conditioned to view the market purely as an ongoing distribution of probabilities, recognizing that any single execution is entirely irrelevant within the grander scope of the statistical sample size.
• Cognitive Bias Mitigation
- Recency bias is aggressively counteracted by the indicator's deep historical memory, which continuously contextualizes current price action against years of underlying autoregressive data.
- Confirmation bias is neutralized through the strict requirement of volumetric validation; the operator cannot simply invent a bullish narrative if the underlying variance engine is definitively signaling a lack of institutional sponsorship.
- The absolute removal of predictive repainting logic guarantees that the analyst faces the harsh, unedited truth of their trading decisions, fostering an environment of ultimate accountability and continuous professional growth.
- Developing the mental fortitude to execute precisely when the market feels the most uncomfortable is the ultimate benchmark of a professional quantitative operator.
● 🎲 Risk & Probability Sagas
- The entire foundation of quantitative trading rests upon the mathematical philosophy of risk management, an absolute discipline that supersedes all forms of directional forecasting or fundamental analysis.
- Engaging with financial markets without a deep understanding of standard deviations and variance modeling is akin to navigating a hostile environment without a compass, guaranteeing eventual ruin through uncontrolled exposure.
- The framework explicitly visualizes the expanding and contracting nature of risk, allowing the operator to dynamically adjust their positional sizing in direct inverse proportion to the current volatility reading.
- A high-variance environment mathematically dictates a reduced position size, ensuring that the fixed percentage of capital at risk remains perfectly constant regardless of the width of the structural stop loss.
- Probability is not an abstract concept; it is a rigid, measurable reality that dictates the long-term survival of the trader, demanding absolute respect for the invisible boundaries of market distribution.
• The Mathematics of Survival
- The pursuit of alpha is entirely secondary to the preservation of initial capital; this engine is designed primarily as a defensive mechanism to keep the operator sidelined during low-probability, low-volume chop.
- Asymmetric execution requires that the potential reward is mathematically skewed to drastically outperform the initial risk outlay, a scenario that only presents itself when volatility transitions from compression to aggressive expansion.
- True professional longevity is achieved solely through the ruthless application of risk management parameters, refusing to compromise the statistical edge for the sake of emotional gratification.
- The final layer of risk architecture involves acknowledging the inherent limitations of any quantitative model, understanding that unprecedented tail-risk events can and will occur, demanding an unbreakable adherence to hard structural invalidation levels.
Based on the concepts previously discussed, the GARCH Volume Volatility indicator was developed to reflect the academic and technical principles outlined in this article.
● ⚠️ Professional Risk Warning
- The financial markets are inherently chaotic, and engaging in speculative trading involves a significant probability of capital loss, requiring absolute discretion and rigorous risk management protocols.
- Keep your language real when evaluating potential setups; it is imperative to remember that the future is fundamentally unknowable, and past results in no way guarantee future performance.
- No mathematical model, regardless of its autoregressive complexity or volumetric depth, can accurately predict unforeseen macroeconomic shocks or sudden liquidity vacuums.
- Ensure that capital deployment is strictly limited to funds that can be lost without impacting your primary livelihood, as the true nature of risk is ever-present and entirely unforgiving.
- Never infer past results will repeat in the future, and always base final execution decisions on a holistic confluence of independent technical and fundamental variables.
US 100 - Bubble Fears Are Back Driving SentimentA sell off in previously high-flying chip stocks was a key reason why the US 100 index dropped 3.9% last week from opening levels at 29800 on Monday down to a close of 28566 on Friday. Sentiment has turned down at the start of July as fears of an AI bubble resurface once more, repeating a pattern of risk on then off again that has been witnessed by traders in this very popular area of financial markets since the middle of last year.
Looking forward, the huge capital expenditure being committed to artificial intelligence by several of the world biggest companies and whether it’s generating commensurate revenue returns is once again being questioned just days before Tesla and Alphabet report their latest earnings on Wednesday (after close), and 10 days before Microsoft, Meta and Amazon provide their next updates. These stocks carry a large index weighting meaning their actual results, future revenue growth predictions and capital expenditure forecasts could contribute to outsized directional moves in the US 100 across this crucial two week period into the end of July.
The technical outlook is potentially flagging an interesting dynamic that may also be worth monitoring.
Technical Update: Downside Focus Potentially Shifting to Last Low at 28206
Since posting the all‑time high at 30776 on June 3rd, the US 100 index has traced out a period of choppy sideways activity, as a decision‑making process appears to have formed between buyers and sellers. The lower limits of this sideways pattern could be marked by 28206, the June 9th low, which has held throughout the recent consolidation pattern.
However, as the chart above shows, price weakness is currently emerging after a failure to breach previous session highs on a closing basis. This price action has created a series of lower highs, which could leave traders wondering if this type of price activity is an indication of negative sentiment emerging.
Within this backdrop, being aware of potential key support and resistance levels may prove useful to establish where the next directional risks could lie this week as the key risk events play out.
Potential Support Levels:
In technical analysis, if there is a suspicion of potentially negative weak tests of previous price highs, it is often the last correction low of the previous uptrend that becomes the key support focus for traders, as closing breaks below this level can lead to further price weakness.
In the case of the US 100 index, this dynamic could bring 28206, the June 9th downside extreme into play as this level may represent the last correction low and therefore may be the first key support focus for the coming week.
While not a guarantee of continued price declines, closing breaks below 28206 could open the way for further downside momentum to emerge. Such moves, if seen, could suggest scope toward 27696, which is the 38.2% retracement, possibly then the deeper 50% level at 26753.
Potential Resistance Levels:
Of course, the support at the 28206 low is currently still intact, and while this remains the case, it’s possible the choppy sideways range can extend further. If this is the case, closing breaks back above 29239, which is equal to the 38.2% Fibonacci retracement of the latest decline, may be required to open potential for a push to higher levels.
Closing breaks above 29239 could be viewed as an indication of upside re‑emerging. If this is the case, risks may shift toward further price strength to test the next resistance at 29434, the current level of the Bollinger mid‑average, and if this is also breached, on toward 29791, the higher 61.8% retracement level.
The material provided here has not been prepared accordance with legal requirements designed to promote the independence of investment research and as such is considered to be a marketing communication. Whilst it is not subject to any prohibition on dealing ahead of the dissemination of investment research, we will not seek to take any advantage before providing it to our clients.
Pepperstone doesn’t represent that the material provided here is accurate, current or complete, and therefore shouldn’t be relied upon as such. The information, whether from a third party or not, isn’t to be considered as a recommendation; or an offer to buy or sell; or the solicitation of an offer to buy or sell any security, financial product or instrument; or to participate in any particular trading strategy. It does not take into account readers’ financial situation or investment objectives. We advise any readers of this content to seek their own advice. Without the approval of Pepperstone, reproduction or redistribution of this information isn’t permitted.
NQ Power Range Report with FIB Ext - 7/20/2026 SessionCME_MINI:NQU2026
- PR High: 28851.00
- PR Low: 28709.75
- NZ Spread: 315.5
No key scheduled economic events
Session Open Stats (As of 12:15 AM)
- Session Open ATR: 676.90
- Volume: 53K
- Open Int: 288K
- Trend Grade: Short
- From BA ATH: -7.1% (Rounded)
Key Levels (Rounded - Think of these as ranges)
- Long: 31904
- Mid: 29517
- Short: 27131
Keep in mind this is not speculation or a prediction. Only a report of the Power Range with Fib extensions for target hunting. Do your DD! You determine your risk tolerance. You are fully capable of making your own decisions.
BA: Back Adjusted
BuZ/BeZ: Bull Zone / Bear Zone
NZ: Neutral Zone
July 29th 2026 Market AnalysisThe market continues to show signs of inefficiency. Since my last post, Oil has regained lost ground and is climbing back towards the range. Since traders are digesting geopolitical risk, it is useful to look elsewhere to assess whether this may be a reversion back to the Supply Zone or if there is underlying risk-off positioning.
Equity prices are still high, having retreated slightly from ATHs, yet the Equity Risk Premium is extremely weak due to pressure from Real Yields. It is worth noting that Breakevens FRED:T5YIE are not falling sharply like they were in May and June, while nominal yields TVC:US05Y are showing signs of acceptance. Real yields FRED:DFII5 could weaken if there is divergence between Breakevens and nominal yields, which would provide support to the Equity Risk Premium.
FX is reflecting yield seeking and positioning in favor of strong Oil. I would consider this risk-on with a geopolitical caveat.
Lastly, my market structure dashboard shows that the market has been paying up for Volatility protection over the last few sessions, notably more so in the form of convexity protection ( CBOE:VVIX ). Skew is crowded NASDAQ:SDEX and the market is already expecting low breadth, so there is liquidity if expensive protection is no longer needed.
Macro Dashboard
FX Dashboard
Swing Dashboard
Structure Dashboard
AAPL — 60 Seconds Read1️⃣ What do we see?
AAPL is at a fresh 52-week high with price above every major moving average. All displayed averages are rising and accelerating. Relative strength is bullish and improving with price, while volatility remains normal and easing. No clear distribution is visible.
2️⃣ Thesis
This is an accepted momentum expansion inside a mature structural uptrend. Continuation remains the dominant thesis while AAPL holds the $320–$322 breakout and EMA8 area.
3️⃣ What validates the thesis?
Continued acceptance above $330, RS remaining above its rising average, controlled volatility and positive SMA20/SMA100 momentum. A tight base above the breakout or a successful pullback into $320–$325 would strengthen entry expectancy.
4️⃣ What invalidates the thesis?
A failed breakout below $320, followed by RS deterioration or downside volatility expansion, invalidates the immediate expansion. A decisive failure of $302–$305 damages the structural trend and ends the continuation thesis.
Weekly Review: Acceptance (with emerging short-term stress)--- TradingView Chart Processed by TradeSentinel AI ---
The primary regime remains Acceptance, but this week introduced the first meaningful signs of internal pressure after several weeks of healthy participation.
The evidence is not yet consistent with structural deterioration, but it is no longer a one-sided expansion.
1️⃣ What is it today?
The market remains in an Acceptance regime, but this week introduced the first meaningful signs of internal fatigue. Price pulled back, volatility picked up, and short-term participation narrowed, while the long-term structure remains intact.
2️⃣ Thesis
This looks more like a healthy cooling phase than a structural breakdown. Long-term breadth remains strong and volatility is still below the stress threshold, but momentum has become more selective. Leadership is narrowing, particularly within the Nasdaq.
3️⃣ What validates the thesis?
VIX/VIX3M remains below 1.0, indicating no confirmed stress regime.
Around two-thirds of S&P 500 stocks remain above their 200-day moving averages, supporting the longer-term trend.
NYSE new highs continue to outnumber new lows.
The broader uptrend is still intact despite the weekly decline.
4️⃣ What invalidates the thesis?
VIX/VIX3M rising above 1.0 and remaining there.
Continued contraction in stocks above their 20-day averages.
Nasdaq leadership deteriorating further, with expanding new lows.
Multiple weeks where price advances but breadth continues to weaken.
-----
Trade Implications
Lean Into
Existing leaders that continue holding above key moving averages.
Stocks showing independent relative strength despite the broader pullback.
Strong trends that are consolidating rather than breaking.
Watch Closely
Whether Nasdaq breadth begins repairing over the coming week.
Whether VIX/VIX3M falls back below ~0.85, indicating renewed volatility normalization.
Expansion in new highs after this pullback.
Risk Signals
A sustained move of VIX/VIX3M above 1.0.
Continued deterioration in % of stocks above the 20-day moving average.
Nasdaq new lows continuing to expand while price attempts new highs.
Current Bias
This remains a buy-the-pullback environment, but with greater selectivity than in recent weeks. Position sizing should reflect the increase in short-term uncertainty until breadth begins to improve again.
TELSA TSLA = Bullish
A few days ago, I highlighted this setup as liquidity was poised to be swept. Now, I’m actively positioned in the trade, targeting a strong swing higher.
The primary risk remains potential liquidity grabs below on the 4H timeframe, but every other element of confluence is aligned — structure, momentum, and key levels all support the bullish case.
Monday’s open looks promising. Let’s ride this momentum back into the green. 💚
NQ Power Range Report with FIB Ext - 7/17/2026 SessionCME_MINI:NQU2026
- PR High: 29220.00
- PR Low: 29115.25
- NZ Spread: 234.25
No key scheduled economic events
Session Open Stats (As of 12:45 AM)
- Session Open ATR: 679.64
- Volume: 53K
- Open Int: 292K
- Trend Grade: Short
- From BA ATH: -7.3% (Rounded)
Key Levels (Rounded - Think of these as ranges)
- Long: 31904
- Mid: 29517
- Short: 27131
Keep in mind this is not speculation or a prediction. Only a report of the Power Range with Fib extensions for target hunting. Do your DD! You determine your risk tolerance. You are fully capable of making your own decisions.
BA: Back Adjusted
BuZ/BeZ: Bull Zone / Bear Zone
NZ: Neutral Zone
Bitcoin Rebounds off Long Term Support, can the Rally continue?Bitcoin has risen 1.16% this week, keeping the world’s biggest cryptocurrency on course to register its third weekly gain in a row, something it hasn’t achieved since April. This price action could be an on-going response to its test of long-term technical support at 57,866 (see main chart) in early July, from which dip buyers reappeared taking the price up 12.5% from its low at 57699 (July 1st) to the current level around 64,900 at the time of writing (0645 BST).
From a macro perspective this week, Bitcoin prices may have found support from a recovery in general risk sentiment as cooler than expected US inflation prints on Tuesday and Wednesday, have seen market concerns regarding a Federal Reserve rate hike at their next meeting on July 29th reduce significantly, despite Fed Chair Kevin Warsh commenting in his testimony to Congress on Tuesday that one month of lower US inflation prints is not enough to confirm the Fed’s job to cap rising prices is done.
Looking forward, traders may be focusing on the direction geopolitical risks in the Middle East take moving into early next week. Assessing these developments against the current technical backdrop, which is outlined below, to determine whether the current Bitcoin rally has further to run.
Technical Update: Back to Important Long Term Technical Support:
Bitcoin has fallen more than 54% from the October 2025 all‑time high at 126,304 into the June 2026 low of 57,699, leaving a negative momentum backdrop and pattern of lower highs and lower lows. Traders tend to view this as a downtrend in price, with risks for further extension if sellers remain evident. However, as the weekly chart below highlights, the decline has recently tested what may be an important longer‑term support area.
This potential support sits at 57,866, which is the 61.8% Fibonacci retracement of the rise from September 2023 to October 2025. In technical analysis, the 61.8% level is often viewed as the most important Fibonacci retracement, because if prices close below the identified retracement level, it may lead to an extended period of price weakness, possibly moving all the way down to where the price strength began. In the case of Bitcoin, it’s perhaps not surprising that a bounce has materialised after 57,866 was tested.
Looking forward, traders could now be trying to establish where key support and resistance levels sit to gauge whether the Bitcoin rally could extend, or if the downtrend may resume.
Potential Support Focus:
We have suggested that the 61.8% retracement level at 57,866 could be a key long‑term support, however moving to the daily chart (see below) shows closer support levels that may need to give way on a closing basis if prices are to eventually retest 57,866 again.
While uncertainty amongst traders regarding the Iran conflict on Monday did bring renewed selling pressure for Bitcoin this week, it was the rising Bollinger mid‑average, currently at 62,497, that held and helped to spark the latest phase of price strength. This may mean that closes below 62,497 could open potential tests of the next support at 61,254, which is the July 6th low and rally point. If that level were also broken, risks could shift again toward the 57,866 retracement level. Ultimately, it may prove to be closes below 57,866 that lead to further price declines.
Potential Resistance Focus:
While short term support at 62,497 remains intact, Bitcoin could keep trying to extend its current recovery. However, the latest price strength has been capped by resistance at 65,558, which is the June 22nd high. If Bitcoin is going to build fresh upside momentum, traders could be watching this level, as breaks above it may be viewed as a sign the market may be attempting to move higher again.
Breaks above 65,558, as the daily chart above shows, could see focus shift to 67,425, which is the 38.2% Fibonacci retracement of the decline from May 5th to July 1st. If Bitcoin closes above 67,425, it may then have room to move toward 70,259, the 50% retracement, and possibly even 73,236, the higher 61.8% Fibonacci level.
The material provided here has not been prepared accordance with legal requirements designed to promote the independence of investment research and as such is considered to be a marketing communication. Whilst it is not subject to any prohibition on dealing ahead of the dissemination of investment research, we will not seek to take any advantage before providing it to our clients.
Pepperstone doesn’t represent that the material provided here is accurate, current or complete, and therefore shouldn’t be relied upon as such. The information, whether from a third party or not, isn’t to be considered as a recommendation; or an offer to buy or sell; or the solicitation of an offer to buy or sell any security, financial product or instrument; or to participate in any particular trading strategy. It does not take into account readers’ financial situation or investment objectives. We advise any readers of this content to seek their own advice. Without the approval of Pepperstone, reproduction or redistribution of this information isn’t permitted.
NQ Power Range Report with FIB Ext - 7/16/2026 SessionCME_MINI:NQU2026
- PR High: 29749.00
- PR Low: 29677.00
- NZ Spread: 161.0
Key scheduled economic events:
08:30 | Initial Jobless Claims
- Retail Sales (Core|MoM)
- Philadelphia Fed Manufacturing Index
Session Open Stats (As of 12:45 AM)
- Session Open ATR: 662.38
- Volume: 37K
- Open Int: 288K
- Trend Grade: Short
- From BA ATH: -4.3% (Rounded)
Key Levels (Rounded - Think of these as ranges)
- Long: 31904
- Mid: 29517
- Short: 27131
Keep in mind this is not speculation or a prediction. Only a report of the Power Range with Fib extensions for target hunting. Do your DD! You determine your risk tolerance. You are fully capable of making your own decisions.
BA: Back Adjusted
BuZ/BeZ: Bull Zone / Bear Zone
NZ: Neutral Zone
GOOGL GEX - 370 Call Wall ConfluenceGOOGL is pressing into the 370 zone on the daily chart — the highest call NETGEX wall and a prior resistance area that price has tested multiple times in recent sessions.
The stock remains in a constructive uptrend, trading well above both the 50 SMA and 200 SMA . The immediate focus is not on distant extension levels yet, but on whether momentum can accept above 370 and open the positive GEX extension environment.
🔶 Regime Context 🔶
Price is trading well above 347.5 – HVL , keeping GOOGL inside a positive GEX regime — price action typically becomes more controlled than below HVL. As long as HVL holds on any pullback, the structural bias remains constructive.
🔶 Options Structure Context 🔶
👉 370 – C1 (highest call NETGEX wall)
Confluence at 370:
C1 — highest call NETGEX
Ab1 — largest absolute gamma
CV / nCV — strongest call volume flow today
That makes 370 a clear reaction zone — not just a round number, but a stacked call GEX, absolute gamma, and live call-flow cluster sitting on prior resistance.
If 370 clears with acceptance, price enters the positive GEX extension zone above the highest call wall — gamma squeeze potential opens toward the next call cluster if momentum holds inside the extension.
If 370 rejects again, expect a pullback toward 347.5 – HVL first, with 350.2 – P2 as intermediate put-side structure between HVL and the call wall.
🔶 Downside Structure 🔶
👉 347.5 – HVL — regime pivot / first support below current price
👉 320 – P1 (highest put NETGEX wall)
Confluence at 320:
P1 — highest put NETGEX
nPV / PV — put-side flow reference
Together, 320 remains the structural floor — well below spot, but the anchor if the positive regime breaks.
🔶 Earnings / Positioning 🔶
With earnings scheduled for July 22 , implied volatility is already building into the event. The overlay shows an implied move ±7.16% (±26.63) — a wide expected range that fits the rising IV environment.
The key pre-earnings question is whether GOOGL can break and hold above 370 before the event, or whether the call wall continues to cap upside into earnings week.
🔶 Options Sentiment 🔶
CALL$ 32% (51 DTE) means call options at an equivalent distance from spot are priced 32% higher than the corresponding puts — this is call pricing skew , reflecting upside demand in the option chain.
The Options Oscillator shows IV trending higher into earnings, and the filled green call-skew histogram is building — call pricing skew is increasing, not fading.
IVRank 76.9
IVx 41.7 (51 DTE) | IVx 5dCh +0.2%
CALL$ 32% (51 DTE) — call pricing skew
Implied move ±7.16% (±26.63)
🔶 Key Structure to Watch 🔶
370 — C1 + Ab1 + CV/nCV confluence; prior resistance; breakout trigger into extension zone
347.5 — HVL / regime pivot on pullback
320 — P1 / structural downside floor
For now, GOOGL is testing its most important upside gate at 370 .
The key question is simple: can price break above 370 and hold inside the positive GEX extension zone — or does the call wall reject again while IV keeps rising into July 22 earnings?
Awakening Liquid Gold: The Coffee Futures BoomInvestors face a volatile landscape in 2026. ICE Arabica coffee futures exploded higher this month. Prices rallied nearly 50 percent after finding a bottom in June. Supply chain issues and delayed harvests drive this momentum. Heavy rains disrupted fieldwork in Brazil. This weather crisis degrades crop quality and restricts output. Traders monitor these developments closely. We must analyze the catalysts propelling coffee prices across multiple sectors.
Macroeconomics and Economics
Macroeconomic forces heavily influence coffee futures today. The Brazilian Real recently surged against the US dollar. This currency strength discourages Brazilian farmers from exporting their beans. They hold inventory, waiting for better margins. Global demand increases simultaneously. Intercontinental Exchange (ICE) raised margin requirements twice recently. This action drained liquidity from the market. Commodity funds then closed positions rapidly, worsening price volatility. Supply shortages establish a bullish foundation.
Geopolitics and Geostrategy
Trade policies directly shape the global coffee trade. Governments implement new tariffs and export restrictions. Supply chain bottlenecks complicate physical deliveries worldwide. Brazil remains the dominant producer, controlling 37 percent of global output. Vietnam follows as the primary robusta supplier. Geopolitical tensions impact major shipping routes. This disruption forces shipping companies to reroute vessels. Traders must factor these geopolitical risks into their pricing models.
Science and Industry Trends
El Niño creates severe weather anomalies across South America. Heavy rains delay the Brazilian harvest, which currently sits at only 52 percent completion. Agronomists rush to address these climate challenges. Science plays a vital role here. Researchers study the impact of extreme moisture on bean development. Industry trends show a definitive shift toward climate-resilient farming. Farmers adopt advanced cultivation techniques to salvage their yields.
Technology, High-Tech, and Patent Analysis
Technology revolutionizes coffee production and trading. AI algorithms now predict weather patterns and yield fluctuations accurately. High-tech sensors monitor soil moisture and plant health in real time. Innovators file numerous patents for advanced agricultural tech. Patent analysis reveals a spike in drought-resistant seed technologies. Companies also patent novel extraction methods for specialty coffees. This technological arms race gives progressive farms a competitive edge.
Cybersecurity
Digital platforms process millions of commodity trades daily. Cybercriminals target these financial exchanges relentlessly. Cybersecurity protocols must protect sensitive trading data and supply chain logistics. A single breach could manipulate futures pricing or disrupt global distribution. Firms invest heavily in encrypted networks. They deploy zero-trust architectures to secure their commodity trading operations. Constant vigilance prevents catastrophic market manipulation.
Company Culture, Innovation, and Business Models
Coffee companies must foster a culture of ultimate agility. Rigid organizations fail during intense market volatility. Leaders encourage rapid innovation to offset rising bean costs. Businesses adopt dynamic pricing models to maintain profit margins. Some roasters pivot to direct-trade business models. This strategy bypasses intermediaries and secures supply lines. Hedging against volatile futures requires a forward-thinking corporate mindset.
Management and Leadership
Executives face immense pressure from volatile coffee markets. Leaders must execute precise risk management strategies. They utilize complex financial instruments to hedge against future price spikes. Managers optimize supply chains to reduce unnecessary costs. Strong leadership ensures stability during market chaos. Decision-makers must remain proactive rather than reactive. Effective leaders turn these market disruptions into strategic advantages.
The Pharmaceutical Industry Connection
Pharmaceutical companies watch coffee futures closely. Coffee beans contain valuable bioactive compounds and antioxidants. Manufacturers extract high-grade caffeine for medicinal formulations. Scientists study chlorogenic acid for its metabolic benefits. Rising raw material costs squeeze pharmaceutical profit margins. Drug companies must secure their supply of these crucial organic compounds. This cross-industry reliance highlights the broad economic impact of coffee.
Conclusion
Coffee futures represent far more than a morning beverage. They reflect a complex matrix of global forces. Climate change, currency fluctuations, and technology drive this dynamic market. Investors must understand these diverse catalysts. Astute traders will capitalize on these violent price swings. We expect continued volatility as weather patterns remain unpredictable. The liquid gold rush presents unique opportunities for prepared minds.
Convergence of Bollinger Bands and Keltner ChannelsVolatility is the lifeblood of financial markets, dictating not only the magnitude of price movements but also the very structure of market liquidity and institutional participation. To the untrained eye, price action is a chaotic sequence of erratic ticks; to the quantitative analyst and algorithmic developer, it is a highly structured environment governed by the principles of kinetic and potential energy. Within the realm of technical analysis, few concepts are as mathematically elegant and practically devastating as the convergence of standard deviation and absolute true range. This dynamic relationship is best captured by overlaying Bollinger Bands and Keltner Channels, creating a multidimensional lens through which we can observe the market breathing—inhaling during periods of consolidation and exhaling violently during trend initialization.
● The Conceptual Origin: Standard Deviation Versus True Range
To truly harness the predictive power of these overlapping indicators, one must first deconstruct their foundational mathematics and the economic philosophies that birthed them. The conceptual origin of this volatility matrix lies in two contrasting methodologies for measuring the dispersion of price from its mean.
Bollinger Bands, developed by John Bollinger in the 1980s, are built upon the statistical concept of standard deviation. The indicator calculates a simple moving average—typically a 20-period baseline—and projects upper and lower bands that are two standard deviations away from that mean. In standard statistical theory, assuming a normal distribution, approximately ninety-five percent of all price action should be contained within these bands. However, financial markets exhibit fat-tail distributions, meaning extreme events occur far more frequently than a bell curve would predict. Bollinger Bands are inherently reactive; they expand and contract aggressively, acting as an elastic boundary that visually represents the current implied and historical volatility of the asset.
Conversely, Keltner Channels, introduced by Chester Keltner in the 1960s and later modified by Linda Raschke, rely on a completely different metric: the Average True Range (ATR). Rather than measuring statistical variance from a mean, the ATR measures absolute price movement, taking into account any gaps between trading sessions. Keltner Channels typically utilize a 20-period exponential moving average and project bands based on a multiplier of the ATR, usually set at 1.5. Because they are rooted in absolute price range rather than statistical deviation, Keltner Channels offer a much smoother, less erratic trajectory. They represent a more rigid boundary of typical market movement. The true magic occurs when these two contrasting mathematical models—the elastic standard deviation and the rigid true range—interact on the same price chart.
● Narrative Technical Analysis: The Anatomy of Kinetic Expansion
When analyzing the market through the combined lens of Bollinger Bands and Keltner Channels, we are essentially reading the narrative of market momentum and energy storage. The most critical event in this narrative is known as the "Squeeze."
• The Accumulation of Potential Energy: A Squeeze is identified when the Bollinger Bands contract so severely that they move entirely inside the Keltner Channels. Visually, the elastic bands of standard deviation have been compressed within the rigid boundaries of the average true range. From a price action mechanics standpoint, this indicates a period of extraordinarily low volatility. The market is coiling like a spring. The absence of price movement is not a lack of interest; rather, it is a localized equilibrium where buyers and sellers are deadlocked, often masking significant institutional accumulation or distribution beneath the surface.
• The Ignition Sequence: The resolution of the Squeeze occurs when the Bollinger Bands rupture outward, crossing back outside the boundaries of the Keltner Channels. This signifies the release of stored kinetic energy. Volatility is expanding rapidly, and the equilibrium has been shattered.
• Directional Confirmation: The volatility expansion itself is directionally agnostic—it merely tells the analyst that a major move is occurring. Therefore, the narrative must be supplemented by momentum oscillators or order flow analysis. Observing how price interacts with the mean—whether it launches off the moving average to the upside or breaks down below it—dictates the vector of the expanding volatility.
During the expansion phase, price will often "walk the bands," persistently closing outside the upper or lower Bollinger Band. To a novice trader, this appears overbought or oversold, but to the quantitative tactician, this is the hallmark of a robust, self-sustaining trend fueled by aggressive liquidity displacement.
● Institutional vs. Retail Perspective: The Liquidity Trap
The divergence between how retail traders and institutional algorithms interpret the interplay of Bollinger Bands and Keltner Channels is profound.
From the retail perspective, technical indicators are often viewed through a deterministic, mean-reversion lens. A retail trader observes the price touching the upper Bollinger Band and assumes the asset is overextended, prompting a short position. When the market is in a low-volatility Squeeze, retail participants often attempt to trade the chop, scalping small reversals from the upper boundary to the lower boundary of the compressed bands. Consequently, when the true volatility expansion occurs, these participants find themselves caught on the wrong side of the market, scrambling to cover positions, which inadvertently provides the fuel for the breakout.
Institutional players and high-frequency trading algorithms view this volatility matrix through the paradigm of market microstructure and liquidity engineering. During the Squeeze phase, smart money is actively building large positions. The compressed price action allows them to absorb liquidity without drastically altering the asset's price, carefully managing their footprints within the tight boundaries of the Keltner Channels. The breakout is not a surprise to them; it is often initiated by them. As the Bollinger Bands expand outward, breaking the Keltner thresholds, algorithmic systems detect the volatility shift and aggressively enter the market to capture the momentum, targeting resting liquidity pools, order blocks, and unmitigated fair value gaps left during previous price structures. For the institution, the Squeeze is the workshop of accumulation, and the band expansion is the delivery of price to external liquidity zones.
● Strategic Variance: Adapting to Market Regimes
A robust algorithmic or manual trading strategy must adapt its interpretation of the Volatility Matrix based on the prevailing market regime. The behavior of these overlapping channels shifts dramatically across different environments.
• Trending Regimes: In a strong, established trend, the Bollinger Bands will maintain a wide posture, consistently outside the Keltner Channels. The price action will exhibit a phenomenon where it rides the upper Keltner and Bollinger bands in a bullish environment, or the lower bands in a bearish environment. Pullbacks typically respect the mean—the 20-period moving average—which acts as dynamic support. During this regime, the system is in an expansion state, and mean-reversion strategies must be strictly avoided.
• Ranging and Consolidating Regimes: When the market enters a macro-level range, the Bollinger Bands will contract and weave in and out of the Keltner Channels. Price will oscillate violently across the moving average without establishing a definitive vector. During this phase, the Keltner Channels act as excellent absolute boundaries for mean-reversion trading, as the ATR provides a mathematically sound threshold for over-extension in a directionless market.
• High Volatility and Fat-Tail Shocks: During news events or macroeconomic data releases, the market microstructure can fracture. In these moments, the Bollinger Bands will balloon outward exponentially due to the squaring of the deviation in their formula. The Keltner Channels, however, will lag significantly because the ATR averages out the true range over a longer period. This massive divergence between the two indicators warns the quantitative analyst that price action is currently unpredictable, driven by pure sentiment and liquidity voids rather than structural support and resistance.
● Psychological Architecture: The Discipline of the Coil
The psychological demands of trading the convergence of Bollinger Bands and Keltner Channels are immense. The greatest emotional hurdle for the trader is enduring the Squeeze. Human psychology is naturally inclined toward action and instant gratification. When the market goes quiet and the bands compress tightly inside the channels, traders experience acute boredom and anxiety. This cognitive dissonance often leads to forced, premature trades based on the anticipation of a breakout rather than mathematical confirmation.
Traders frequently fall victim to recency bias during these prolonged consolidations, subconsciously believing that the low-volatility environment will persist indefinitely. When the breakout finally occurs, hesitation and fear of missing out (FOMO) take over. By the time the retail trader recognizes the expansion of the Bollinger Bands outside the Keltner Channels, the most lucrative portion of the institutional mark-up phase has already passed.
Mastery of this matrix requires the trader to adopt an algorithmic mindset. One must become comfortable with inactivity. The psychological architecture of a successful quantitative trader demands that they view the Squeeze not as a period of dead capital, but as the active loading of a high-probability setup. Action is only taken when the parameters align—when the standard deviation violently pierces the true range boundary—stripping emotion from the execution and replacing it with probabilistic certainty.
● Risk & Probability Sagas: Asymmetric Profiling
The ultimate utility of overlaying Bollinger Bands with Keltner Channels lies in the mathematical philosophy of risk and asymmetric reward generation. Standard deviation and average true range are not just directional indicators; they are deeply ingrained in the pricing models of risk itself.
When a market is in a deep Squeeze, the implied volatility of the asset is crushed. In the options market, this means that premiums (specifically the Vega component) are historically cheap. The quantitative trader understands that they are purchasing potential energy at a massive discount. A breakout strategy initiated precisely when the Bollinger Bands expand outside the Keltner Channels offers an incredibly skewed risk-to-reward ratio. The trader is risking a mathematically defined amount—usually placing a stop-loss just on the opposite side of the moving average or just outside the opposing ATR boundary—to capture a volatility expansion that has no predetermined upper limit.
Furthermore, relying on the Keltner Channels (ATR) for stop-loss placement rather than the Bollinger Bands (Standard Deviation) provides a structural advantage. Because financial markets exhibit non-normal distributions with violent wicks, a stop-loss based strictly on standard deviation will frequently get triggered by anomalous liquidity sweeps. The ATR provides a more robust, volatility-adjusted cushion that respects the true daily movement of the asset, keeping the trader safely in the position while the kinetic energy of the squeeze is fully unleashed. Through this rigorous, logic-driven framework, the volatile chaos of the market is transformed into a highly structured engine for extracting alpha.
Based on the concepts previously discussed, the Volatility Squeeze Ignition indicator was developed to reflect the academic and technical principles outlined in this article.
● Professional Financial Risk Warning:
The information provided in this article is for educational and informational purposes only and does not constitute financial, investment, or trading advice. Trading in financial markets, including equities, forex, commodities, and derivatives, involves a high degree of risk and may not be suitable for all investors. Past performance of any trading system, technical indicator, or methodology is not necessarily indicative of future results. The concepts of market microstructure, technical analysis, and quantitative modeling discussed herein carry inherent uncertainties, and market conditions can change rapidly. You should carefully consider your investment objectives, level of experience, and risk appetite before engaging in any trading activities. Always consult with a certified financial advisor or professional before making any financial decisions. You are solely responsible for your own trading outcomes and capital risk.
NQ Power Range Report with FIB Ext - 7/15/2026 SessionCME_MINI:NQU2026
- PR High: 29806.25
- PR Low: 29745.50
- NZ Spread: 135.75
Key scheduled economic events:
08:30 | PPI
10:30 | Crude Oil Inventories
AMP Margins Notice: Until further notice, we will be setting the US Equity Indices Margins to 25% during the US Overnight Session (starting at 5pm CST) until shortly after the listed U.S. Economic News Releases.
Session Open Stats (As of 12:15 AM)
- Session Open ATR: 672.29
- Volume: 35K
- Open Int: 287K
- Trend Grade: Short
- From BA ATH: -3.5% (Rounded)
Key Levels (Rounded - Think of these as ranges)
- Long: 31904
- Mid: 29517
- Short: 27131
Keep in mind this is not speculation or a prediction. Only a report of the Power Range with Fib extensions for target hunting. Do your DD! You determine your risk tolerance. You are fully capable of making your own decisions.
BA: Back Adjusted
BuZ/BeZ: Bull Zone / Bear Zone
NZ: Neutral Zone
S&P 500: Potential Topping SignalsThe S&P 500 has drifted for two months, and some traders may see potential signs of topping.
The first pattern on today’s chart is the June 15 peak of 7,578. SPX closed Friday at that old weekly high, followed by a drop on Monday. Staying below that level could suggest that resistance has taken hold.
Second, narrowing Bollinger Bandwidth may reflect a potential lull before volatility rebounds.
Third, the index peaked at 7,273 on May 5 and bounced there 5-6 weeks later. Could traders expect a retest of that level?
Finally, prices are near the rising 50-day simple moving average. Could a drop beneath it signal an intermediate-term reversal?
TradeStation has, for decades, advanced the trading industry, providing access to stocks, options and futures. If you're born to trade, we could be for you. Learn more here about TradingView’s Broker of the Year!
Past performance, whether actual or indicated by historical tests of strategies, is no guarantee of future performance or success. There is a possibility that you may sustain a loss equal to or greater than your entire investment regardless of which asset class you trade (equities, options or futures); therefore, you should not invest or risk money that you cannot afford to lose. Online trading is not suitable for all investors. View the document titled Characteristics and Risks of Standardized Options at www.TradeStation.com . Before trading any asset class, customers must read the relevant risk disclosure statements on www.TradeStation.com . System access and trade placement and execution may be delayed or fail due to market volatility and volume, quote delays, system and software errors, Internet traffic, outages and other factors.
Securities and futures trading is offered to self-directed customers by TradeStation Securities, Inc., a broker-dealer registered with the Securities and Exchange Commission and a futures commission merchant licensed with the Commodity Futures Trading Commission). TradeStation Securities is a member of the Financial Industry Regulatory Authority, the National Futures Association, and a number of exchanges.
TradeStation Securities, Inc. and TradeStation Technologies, Inc. are each wholly owned subsidiaries of TradeStation Group, Inc., both operating, and providing products and services, under the TradeStation brand and trademark. When applying for, or purchasing, accounts, subscriptions, products and services, it is important that you know which company you will be dealing with. Visit www.TradeStation.com for further important information explaining what this means.