OPEN-SOURCE SCRIPT
Trinity Multi-Timeframe S/R Levels
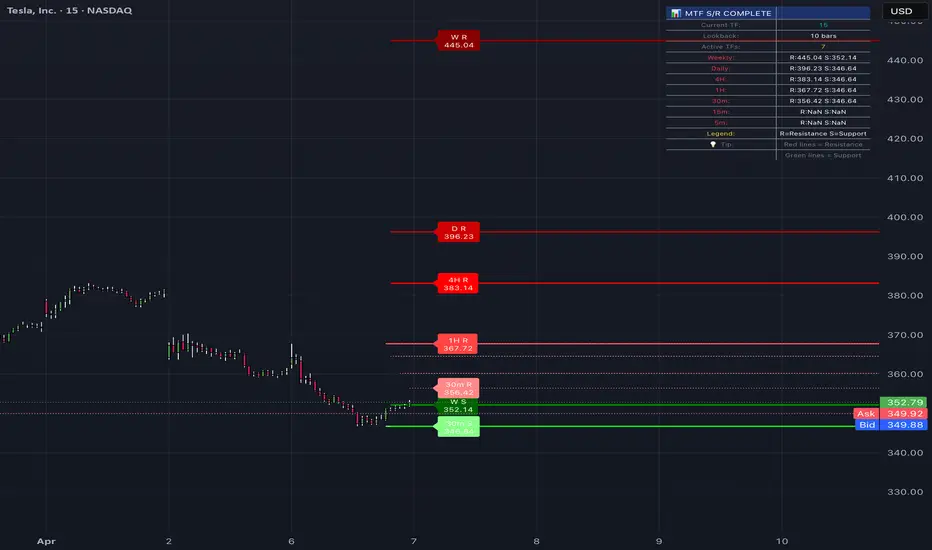
Trinity MTF Support & Resistance Indicator - Quick Start Guide
## What This Indicator Does
This indicator draws support and resistance lines from seven different timeframes directly onto your current chart. Weekly, daily, 4-hour, 1-hour, 30-minute, 15-minute, and 5-minute levels all appear simultaneously. Red lines represent resistance where price might struggle to break above. Green lines represent support where price might find buying interest. Each line has a small label showing which timeframe it comes from and the exact price level.
## How To Add The Indicator
Open TradingView and click on the Pine Editor tab at the bottom. Delete any existing code and paste the entire indicator script. Click Save and name it MTF Support Resistance Complete. Click Add to Chart. The indicator will appear immediately on your chart.
## Initial Setup For 5-Minute Scalping
Change your chart timeframe to 5 minutes by clicking on the timeframe selector at the top right of your chart and selecting 5 minutes. Click on the gear icon next to the indicator name to open settings. In the Timeframe Settings section, make sure all seven timeframes are enabled. In the Range Settings section, set Range Lookback to 10. In the Line Settings section, set Weekly and Daily line width to 3, 4-hour and 1-hour line width to 2, and all lower timeframes to 1. Set Weekly and Daily line style to solid, 4-hour and 1-hour to solid, and the rest to dotted. In the Label Settings section, enable Show Labels and set Label Offset to 5. Enable the dashboard and position it in the top right corner.
## Understanding What You See On Your Chart
Your chart will now display multiple horizontal lines extending to the right. The thickest, darkest red lines are your weekly and daily resistance levels. The thickest, darkest green lines are your weekly and daily support levels. The thinner red and green lines are your 4-hour and 1-hour levels. The dotted pink and light green lines are your 30-minute, 15-minute, and 5-minute levels. Every line has a small label on the far right. The label shows the timeframe, an R for resistance or S for support, and the price value to four decimal places.
## How To Read The Labels
A label that says 4H R 1.2345 means this is the 4-hour resistance level at price 1.2345. A label that says Daily S 1.2000 means this is the daily support level at price 1.2000. The dashboard in the corner shows all active levels in a compact list with current prices.
## How To Trade Using These Levels
For long entries, look for price to be approaching a green support line from above. The most reliable long signals occur at weekly or daily support. Secondary signals occur at 4-hour or 1-hour support. Watch for candlestick reversal patterns like hammers, bullish engulfing, or pin bars when price touches these levels. Enter when you see confirmation. Place your stop loss a few pips below the support level. Take profit at the next resistance level above.
For short entries, look for price to be approaching a red resistance line from below. The most reliable short signals occur at weekly or daily resistance. Secondary signals occur at 4-hour or 1-hour resistance. Watch for candlestick reversal patterns like shooting stars, bearish engulfing, or pin bars when price touches these levels. Enter when you see confirmation. Place your stop loss a few pips above the resistance level. Take profit at the next support level below.
## Understanding Level Clusters
When multiple timeframe levels cluster near the same price, that area becomes extremely significant. For example, if weekly support at 50,000, daily support at 50,100, and 4-hour support at 50,050 are all within a small range, this cluster is very difficult for price to break. Bounces from these clusters are often powerful and fast. Breakouts through these clusters require significant volume and momentum.
## How To Use The Dashboard
The dashboard shows your current chart timeframe, the range lookback value, how many timeframes are active, and the current price of every active level. Red numbers indicate resistance. Green numbers indicate support. Use the dashboard as a quick reference without having to scan the entire chart.
## Setting Up Alerts
In the indicator settings under Alert Settings, enable alerts by turning on the toggle. Set your alert distance to 0.1 percent for cryptocurrency or 0.05 percent for forex. This means you will receive an alert when price comes within that percentage of any level. Go to the TradingView alert dialog, select your indicator from the conditions list, and choose any alert condition. Set the alert to trigger once per bar. You will now receive notifications when price approaches key levels.
## Best Practices For Each Timeframe
Weekly levels change slowly, sometimes only once per week. These are your major turning points. When price reaches a weekly level, expect a significant reaction.
Daily levels change daily. These determine your overall trend direction. Price above daily support is bullish. Price below daily resistance is bearish.
Four-hour and 1-hour levels change several times per day. These are your primary trading levels. Most of your entries and exits will happen at these levels.
Thirty-minute, 15-minute, and 5-minute levels change frequently. Use these only for fine-tuning entries and managing stops. Do not base major trading decisions on these levels alone.
## Common Trading Scenarios
When price is approaching weekly support and also showing bullish divergence on the RSI, this is a high-probability long setup.
When price breaks through daily resistance with volume surge, that resistance becomes support. Wait for price to retest the broken level from above before entering long.
When multiple resistance levels stack vertically above price, each level represents a profit target. Take partial profits at each level.
When support and resistance levels from different timeframes are far apart, price has room to move. Wide ranges between levels are good for trend trading.
## What To Do When Levels Are Violated
When price closes decisively through a support level, that level becomes resistance. Wait for price to retest the broken level from below before entering short. When price closes decisively through a resistance level, that level becomes support. Wait for price to retest the broken level from above before entering long. The violation of a higher timeframe level like weekly or daily is more significant than violation of a lower timeframe level like 15-minute or 5-minute.
## Optimizing For Different Assets
For cryptocurrency trading, keep all seven timeframes enabled. Set alert distance to 0.15 percent. Use range lookback of 10. Focus primarily on weekly, daily, and 4-hour levels.
For forex trading, enable weekly, daily, 4-hour, and 1-hour levels. You may not need 30-minute, 15-minute, and 5-minute levels. Set alert distance to 0.05 percent. Use range lookback of 15.
For stock trading, enable all seven timeframes. Set alert distance to 0.1 percent. Use range lookback of 20. Pay special attention to weekly and daily levels as stocks often respect these more than intraday levels.
## Troubleshooting
If you see no lines on your chart, check that you have enabled at least one timeframe in the settings. If you see lines but no labels, check that Show Labels is enabled in the label settings. If labels overlap with price action, increase the label offset value. If your chart looks too cluttered, disable lower timeframes like 30-minute, 15-minute, and 5-minute, or change their line styles to dotted with thinner widths. If the dashboard is in your way, change its position to a different corner or disable it completely.
## Final Tips
Start with all timeframes enabled and gradually disable the ones you find less useful. The weekly and daily levels are the most important for understanding market context. Do not take trades that go against the weekly level. The dashboard updates automatically as levels change. Watch for level clusters as these provide the highest probability setups. Use alerts to catch levels being tested without staring at the chart all day. Practice on historical data using TradingView's replay mode before trading live.
This indicator transforms your 5-minute chart into a complete roadmap of where price is likely to react. Red lines show you where to sell or take profits. Green lines show you where to buy or cover shorts. The labels remove all guesswork about which timeframe each level belongs to. After a few days of using this tool, you will develop an instinct for how price moves between these levels and where the next turning point is likely to occur.
## What This Indicator Does
This indicator draws support and resistance lines from seven different timeframes directly onto your current chart. Weekly, daily, 4-hour, 1-hour, 30-minute, 15-minute, and 5-minute levels all appear simultaneously. Red lines represent resistance where price might struggle to break above. Green lines represent support where price might find buying interest. Each line has a small label showing which timeframe it comes from and the exact price level.
## How To Add The Indicator
Open TradingView and click on the Pine Editor tab at the bottom. Delete any existing code and paste the entire indicator script. Click Save and name it MTF Support Resistance Complete. Click Add to Chart. The indicator will appear immediately on your chart.
## Initial Setup For 5-Minute Scalping
Change your chart timeframe to 5 minutes by clicking on the timeframe selector at the top right of your chart and selecting 5 minutes. Click on the gear icon next to the indicator name to open settings. In the Timeframe Settings section, make sure all seven timeframes are enabled. In the Range Settings section, set Range Lookback to 10. In the Line Settings section, set Weekly and Daily line width to 3, 4-hour and 1-hour line width to 2, and all lower timeframes to 1. Set Weekly and Daily line style to solid, 4-hour and 1-hour to solid, and the rest to dotted. In the Label Settings section, enable Show Labels and set Label Offset to 5. Enable the dashboard and position it in the top right corner.
## Understanding What You See On Your Chart
Your chart will now display multiple horizontal lines extending to the right. The thickest, darkest red lines are your weekly and daily resistance levels. The thickest, darkest green lines are your weekly and daily support levels. The thinner red and green lines are your 4-hour and 1-hour levels. The dotted pink and light green lines are your 30-minute, 15-minute, and 5-minute levels. Every line has a small label on the far right. The label shows the timeframe, an R for resistance or S for support, and the price value to four decimal places.
## How To Read The Labels
A label that says 4H R 1.2345 means this is the 4-hour resistance level at price 1.2345. A label that says Daily S 1.2000 means this is the daily support level at price 1.2000. The dashboard in the corner shows all active levels in a compact list with current prices.
## How To Trade Using These Levels
For long entries, look for price to be approaching a green support line from above. The most reliable long signals occur at weekly or daily support. Secondary signals occur at 4-hour or 1-hour support. Watch for candlestick reversal patterns like hammers, bullish engulfing, or pin bars when price touches these levels. Enter when you see confirmation. Place your stop loss a few pips below the support level. Take profit at the next resistance level above.
For short entries, look for price to be approaching a red resistance line from below. The most reliable short signals occur at weekly or daily resistance. Secondary signals occur at 4-hour or 1-hour resistance. Watch for candlestick reversal patterns like shooting stars, bearish engulfing, or pin bars when price touches these levels. Enter when you see confirmation. Place your stop loss a few pips above the resistance level. Take profit at the next support level below.
## Understanding Level Clusters
When multiple timeframe levels cluster near the same price, that area becomes extremely significant. For example, if weekly support at 50,000, daily support at 50,100, and 4-hour support at 50,050 are all within a small range, this cluster is very difficult for price to break. Bounces from these clusters are often powerful and fast. Breakouts through these clusters require significant volume and momentum.
## How To Use The Dashboard
The dashboard shows your current chart timeframe, the range lookback value, how many timeframes are active, and the current price of every active level. Red numbers indicate resistance. Green numbers indicate support. Use the dashboard as a quick reference without having to scan the entire chart.
## Setting Up Alerts
In the indicator settings under Alert Settings, enable alerts by turning on the toggle. Set your alert distance to 0.1 percent for cryptocurrency or 0.05 percent for forex. This means you will receive an alert when price comes within that percentage of any level. Go to the TradingView alert dialog, select your indicator from the conditions list, and choose any alert condition. Set the alert to trigger once per bar. You will now receive notifications when price approaches key levels.
## Best Practices For Each Timeframe
Weekly levels change slowly, sometimes only once per week. These are your major turning points. When price reaches a weekly level, expect a significant reaction.
Daily levels change daily. These determine your overall trend direction. Price above daily support is bullish. Price below daily resistance is bearish.
Four-hour and 1-hour levels change several times per day. These are your primary trading levels. Most of your entries and exits will happen at these levels.
Thirty-minute, 15-minute, and 5-minute levels change frequently. Use these only for fine-tuning entries and managing stops. Do not base major trading decisions on these levels alone.
## Common Trading Scenarios
When price is approaching weekly support and also showing bullish divergence on the RSI, this is a high-probability long setup.
When price breaks through daily resistance with volume surge, that resistance becomes support. Wait for price to retest the broken level from above before entering long.
When multiple resistance levels stack vertically above price, each level represents a profit target. Take partial profits at each level.
When support and resistance levels from different timeframes are far apart, price has room to move. Wide ranges between levels are good for trend trading.
## What To Do When Levels Are Violated
When price closes decisively through a support level, that level becomes resistance. Wait for price to retest the broken level from below before entering short. When price closes decisively through a resistance level, that level becomes support. Wait for price to retest the broken level from above before entering long. The violation of a higher timeframe level like weekly or daily is more significant than violation of a lower timeframe level like 15-minute or 5-minute.
## Optimizing For Different Assets
For cryptocurrency trading, keep all seven timeframes enabled. Set alert distance to 0.15 percent. Use range lookback of 10. Focus primarily on weekly, daily, and 4-hour levels.
For forex trading, enable weekly, daily, 4-hour, and 1-hour levels. You may not need 30-minute, 15-minute, and 5-minute levels. Set alert distance to 0.05 percent. Use range lookback of 15.
For stock trading, enable all seven timeframes. Set alert distance to 0.1 percent. Use range lookback of 20. Pay special attention to weekly and daily levels as stocks often respect these more than intraday levels.
## Troubleshooting
If you see no lines on your chart, check that you have enabled at least one timeframe in the settings. If you see lines but no labels, check that Show Labels is enabled in the label settings. If labels overlap with price action, increase the label offset value. If your chart looks too cluttered, disable lower timeframes like 30-minute, 15-minute, and 5-minute, or change their line styles to dotted with thinner widths. If the dashboard is in your way, change its position to a different corner or disable it completely.
## Final Tips
Start with all timeframes enabled and gradually disable the ones you find less useful. The weekly and daily levels are the most important for understanding market context. Do not take trades that go against the weekly level. The dashboard updates automatically as levels change. Watch for level clusters as these provide the highest probability setups. Use alerts to catch levels being tested without staring at the chart all day. Practice on historical data using TradingView's replay mode before trading live.
This indicator transforms your 5-minute chart into a complete roadmap of where price is likely to react. Red lines show you where to sell or take profits. Green lines show you where to buy or cover shorts. The labels remove all guesswork about which timeframe each level belongs to. After a few days of using this tool, you will develop an instinct for how price moves between these levels and where the next turning point is likely to occur.
نص برمجي مفتوح المصدر
بروح TradingView الحقيقية، قام مبتكر هذا النص البرمجي بجعله مفتوح المصدر، بحيث يمكن للمتداولين مراجعة وظائفه والتحقق منها. شكرا للمؤلف! بينما يمكنك استخدامه مجانًا، تذكر أن إعادة نشر الكود يخضع لقواعد الموقع الخاصة بنا.

إخلاء المسؤولية
لا يُقصد بالمعلومات والمنشورات أن تكون، أو تشكل، أي نصيحة مالية أو استثمارية أو تجارية أو أنواع أخرى من النصائح أو التوصيات المقدمة أو المعتمدة من TradingView. اقرأ المزيد في شروط الاستخدام.
نص برمجي مفتوح المصدر
بروح TradingView الحقيقية، قام مبتكر هذا النص البرمجي بجعله مفتوح المصدر، بحيث يمكن للمتداولين مراجعة وظائفه والتحقق منها. شكرا للمؤلف! بينما يمكنك استخدامه مجانًا، تذكر أن إعادة نشر الكود يخضع لقواعد الموقع الخاصة بنا.
إخلاء المسؤولية
لا يُقصد بالمعلومات والمنشورات أن تكون، أو تشكل، أي نصيحة مالية أو استثمارية أو تجارية أو أنواع أخرى من النصائح أو التوصيات المقدمة أو المعتمدة من TradingView. اقرأ المزيد في شروط الاستخدام.