Strong Recovery Zones | ProjectSyndicate
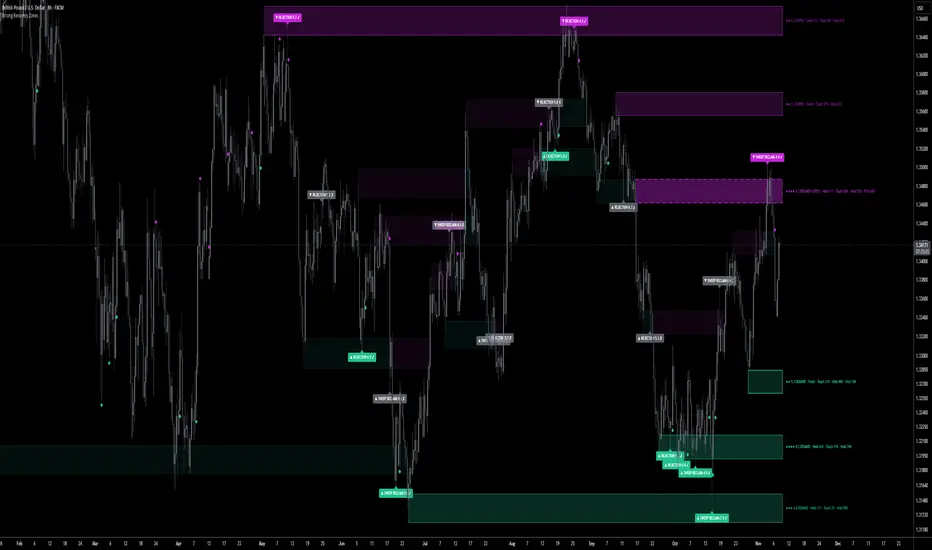
Strong Recovery Zones maps the levels where price is most likely to recover, and puts real numbers on each one. Every volume-qualified swing pivot becomes a demand or supply zone, ranked 0–10. A Monte Carlo engine estimates how likely price is to reach each zone. A test-and-outcome engine tracks every visit, records honestly whether the zone held, stalled or broke, and turns that record into a hold estimate. Each zone carries one line on the chart: its score, its record, its Touch % and its Hold %. Sweep Reclaim and Rejection signals print only at qualified zones, and each one marks itself ✔ or ✘ once its outcome is known.
Most zone tools tell you where a level is. This one tells you how likely price is to get there, and how often levels like it actually held.
🎯 The Recovery Engine — the core. Every time price enters a zone, the engine opens a test, and every test ends exactly one way:
▪️ HELD — price closes one full ATR beyond the zone within the test window. The zone defended and price recovered.
▪️ STALLED — the window ran out without a recovery.
▪️ BROKEN — price closed beyond the far border.
Nothing is skipped. Failed tests count against the zone the same as wins count for it, so the record on the label is the zone’s real history.
🔥 Sweep Reclaim & Rejection Signals — the two recovery triggers.
▪️ SWEEP RECLAIM: a wick pierces the far border (the liquidity grab), then price closes back through the zone (the failed break). You choose how deep the reclaim close must be: far border, midline or near border.
▪️ REJECTION: price taps the zone and closes back out with a strong rejection wick.
Each test can fire one signal at most, and only from a zone scoring 5 or higher. Every signal gets its own 0–10 score from grab depth, wick, volume surge, zone strength, displacement and speed. The tag shows the setup name and score, then turns ✔ (held) or grey ✘ (broken or stalled) once the test resolves. Hover a tag for the full breakdown: hold estimate, zone record, zone range, volume surge and grab depth.
🎲 Monte Carlo Probability Engine — Touch % and First %. The engine simulates 1,000 forward price paths, either resampled from recent returns or drawn from a Gaussian model, and reports:
▪️ Touch % — the chance each zone is reached within the horizon (30 bars by default).
▪️ First % — for the nearest demand and supply zones, the chance this zone is reached before the opposite one.
It runs on confirmed bars only, so the numbers stay fixed until the bar closes. An optional forecast cone shows the simulated range.
🛡️ Hold Estimate — Hold %. Each zone’s own held/tested record is blended with the record of every zone on its side. A fresh zone starts from what this market’s zones have actually done, and as it collects tests its own history takes over.
📊 Order-Flow Qualified Zones. A pivot becomes a zone only if its volume ranks high enough within the recent volume window, so thin pivots never draw. Each bar’s volume is split into buying and selling by where it closed in its range. That flow, plus how far price moved away from the zone after the pivot, feeds the zone’s score.
🧲 Confluence Merging — no stacked boxes. A new pivot that lands within 1 ATR of a live zone on the same side merges into it instead of drawing a second box. The zone refreshes, gains a confluence count, and its score rises. Levels the market keeps returning to get stronger, and the chart stays clean.
🔢 0–10 Zone Score — printed on every zone. The score blends pivot volume rank, departure strength, the defense record, and confluence plus reclaimed sweeps. Idle decay fades levels the market has stopped caring about. Stars, score and type sit on the label: ★★★ 7.4 DEMAND.
💥 Breakers — when the level really breaks. A broken zone stays on the chart as faint dotted history, so you can see where structure failed. It is also reborn on the other side as a BREAKER zone with a dashed border, ready for a break-and-retest continuation.
🧼 Universal Zone Height. Every zone gets the same clean ATR-based height, centred on the swing, so every level carries equal visual weight. An optional Volume Wick Band mode sizes each zone from the swing extreme to the volume-weighted body edge, where the absorption happened.
🧹 Clean-Chart Discipline. Only the nearest zones above and below price are drawn and labelled (4 per side by default), and their labels are spaced so they never overlap. Zones brighten as price approaches. Every zone, drawn or not, keeps being tracked and scored in the background. One line per zone, compact signal tags, small diamonds for confirmed holds, and no dashboard.
🏷️ Labels That Read at a Glance. Example: ★★ 5.5 BREAKER SUPPLY · Held 1/1 · Touch 83% · Hold 58% · First 62% · TESTING. That shows the score, the zone type, the record, the probability of a touch, the probability of a hold, which side gets hit first, and the live state (TESTING / SWEPT). Need more? Switch labels to Detailed or Full to add the price range, volume rank, buy/sell delta, touch × hold edge and average reaction in ATR.
🎨 Fully Configurable. Demand and supply tones, transparency, borders and glow. Label size, mode and spacing. Zones per side. Pivot length, volume-rank floor, zone height and spacing. Test window, recovery target, sweep depth, reclaim depth and wick threshold. The breaker toggle and history depth. An optional RSI filter. The full set of zone-score and signal-score weights. Monte Carlo paths, horizon, return sample, model, drift and seed.
🔒 Honest, Non-Repainting Core. Zones anchor to confirmed swing pivots, which, like all pivots, confirm a few bars after the fact; that is inherent, not a defect. Signals are judged on the bar’s close and fixed once it closes. Monte Carlo probabilities update on confirmed bars only. Every test counts, including stalls, breaks and tests cut short when a zone expires. Signal ✔/✘ marks are never erased, so a failed signal stays visible and the win rate is never flattered. Touch % comes from a random-walk simulation of recent returns: it measures how far a zone is for this market’s volatility, not which way price will go. Hold % comes from the zone and side records, not a guarantee. Scores, probabilities and records are decision support for directing attention, not a backtested edge.
🔔 Native Alerts. New Recovery Zone, Zone Test, Zone Sweep, Bullish / Bearish / Any / Strong Recovery Signal, Demand / Supply Hold Confirmed, Zone Broken / Flipped, and proximity to the nearest demand, nearest supply and any strong zone. There is also an optional detailed alert() message carrying the signal, price, zone range, hold estimate and record.
🎯 Why this is different. Bounce tools fade every touch and get run over on the break. Breakout tools buy the break and get trapped on the reclaim. Strong Recovery Zones grades the level, measures the odds of reaching it, shows how often levels like it held, and only then frames the recovery. You trade a level with numbers on it, not a line you hope holds.
🚀 Apply to Gold (XAUUSD), Silver, Forex, Crypto, Indices and Futures on any timeframe. Volume sharpens zone qualification and scoring where a symbol carries it; the test engine, signals and probabilities work on any market.
💡 Cleanest setup: raise Min Zone Score For Signals to 6–7 and set Sweep Reclaim Close to Midline for fewer, higher-quality triggers. Keep Zones Shown Per Side at 3–4. Watch the nearest pair’s First % to see which side price is leaning toward, and turn on the RSI filter when you want strictly contrarian recoveries.
🎯 How To Trade It — Two Approaches
Everything hinges on one read: is price at a strong zone with a good hold record, and did it just show a recovery signal?
◾ 1) Trade the recovery — the core thesis
Use when a high-scoring zone with a solid Hold % is tested and fires a signal.
▪️ Mark the strong zones (7+) with Hold % above the side average. These are the levels worth defending.
▪️ Check Touch % and First %. A zone price is likely to reach, and likely to reach first, is the one to prepare for.
▪️ Trigger: a SWEEP RECLAIM (strongest: stops grabbed, break failed) or a REJECTION at the zone (Recovery Signal alert).
▪️ Entry: on the signal close, in the zone’s direction — long at demand, short at supply.
▪️ Stop: beyond the sweep extreme, or beyond the far border plus the break tolerance. A close past it means the zone broke.
▪️ Target: one ATR beyond the zone first (the engine’s HELD threshold), then the next zone on the other side.
⚖️ The cleanest version: a ★★★ demand zone carrying confluence ×3 and a Held 4/5 record, Touch 70%, First 65%. Price spears below it, grabs the stops, then closes back inside on a volume surge: SWEEP RECLAIM 7.8. Grab, fail, recover. That is the exact event this tool is built to frame, and the tag will show you how it ended.
◾ 2) Stand down — the map says wait
▪️ Broken, not recovered — price closed beyond the far border (Zone Broken alert). Watch the new BREAKER zone for a retest instead.
▪️ Weak zones or poor records — low scores and Hold % below 50% mean nothing worth defending. Let structure develop.
▪️ No signal yet — a zone being approached is not a zone recovering. Wait for the sweep reclaim or rejection close.
▪️ Low Touch % — the zone is too far for this horizon. It’s a map reference, not a setup.
Rule of thumb: ⭐ Strong zone + healthy Hold % + recovery signal in the zone’s direction → trade the recovery toward the next zone. ⭐ Break, weak record, low Touch %, or no signal yet → stand down until the map agrees.
Most zone tools tell you where a level is. This one tells you how likely price is to get there, and how often levels like it actually held.
🎯 The Recovery Engine — the core. Every time price enters a zone, the engine opens a test, and every test ends exactly one way:
▪️ HELD — price closes one full ATR beyond the zone within the test window. The zone defended and price recovered.
▪️ STALLED — the window ran out without a recovery.
▪️ BROKEN — price closed beyond the far border.
Nothing is skipped. Failed tests count against the zone the same as wins count for it, so the record on the label is the zone’s real history.
🔥 Sweep Reclaim & Rejection Signals — the two recovery triggers.
▪️ SWEEP RECLAIM: a wick pierces the far border (the liquidity grab), then price closes back through the zone (the failed break). You choose how deep the reclaim close must be: far border, midline or near border.
▪️ REJECTION: price taps the zone and closes back out with a strong rejection wick.
Each test can fire one signal at most, and only from a zone scoring 5 or higher. Every signal gets its own 0–10 score from grab depth, wick, volume surge, zone strength, displacement and speed. The tag shows the setup name and score, then turns ✔ (held) or grey ✘ (broken or stalled) once the test resolves. Hover a tag for the full breakdown: hold estimate, zone record, zone range, volume surge and grab depth.
🎲 Monte Carlo Probability Engine — Touch % and First %. The engine simulates 1,000 forward price paths, either resampled from recent returns or drawn from a Gaussian model, and reports:
▪️ Touch % — the chance each zone is reached within the horizon (30 bars by default).
▪️ First % — for the nearest demand and supply zones, the chance this zone is reached before the opposite one.
It runs on confirmed bars only, so the numbers stay fixed until the bar closes. An optional forecast cone shows the simulated range.
🛡️ Hold Estimate — Hold %. Each zone’s own held/tested record is blended with the record of every zone on its side. A fresh zone starts from what this market’s zones have actually done, and as it collects tests its own history takes over.
📊 Order-Flow Qualified Zones. A pivot becomes a zone only if its volume ranks high enough within the recent volume window, so thin pivots never draw. Each bar’s volume is split into buying and selling by where it closed in its range. That flow, plus how far price moved away from the zone after the pivot, feeds the zone’s score.
🧲 Confluence Merging — no stacked boxes. A new pivot that lands within 1 ATR of a live zone on the same side merges into it instead of drawing a second box. The zone refreshes, gains a confluence count, and its score rises. Levels the market keeps returning to get stronger, and the chart stays clean.
🔢 0–10 Zone Score — printed on every zone. The score blends pivot volume rank, departure strength, the defense record, and confluence plus reclaimed sweeps. Idle decay fades levels the market has stopped caring about. Stars, score and type sit on the label: ★★★ 7.4 DEMAND.
💥 Breakers — when the level really breaks. A broken zone stays on the chart as faint dotted history, so you can see where structure failed. It is also reborn on the other side as a BREAKER zone with a dashed border, ready for a break-and-retest continuation.
🧼 Universal Zone Height. Every zone gets the same clean ATR-based height, centred on the swing, so every level carries equal visual weight. An optional Volume Wick Band mode sizes each zone from the swing extreme to the volume-weighted body edge, where the absorption happened.
🧹 Clean-Chart Discipline. Only the nearest zones above and below price are drawn and labelled (4 per side by default), and their labels are spaced so they never overlap. Zones brighten as price approaches. Every zone, drawn or not, keeps being tracked and scored in the background. One line per zone, compact signal tags, small diamonds for confirmed holds, and no dashboard.
🏷️ Labels That Read at a Glance. Example: ★★ 5.5 BREAKER SUPPLY · Held 1/1 · Touch 83% · Hold 58% · First 62% · TESTING. That shows the score, the zone type, the record, the probability of a touch, the probability of a hold, which side gets hit first, and the live state (TESTING / SWEPT). Need more? Switch labels to Detailed or Full to add the price range, volume rank, buy/sell delta, touch × hold edge and average reaction in ATR.
🎨 Fully Configurable. Demand and supply tones, transparency, borders and glow. Label size, mode and spacing. Zones per side. Pivot length, volume-rank floor, zone height and spacing. Test window, recovery target, sweep depth, reclaim depth and wick threshold. The breaker toggle and history depth. An optional RSI filter. The full set of zone-score and signal-score weights. Monte Carlo paths, horizon, return sample, model, drift and seed.
🔒 Honest, Non-Repainting Core. Zones anchor to confirmed swing pivots, which, like all pivots, confirm a few bars after the fact; that is inherent, not a defect. Signals are judged on the bar’s close and fixed once it closes. Monte Carlo probabilities update on confirmed bars only. Every test counts, including stalls, breaks and tests cut short when a zone expires. Signal ✔/✘ marks are never erased, so a failed signal stays visible and the win rate is never flattered. Touch % comes from a random-walk simulation of recent returns: it measures how far a zone is for this market’s volatility, not which way price will go. Hold % comes from the zone and side records, not a guarantee. Scores, probabilities and records are decision support for directing attention, not a backtested edge.
🔔 Native Alerts. New Recovery Zone, Zone Test, Zone Sweep, Bullish / Bearish / Any / Strong Recovery Signal, Demand / Supply Hold Confirmed, Zone Broken / Flipped, and proximity to the nearest demand, nearest supply and any strong zone. There is also an optional detailed alert() message carrying the signal, price, zone range, hold estimate and record.
🎯 Why this is different. Bounce tools fade every touch and get run over on the break. Breakout tools buy the break and get trapped on the reclaim. Strong Recovery Zones grades the level, measures the odds of reaching it, shows how often levels like it held, and only then frames the recovery. You trade a level with numbers on it, not a line you hope holds.
🚀 Apply to Gold (XAUUSD), Silver, Forex, Crypto, Indices and Futures on any timeframe. Volume sharpens zone qualification and scoring where a symbol carries it; the test engine, signals and probabilities work on any market.
💡 Cleanest setup: raise Min Zone Score For Signals to 6–7 and set Sweep Reclaim Close to Midline for fewer, higher-quality triggers. Keep Zones Shown Per Side at 3–4. Watch the nearest pair’s First % to see which side price is leaning toward, and turn on the RSI filter when you want strictly contrarian recoveries.
🎯 How To Trade It — Two Approaches
Everything hinges on one read: is price at a strong zone with a good hold record, and did it just show a recovery signal?
◾ 1) Trade the recovery — the core thesis
Use when a high-scoring zone with a solid Hold % is tested and fires a signal.
▪️ Mark the strong zones (7+) with Hold % above the side average. These are the levels worth defending.
▪️ Check Touch % and First %. A zone price is likely to reach, and likely to reach first, is the one to prepare for.
▪️ Trigger: a SWEEP RECLAIM (strongest: stops grabbed, break failed) or a REJECTION at the zone (Recovery Signal alert).
▪️ Entry: on the signal close, in the zone’s direction — long at demand, short at supply.
▪️ Stop: beyond the sweep extreme, or beyond the far border plus the break tolerance. A close past it means the zone broke.
▪️ Target: one ATR beyond the zone first (the engine’s HELD threshold), then the next zone on the other side.
⚖️ The cleanest version: a ★★★ demand zone carrying confluence ×3 and a Held 4/5 record, Touch 70%, First 65%. Price spears below it, grabs the stops, then closes back inside on a volume surge: SWEEP RECLAIM 7.8. Grab, fail, recover. That is the exact event this tool is built to frame, and the tag will show you how it ended.
◾ 2) Stand down — the map says wait
▪️ Broken, not recovered — price closed beyond the far border (Zone Broken alert). Watch the new BREAKER zone for a retest instead.
▪️ Weak zones or poor records — low scores and Hold % below 50% mean nothing worth defending. Let structure develop.
▪️ No signal yet — a zone being approached is not a zone recovering. Wait for the sweep reclaim or rejection close.
▪️ Low Touch % — the zone is too far for this horizon. It’s a map reference, not a setup.
Rule of thumb: ⭐ Strong zone + healthy Hold % + recovery signal in the zone’s direction → trade the recovery toward the next zone. ⭐ Break, weak record, low Touch %, or no signal yet → stand down until the map agrees.

Gold Algo Trading · +1100% YTD · max DD <5%
Syndicate Ultimate · 5 algo systems · 1 bundle
1 payment · lifetime access · no monthly fees
+ FX · NQ/ES · 10+ yr institutional desk
syndicate001.com
Join on Telegram
t.me/aisyndicate001
Syndicate Ultimate · 5 algo systems · 1 bundle
1 payment · lifetime access · no monthly fees
+ FX · NQ/ES · 10+ yr institutional desk
syndicate001.com
Join on Telegram
t.me/aisyndicate001
إخلاء المسؤولية
لا يُقصد بالمعلومات والمنشورات أن تكون، أو تشكل، أي نصيحة مالية أو استثمارية أو تجارية أو أنواع أخرى من النصائح أو التوصيات المقدمة أو المعتمدة من TradingView. اقرأ المزيد في شروط الاستخدام.
Gold Algo Trading · +1100% YTD · max DD <5%
Syndicate Ultimate · 5 algo systems · 1 bundle
1 payment · lifetime access · no monthly fees
+ FX · NQ/ES · 10+ yr institutional desk
syndicate001.com
Join on Telegram
t.me/aisyndicate001
Syndicate Ultimate · 5 algo systems · 1 bundle
1 payment · lifetime access · no monthly fees
+ FX · NQ/ES · 10+ yr institutional desk
syndicate001.com
Join on Telegram
t.me/aisyndicate001
إخلاء المسؤولية
لا يُقصد بالمعلومات والمنشورات أن تكون، أو تشكل، أي نصيحة مالية أو استثمارية أو تجارية أو أنواع أخرى من النصائح أو التوصيات المقدمة أو المعتمدة من TradingView. اقرأ المزيد في شروط الاستخدام.