OPEN-SOURCE SCRIPT
Order Flow Microstructure Engine
# Order Flow Microstructure Engine
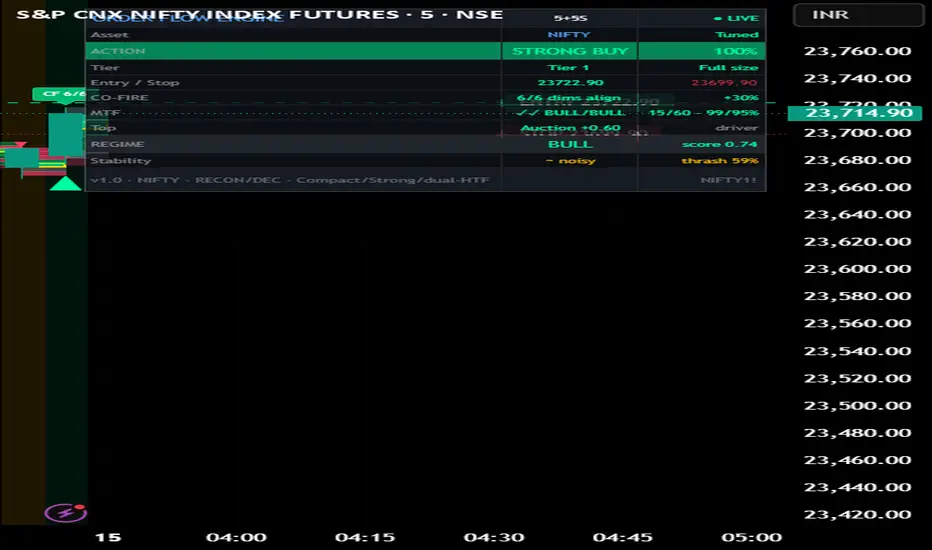
**Order Flow Microstructure Engine** condenses a full stack of order-flow and market-microstructure measures into a single decision: one confidence %, one tier, and one action with entry/stop levels — shown in an adaptive on-chart dashboard. It is built to answer one question on every bar: *are aggressive buyers or aggressive sellers in control, and how convinced should you be?*
This is not a bundle of unrelated indicators placed on one chart. Every component measures a **different facet of the same process** — the buy/sell auction happening inside each bar — and they are combined inside **one probabilistic model**. The reason for the mashup, and how the parts interact, is described below as the guidelines require.
**Why these components are combined (mashup justification)**
No single order-flow measure is reliable alone: raw delta misleads during absorption, CVD drifts, footprint imbalances appear in chop, and toxicity rises at both reversals and breakouts. Because these weaknesses are *partially independent*, fusing the measures correctly cancels noise that any one of them carries. The original element is **how** the fusion is done — not what is plotted.
**How it works (the pipeline)**
1. *Reconstruction.* Lower-timeframe sub-bars are pulled and each is classified buy/sell with a tick-rule cascade (after Lee & Ready). Where the data plan exposes native volume footprint, real bid/ask is used and aggregated into the same price bins. The dashboard always shows whether it is running on reconstructed (`RECON`) or native (`NATIVE`) data.
2. *Factors.* From that base it derives Aggressor Imbalance Ratio, Cumulative Volume Delta, footprint imbalances/POC, auction Value-Area efficiency (acceptance vs rejection), integrated multi-level Order-Flow Imbalance (depth-weighted), VPIN-style flow toxicity, Kyle's lambda price-impact/liquidity, a directional self-exciting (Hawkes) intensity, and a square-root-law absorption measure.
3. *Fusion (the original part).* Each factor is mapped to a probability and combined in Bayesian log-odds. Crucially, the flow-derived factors are **decorrelated before fusion** using an effective-sample-size (design-effect) shrinkage, so factors that are really the *same evidence* (AIR, delta, CVD, footprint, OFI) cannot inflate confidence just by agreeing. Structurally independent factors (auction efficiency, MOC, Hawkes, absorption, cross-instrument) enter at full weight. The posterior is then gated by multi-timeframe and multi-horizon consensus and damped by a regime-thrash (chop) penalty, producing one confidence → a 5-tier ladder → an action.
Without this combination you would get several conflicting opinions; the value is the **correlation-aware fusion** that turns them into one calibrated read.
**How to use it**
- Apply to a liquid instrument on an intraday timeframe (1m–1h). Defaults are tuned for index futures on 5-minute charts with 5-second sub-bars.
- Read the Compact dashboard top-down: ACTION + confidence %, Tier (position-size guidance), Entry/Stop, then CO-FIRE confluence, multi-timeframe and regime/stability. Switch "Table view mode" to Full for a complete factor-by-factor breakdown.
- On-chart triangles mark Tier-1/Tier-2 long/short signals across history; footprint boxes show the intrabar buy/sell distribution.
- For other markets: change the **Market preset** (group 01). Choose **CUSTOM** to set your own session, MOC window, footprint bin sizing and CVD reset — making it usable on any instrument in any market.
- The dashboard theme auto-adapts to a light or dark chart background.
**What makes it original**
Correlation-aware decorrelated Bayesian fusion of order-flow factors; a native-footprint seam that uses real bid/ask when available and transparently falls back to reconstruction; layered multi-horizon + multi-timeframe + cross-instrument confirmation on a microstructure base; and a regime-stability filter that penalizes only genuine directional reversals, not same-direction intensity changes.
**Honesty / limitations**
On most retail feeds, order flow here is reconstructed from lower-timeframe data via the tick rule (~75–80% trade-sign accuracy), not true exchange bid/ask, unless your plan provides native footprint data. The data source is shown in the dashboard. This is an analytic and educational tool, not financial advice and not a guarantee of results.
**Concept credits**
Lee & Ready (trade sign); Kyle (price impact / lambda); Easley, López de Prado & O'Hara (VPIN); Cont, Kukanov & Stoikov and Xu, Gould & Howison (OFI / multi-level OFI); Hawkes and Bacry–Muzy (self-exciting intensity); Almgren and Tóth–Bouchaud (square-root impact law); Kaufman (Efficiency-Ratio adaptation); Steidlmayer (Market Profile / Value Area); Kish (design effect). All Pine implementations are original re-derivations; no external script code is used.
**Disclaimer**
For research and educational purposes only. Nothing here is financial advice. Markets carry risk and past behaviour does not guarantee future results. Always do your own research and manage risk.
**Order Flow Microstructure Engine** condenses a full stack of order-flow and market-microstructure measures into a single decision: one confidence %, one tier, and one action with entry/stop levels — shown in an adaptive on-chart dashboard. It is built to answer one question on every bar: *are aggressive buyers or aggressive sellers in control, and how convinced should you be?*
This is not a bundle of unrelated indicators placed on one chart. Every component measures a **different facet of the same process** — the buy/sell auction happening inside each bar — and they are combined inside **one probabilistic model**. The reason for the mashup, and how the parts interact, is described below as the guidelines require.
**Why these components are combined (mashup justification)**
No single order-flow measure is reliable alone: raw delta misleads during absorption, CVD drifts, footprint imbalances appear in chop, and toxicity rises at both reversals and breakouts. Because these weaknesses are *partially independent*, fusing the measures correctly cancels noise that any one of them carries. The original element is **how** the fusion is done — not what is plotted.
**How it works (the pipeline)**
1. *Reconstruction.* Lower-timeframe sub-bars are pulled and each is classified buy/sell with a tick-rule cascade (after Lee & Ready). Where the data plan exposes native volume footprint, real bid/ask is used and aggregated into the same price bins. The dashboard always shows whether it is running on reconstructed (`RECON`) or native (`NATIVE`) data.
2. *Factors.* From that base it derives Aggressor Imbalance Ratio, Cumulative Volume Delta, footprint imbalances/POC, auction Value-Area efficiency (acceptance vs rejection), integrated multi-level Order-Flow Imbalance (depth-weighted), VPIN-style flow toxicity, Kyle's lambda price-impact/liquidity, a directional self-exciting (Hawkes) intensity, and a square-root-law absorption measure.
3. *Fusion (the original part).* Each factor is mapped to a probability and combined in Bayesian log-odds. Crucially, the flow-derived factors are **decorrelated before fusion** using an effective-sample-size (design-effect) shrinkage, so factors that are really the *same evidence* (AIR, delta, CVD, footprint, OFI) cannot inflate confidence just by agreeing. Structurally independent factors (auction efficiency, MOC, Hawkes, absorption, cross-instrument) enter at full weight. The posterior is then gated by multi-timeframe and multi-horizon consensus and damped by a regime-thrash (chop) penalty, producing one confidence → a 5-tier ladder → an action.
Without this combination you would get several conflicting opinions; the value is the **correlation-aware fusion** that turns them into one calibrated read.
**How to use it**
- Apply to a liquid instrument on an intraday timeframe (1m–1h). Defaults are tuned for index futures on 5-minute charts with 5-second sub-bars.
- Read the Compact dashboard top-down: ACTION + confidence %, Tier (position-size guidance), Entry/Stop, then CO-FIRE confluence, multi-timeframe and regime/stability. Switch "Table view mode" to Full for a complete factor-by-factor breakdown.
- On-chart triangles mark Tier-1/Tier-2 long/short signals across history; footprint boxes show the intrabar buy/sell distribution.
- For other markets: change the **Market preset** (group 01). Choose **CUSTOM** to set your own session, MOC window, footprint bin sizing and CVD reset — making it usable on any instrument in any market.
- The dashboard theme auto-adapts to a light or dark chart background.
**What makes it original**
Correlation-aware decorrelated Bayesian fusion of order-flow factors; a native-footprint seam that uses real bid/ask when available and transparently falls back to reconstruction; layered multi-horizon + multi-timeframe + cross-instrument confirmation on a microstructure base; and a regime-stability filter that penalizes only genuine directional reversals, not same-direction intensity changes.
**Honesty / limitations**
On most retail feeds, order flow here is reconstructed from lower-timeframe data via the tick rule (~75–80% trade-sign accuracy), not true exchange bid/ask, unless your plan provides native footprint data. The data source is shown in the dashboard. This is an analytic and educational tool, not financial advice and not a guarantee of results.
**Concept credits**
Lee & Ready (trade sign); Kyle (price impact / lambda); Easley, López de Prado & O'Hara (VPIN); Cont, Kukanov & Stoikov and Xu, Gould & Howison (OFI / multi-level OFI); Hawkes and Bacry–Muzy (self-exciting intensity); Almgren and Tóth–Bouchaud (square-root impact law); Kaufman (Efficiency-Ratio adaptation); Steidlmayer (Market Profile / Value Area); Kish (design effect). All Pine implementations are original re-derivations; no external script code is used.
**Disclaimer**
For research and educational purposes only. Nothing here is financial advice. Markets carry risk and past behaviour does not guarantee future results. Always do your own research and manage risk.
نص برمجي مفتوح المصدر
بروح TradingView الحقيقية، قام مبتكر هذا النص البرمجي بجعله مفتوح المصدر، بحيث يمكن للمتداولين مراجعة وظائفه والتحقق منها. شكرا للمؤلف! بينما يمكنك استخدامه مجانًا، تذكر أن إعادة نشر الكود يخضع لقواعد الموقع الخاصة بنا.

إخلاء المسؤولية
لا يُقصد بالمعلومات والمنشورات أن تكون، أو تشكل، أي نصيحة مالية أو استثمارية أو تجارية أو أنواع أخرى من النصائح أو التوصيات المقدمة أو المعتمدة من TradingView. اقرأ المزيد في شروط الاستخدام.
نص برمجي مفتوح المصدر
بروح TradingView الحقيقية، قام مبتكر هذا النص البرمجي بجعله مفتوح المصدر، بحيث يمكن للمتداولين مراجعة وظائفه والتحقق منها. شكرا للمؤلف! بينما يمكنك استخدامه مجانًا، تذكر أن إعادة نشر الكود يخضع لقواعد الموقع الخاصة بنا.
إخلاء المسؤولية
لا يُقصد بالمعلومات والمنشورات أن تكون، أو تشكل، أي نصيحة مالية أو استثمارية أو تجارية أو أنواع أخرى من النصائح أو التوصيات المقدمة أو المعتمدة من TradingView. اقرأ المزيد في شروط الاستخدام.