Prism Adaptive RSI [NeBlok]
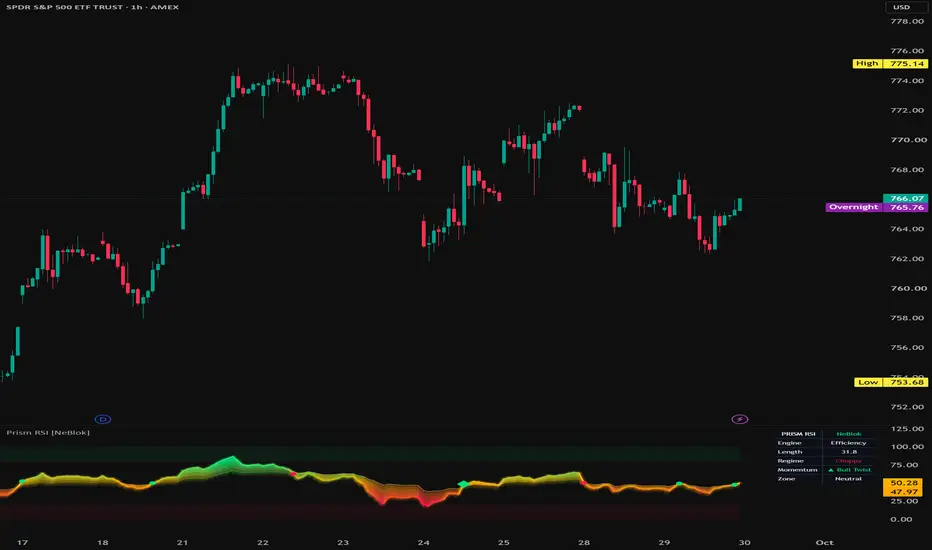
Prism Adaptive RSI [NeBlok]
OVERVIEW
Prism Adaptive RSI is a momentum oscillator built on an RSI whose lookback length changes bar by bar to match current market conditions. Instead of a single line, it plots five layers of the same adaptive RSI at staggered speeds and shades the space between them as a "prism" ribbon. When the fastest layer crosses the slowest layer, the ribbon visibly twists. That twist is the core momentum signal.
A standard RSI uses a fixed lookback, so it gives false overbought/oversold readings in choppy markets and flips too early in strong trends. This version adapts: it speeds up when price is trending cleanly and slows down when price is chopping sideways.
HOW IT WORKS
1. Adaptive Engine (choose one in settings)
Efficiency Ratio (default)
Measures how directly price has traveled over the lookback window compared to the total distance it moved bar to bar. A clean, one-directional move scores near 1. Sideways noise scores near 0.
- Trending market → shorter RSI length → the oscillator reaches and holds its extremes, so a strong trend stays "pinned" near 80+ or 20- instead of giving early exit signals.
- Choppy market → longer RSI length → the oscillator stays closer to the middle, which filters out fake overbought/oversold readings.
Dominant Cycle
Uses the Ehlers homodyne discriminator to estimate the market's current dominant cycle (in bars), then sets the RSI length to a fraction of that cycle (half by default). This suits markets that rotate rhythmically rather than trend.
The adaptive length is always kept between your Min Length and Max Length settings.
2. The Prism Ribbon
Five copies of the adaptive RSI are calculated, each running at a different multiple of the adaptive length (from fast to slow). The four bands between them are shaded on a red → amber → green spectrum based on where the oscillator sits:
- Green: momentum in the upper zone (bullish pressure)
- Amber: neutral / transitioning momentum
- Red: momentum in the lower zone (bearish pressure)
The fast layer is drawn as the bright glowing line. The slow layer is the thin line at the other edge of the ribbon.
3. The 3D Look
TradingView does not support true 3D rendering, so depth is simulated with an extruded "wall" beneath the ribbon, layered transparency from front to back, a neon glow on the lead line, and a thin highlight along the top edge. Each effect can be switched off under Visuals.
HOW TO READ IT
Ribbon direction
- Fast layer above slow layer = bullish twist (momentum rising)
- Fast layer below slow layer = bearish twist (momentum falling)
Ribbon width
- A wide ribbon means the fast and slow layers disagree strongly, which usually means momentum is accelerating.
- A narrow, flattening ribbon means momentum is fading and a twist may be coming.
Pinned extremes
When the ribbon holds above 80 or below 20 for an extended period, that is usually a sign of trend strength, not an automatic reversal signal. The adaptive engine is designed to let strong trends stay pinned.
SIGNALS
Dot = Ribbon Flip
The fast layer crossed the slow layer. This marks a shift in short-term momentum direction.
Diamond = Exhaustion Flip
A flip that happens shortly after the fast layer touched the overbought or oversold zone (within the Exhaustion Lookback window). These mark momentum turning after a stretched move and are the higher-quality signal of the two.
Buy Low / Sell High Filter (on by default)
When enabled, bullish flips only count if the slow layer is below 50, and bearish flips only count if it is above 50. This removes flips that happen in the "wrong" half of the range, such as a bullish flip that fires when momentum is already extended.
DASHBOARD
The table in the corner of the pane shows live readings:
- Engine: which adaptive engine is active
- Length: the current adaptive RSI length
- Regime: Trending, Mixed, or Choppy, based on the efficiency ratio
- Momentum: current twist direction
- Zone: Overbought, Oversold, or Neutral
HOW TO USE IT
Trend continuation
In a Trending regime, look for the ribbon to pull back toward the middle without fully breaking down, then flip back in the trend's direction. Flips with the trend tend to be more reliable than flips against it.
Mean reversion
In a Choppy regime, diamonds (exhaustion flips) near the zones can mark turning points within a range. Choppy conditions also produce more flips overall, so be selective.
Confirmation, not standalone entries
Prism RSI works best as one input among several. Use it to confirm a setup you already have (structure, levels, volume, higher-timeframe bias) rather than as a buy/sell button on its own.
Timeframes
Works on any timeframe and any market. On fast intraday charts (1-5 minute), increasing Post Smoothing to 3 reduces noise. On higher timeframes, the defaults are a good starting point.
SETTINGS GUIDE
Adaptive Engine
- Source: price input (default close)
- Engine: Efficiency Ratio or Dominant Cycle
- Min / Max Length: the range the adaptive RSI length can move within
- Efficiency Lookback: bars used to measure trend efficiency
- Cycle Multiplier: fraction of the dominant cycle used as RSI length (Dominant Cycle engine only)
Prism Ribbon
- Layer Spread: how far apart the five layer speeds are. Higher values make a wider, more dramatic ribbon with fewer flips.
- Post Smoothing: extra smoothing applied to every layer. Raise it to reduce noise.
Signals
- Overbought / Oversold: zone levels (default 80 / 20)
- Buy Low / Sell High Filter: see Signals section above
- Exhaustion Lookback: how recently the fast layer must have touched a zone for a flip to count as an exhaustion flip
Visuals
- Bull / Neutral / Bear colors
- 3D Extrusion and Depth
- Neon Glow
- Top Highlight
- Color Price Bars: tints the main chart candles with the ribbon's color
- Show Dashboard
ALERTS
The script has built-in alerts for bullish flips, bearish flips, bullish exhaustion flips, and bearish exhaustion flips. To use them, create an alert on the indicator and choose "Any alert() function call." Alerts fire once per bar close.
NOTES AND LIMITATIONS
- Signals are confirmed on bar close. On the live (unclosed) bar, the ribbon and any signal can still change until the bar closes.
- The script does not use higher-timeframe data or future bars, so confirmed historical signals do not repaint.
- Like every oscillator, Prism RSI can stay overbought or oversold for long periods during strong trends. An extreme reading alone is not a reversal signal.
- Past signal behavior does not guarantee future results. Always test any tool on your own markets and timeframes before relying on it.
DISCLAIMER
This indicator is provided for educational and informational purposes only. It is not financial advice, investment advice, or a recommendation to buy or sell any security, futures contract, cryptocurrency, or other financial instrument. Trading involves substantial risk of loss and is not suitable for every investor. You are solely responsible for your own trading decisions. Past performance, whether actual or indicated by historical signals, is not indicative of future results. The author assumes no liability for any losses incurred from the use of this indicator. Consult a licensed financial professional before making any investment decisions.
OVERVIEW
Prism Adaptive RSI is a momentum oscillator built on an RSI whose lookback length changes bar by bar to match current market conditions. Instead of a single line, it plots five layers of the same adaptive RSI at staggered speeds and shades the space between them as a "prism" ribbon. When the fastest layer crosses the slowest layer, the ribbon visibly twists. That twist is the core momentum signal.
A standard RSI uses a fixed lookback, so it gives false overbought/oversold readings in choppy markets and flips too early in strong trends. This version adapts: it speeds up when price is trending cleanly and slows down when price is chopping sideways.
HOW IT WORKS
1. Adaptive Engine (choose one in settings)
Efficiency Ratio (default)
Measures how directly price has traveled over the lookback window compared to the total distance it moved bar to bar. A clean, one-directional move scores near 1. Sideways noise scores near 0.
- Trending market → shorter RSI length → the oscillator reaches and holds its extremes, so a strong trend stays "pinned" near 80+ or 20- instead of giving early exit signals.
- Choppy market → longer RSI length → the oscillator stays closer to the middle, which filters out fake overbought/oversold readings.
Dominant Cycle
Uses the Ehlers homodyne discriminator to estimate the market's current dominant cycle (in bars), then sets the RSI length to a fraction of that cycle (half by default). This suits markets that rotate rhythmically rather than trend.
The adaptive length is always kept between your Min Length and Max Length settings.
2. The Prism Ribbon
Five copies of the adaptive RSI are calculated, each running at a different multiple of the adaptive length (from fast to slow). The four bands between them are shaded on a red → amber → green spectrum based on where the oscillator sits:
- Green: momentum in the upper zone (bullish pressure)
- Amber: neutral / transitioning momentum
- Red: momentum in the lower zone (bearish pressure)
The fast layer is drawn as the bright glowing line. The slow layer is the thin line at the other edge of the ribbon.
3. The 3D Look
TradingView does not support true 3D rendering, so depth is simulated with an extruded "wall" beneath the ribbon, layered transparency from front to back, a neon glow on the lead line, and a thin highlight along the top edge. Each effect can be switched off under Visuals.
HOW TO READ IT
Ribbon direction
- Fast layer above slow layer = bullish twist (momentum rising)
- Fast layer below slow layer = bearish twist (momentum falling)
Ribbon width
- A wide ribbon means the fast and slow layers disagree strongly, which usually means momentum is accelerating.
- A narrow, flattening ribbon means momentum is fading and a twist may be coming.
Pinned extremes
When the ribbon holds above 80 or below 20 for an extended period, that is usually a sign of trend strength, not an automatic reversal signal. The adaptive engine is designed to let strong trends stay pinned.
SIGNALS
Dot = Ribbon Flip
The fast layer crossed the slow layer. This marks a shift in short-term momentum direction.
Diamond = Exhaustion Flip
A flip that happens shortly after the fast layer touched the overbought or oversold zone (within the Exhaustion Lookback window). These mark momentum turning after a stretched move and are the higher-quality signal of the two.
Buy Low / Sell High Filter (on by default)
When enabled, bullish flips only count if the slow layer is below 50, and bearish flips only count if it is above 50. This removes flips that happen in the "wrong" half of the range, such as a bullish flip that fires when momentum is already extended.
DASHBOARD
The table in the corner of the pane shows live readings:
- Engine: which adaptive engine is active
- Length: the current adaptive RSI length
- Regime: Trending, Mixed, or Choppy, based on the efficiency ratio
- Momentum: current twist direction
- Zone: Overbought, Oversold, or Neutral
HOW TO USE IT
Trend continuation
In a Trending regime, look for the ribbon to pull back toward the middle without fully breaking down, then flip back in the trend's direction. Flips with the trend tend to be more reliable than flips against it.
Mean reversion
In a Choppy regime, diamonds (exhaustion flips) near the zones can mark turning points within a range. Choppy conditions also produce more flips overall, so be selective.
Confirmation, not standalone entries
Prism RSI works best as one input among several. Use it to confirm a setup you already have (structure, levels, volume, higher-timeframe bias) rather than as a buy/sell button on its own.
Timeframes
Works on any timeframe and any market. On fast intraday charts (1-5 minute), increasing Post Smoothing to 3 reduces noise. On higher timeframes, the defaults are a good starting point.
SETTINGS GUIDE
Adaptive Engine
- Source: price input (default close)
- Engine: Efficiency Ratio or Dominant Cycle
- Min / Max Length: the range the adaptive RSI length can move within
- Efficiency Lookback: bars used to measure trend efficiency
- Cycle Multiplier: fraction of the dominant cycle used as RSI length (Dominant Cycle engine only)
Prism Ribbon
- Layer Spread: how far apart the five layer speeds are. Higher values make a wider, more dramatic ribbon with fewer flips.
- Post Smoothing: extra smoothing applied to every layer. Raise it to reduce noise.
Signals
- Overbought / Oversold: zone levels (default 80 / 20)
- Buy Low / Sell High Filter: see Signals section above
- Exhaustion Lookback: how recently the fast layer must have touched a zone for a flip to count as an exhaustion flip
Visuals
- Bull / Neutral / Bear colors
- 3D Extrusion and Depth
- Neon Glow
- Top Highlight
- Color Price Bars: tints the main chart candles with the ribbon's color
- Show Dashboard
ALERTS
The script has built-in alerts for bullish flips, bearish flips, bullish exhaustion flips, and bearish exhaustion flips. To use them, create an alert on the indicator and choose "Any alert() function call." Alerts fire once per bar close.
NOTES AND LIMITATIONS
- Signals are confirmed on bar close. On the live (unclosed) bar, the ribbon and any signal can still change until the bar closes.
- The script does not use higher-timeframe data or future bars, so confirmed historical signals do not repaint.
- Like every oscillator, Prism RSI can stay overbought or oversold for long periods during strong trends. An extreme reading alone is not a reversal signal.
- Past signal behavior does not guarantee future results. Always test any tool on your own markets and timeframes before relying on it.
DISCLAIMER
This indicator is provided for educational and informational purposes only. It is not financial advice, investment advice, or a recommendation to buy or sell any security, futures contract, cryptocurrency, or other financial instrument. Trading involves substantial risk of loss and is not suitable for every investor. You are solely responsible for your own trading decisions. Past performance, whether actual or indicated by historical signals, is not indicative of future results. The author assumes no liability for any losses incurred from the use of this indicator. Consult a licensed financial professional before making any investment decisions.

إخلاء المسؤولية
لا يُقصد بالمعلومات والمنشورات أن تكون، أو تشكل، أي نصيحة مالية أو استثمارية أو تجارية أو أنواع أخرى من النصائح أو التوصيات المقدمة أو المعتمدة من TradingView. اقرأ المزيد في شروط الاستخدام.
إخلاء المسؤولية
لا يُقصد بالمعلومات والمنشورات أن تكون، أو تشكل، أي نصيحة مالية أو استثمارية أو تجارية أو أنواع أخرى من النصائح أو التوصيات المقدمة أو المعتمدة من TradingView. اقرأ المزيد في شروط الاستخدام.