SHM - Dual-WMA Momentum Oscillator
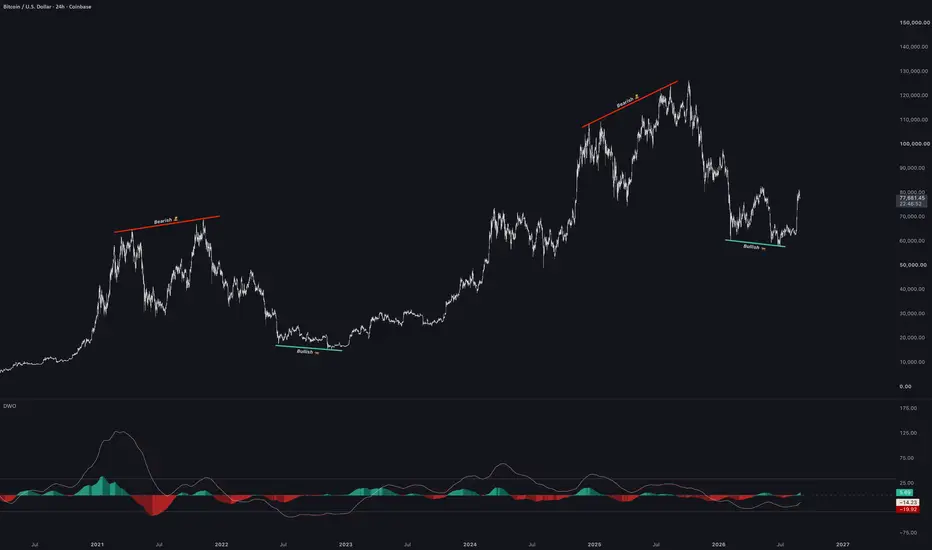
SHM - Dual-WMA Momentum Oscillator [DWO]
Overview-
The SHM Dual-WMA Momentum Oscillator (DWO) is an institutional-grade momentum indicator engineered to isolate structural trend direction, momentum acceleration, and high-probability market cycles across custom timeframes.
By calculating the percentage distance between a Fast WMA and a Slow WMA, the DWO filters out transient market noise and locks calculation logic to a customizable higher timeframe wave—allowing you to project and track macro momentum seamlessly across every chart resolution.
Key Features & Architecture-
* Flexible Multi-Timeframe (MTF) Engine: Complete control over your anchor timeframe (Anchor Momentum Timeframe). Choose your preferred momentum wave (e.g., 4H, Daily/24H, 3D, Weekly) and lock it to display consistently across all timeframes without repainting or distortion.
* Universal Timeframe Visibility: Lock your preferred anchor to the 4-Hour wave, and that 4H momentum wave stays strictly visible whether you zoom down to a 15-minute execution chart or step up to inspect the Daily or Weekly macro chart.
* Structural Trend Isolation: Eliminates short-term volatility, revealing where higher-timeframe capital flow is actually moving.
* Triple Equilibrium Baselines: Features customizable numeric anchor points (+33, 0, -33) paired with dynamic 4-color momentum acceleration histograms to easily spot expansion, exhaustion, and mean-reversion zones.
* Signal Tracking Line: Integrates an EMA-smoothed signal tracking line to highlight momentum crossovers and zero-line baseline retests cleanly.
How to Use for Analysis-
1. Selecting Your Anchor Timeframe:
* Set the Anchor Momentum Timeframe in the settings input to your preferred cycle (e.g., 240 for 4H execution, 1440 for Daily macro, or 1W for high-timeframe positioning).
2. Determining Trend Bias:
* DWO Line Above Zero Baseline: The selected anchor wave is structurally bullish. Intraday pullbacks act as buying liquidity within the broader trend.
* DWO Line Below Zero Baseline: The selected anchor wave is structurally bearish. Intraday bounces act as counter-trend rallies.
3. Equilibrium Acceleration Histograms:
* Green / Teal Histograms: Positive momentum acceleration relative to your selected anchor timeframe.
* Red / Dark Red Histograms: Negative momentum acceleration relative to your selected anchor timeframe.
Inputs & Settings-
* Anchor Momentum Timeframe (Default: 24H / 1440): Selects the timeframe wave to project across all charts (supports 1m up to 1W).
* Fast WMA Lookback (Default: 65): Controls the sensitivity of the primary signal curve.
* Slow WMA Lookback (Default: 480): Establishes the baseline filter for long-term trend isolation.
* Signal Smoothing Line (Default: 63): Adjusts the sensitivity of the EMA signal tracking curve.
* Triple Baseline Configuration: Sets the Y-axis levels for upper (+33), zero (0), and lower (-33) histograms.
Disclaimer
This script is designed for educational, informational, and analytical charting purposes only. It does not constitute financial or trading advice. Always perform independent analysis and practice strict risk management.
Overview-
The SHM Dual-WMA Momentum Oscillator (DWO) is an institutional-grade momentum indicator engineered to isolate structural trend direction, momentum acceleration, and high-probability market cycles across custom timeframes.
By calculating the percentage distance between a Fast WMA and a Slow WMA, the DWO filters out transient market noise and locks calculation logic to a customizable higher timeframe wave—allowing you to project and track macro momentum seamlessly across every chart resolution.
Key Features & Architecture-
* Flexible Multi-Timeframe (MTF) Engine: Complete control over your anchor timeframe (Anchor Momentum Timeframe). Choose your preferred momentum wave (e.g., 4H, Daily/24H, 3D, Weekly) and lock it to display consistently across all timeframes without repainting or distortion.
* Universal Timeframe Visibility: Lock your preferred anchor to the 4-Hour wave, and that 4H momentum wave stays strictly visible whether you zoom down to a 15-minute execution chart or step up to inspect the Daily or Weekly macro chart.
* Structural Trend Isolation: Eliminates short-term volatility, revealing where higher-timeframe capital flow is actually moving.
* Triple Equilibrium Baselines: Features customizable numeric anchor points (+33, 0, -33) paired with dynamic 4-color momentum acceleration histograms to easily spot expansion, exhaustion, and mean-reversion zones.
* Signal Tracking Line: Integrates an EMA-smoothed signal tracking line to highlight momentum crossovers and zero-line baseline retests cleanly.
How to Use for Analysis-
1. Selecting Your Anchor Timeframe:
* Set the Anchor Momentum Timeframe in the settings input to your preferred cycle (e.g., 240 for 4H execution, 1440 for Daily macro, or 1W for high-timeframe positioning).
2. Determining Trend Bias:
* DWO Line Above Zero Baseline: The selected anchor wave is structurally bullish. Intraday pullbacks act as buying liquidity within the broader trend.
* DWO Line Below Zero Baseline: The selected anchor wave is structurally bearish. Intraday bounces act as counter-trend rallies.
3. Equilibrium Acceleration Histograms:
* Green / Teal Histograms: Positive momentum acceleration relative to your selected anchor timeframe.
* Red / Dark Red Histograms: Negative momentum acceleration relative to your selected anchor timeframe.
Inputs & Settings-
* Anchor Momentum Timeframe (Default: 24H / 1440): Selects the timeframe wave to project across all charts (supports 1m up to 1W).
* Fast WMA Lookback (Default: 65): Controls the sensitivity of the primary signal curve.
* Slow WMA Lookback (Default: 480): Establishes the baseline filter for long-term trend isolation.
* Signal Smoothing Line (Default: 63): Adjusts the sensitivity of the EMA signal tracking curve.
* Triple Baseline Configuration: Sets the Y-axis levels for upper (+33), zero (0), and lower (-33) histograms.
Disclaimer
This script is designed for educational, informational, and analytical charting purposes only. It does not constitute financial or trading advice. Always perform independent analysis and practice strict risk management.

إخلاء المسؤولية
لا يُقصد بالمعلومات والمنشورات أن تكون، أو تشكل، أي نصيحة مالية أو استثمارية أو تجارية أو أنواع أخرى من النصائح أو التوصيات المقدمة أو المعتمدة من TradingView. اقرأ المزيد في شروط الاستخدام.
إخلاء المسؤولية
لا يُقصد بالمعلومات والمنشورات أن تكون، أو تشكل، أي نصيحة مالية أو استثمارية أو تجارية أو أنواع أخرى من النصائح أو التوصيات المقدمة أو المعتمدة من TradingView. اقرأ المزيد في شروط الاستخدام.