تم تحديثه
Buy-or-Sell-WiP
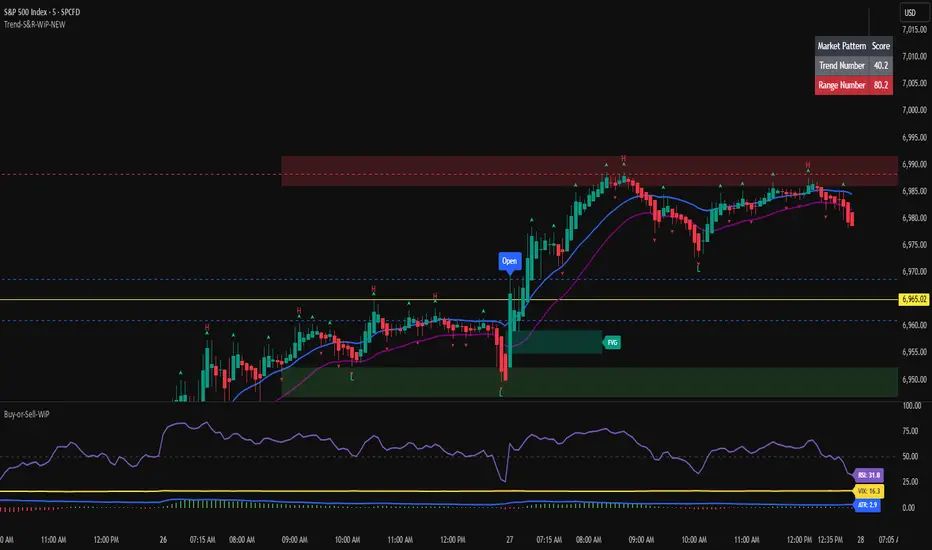
Indicator Features:
> Simple red/green histogram to indicate go long/buy or go short/sell
> Recommended to use with my other indicator: 5/15-Min-ORB-Trend-Finder-WiP
Strategy:
> Use with 1-min chart with 5-min High/Low or 5-min chart with 15-min High/Low
> After a breakout, wait for confirmation before placing a trade, which is:
- Two confirming candles (green for long/buy, red for short/sell)
and
- Buy-or-Sell-WiP histogram: green for long/buy, red for short/sell
ملاحظات الأخبار
Indicator Features:> Simple green (buy)/ red (sell) histogram.
> Recommended to be used with my other indicator: 5/15-Min-ORB-Trend-Finder-WiP
Strategy:
> I use this exclusively with SPX, trading CALL/PUT credit spreads.
> Use the 1-min chart with 5-min High/Low, or use the 5-min chart with 15-min High/Low.
> After a breakout, wait for the confirmations before placing a trade, which are:
- Two consecutive confirming candles (green for going long/buy, red for going short/sell).
and
- Buy-or-Sell-WiP histogram: green for long/buy, red for short/sell.
> NOTE: Do not place a trade unless there are 10-points, or more from the "go" candle to the nearest resistance line (when going long/buy) or support line (when going short/sell); the reason being the market may not move enough for you to take profit once your trade fills; FYI, I usually try for $0.30 profit when trading CALL/PUT credit spreads.
ملاحظات الأخبار
11/15/2025 - corrected the title by adding a shorttitle=Buy-or-Sell-WiPملاحظات الأخبار
11/28/2025 Update: combined ATR with MACD histogram, this will be used later with my secret ODTE Iron Condor strategy that I release with my Trade Calculator software.ملاحظات الأخبار
01/05/2026 - I've added...> the VIX line w/label (the CBOE Volatility Index which measures the market's expectation of 30-day volatility for the S&P 500),
- values above 30 indicate greater market fear and uncertainty,
- values below 20 suggest stability.
> and the ATR line w/label (Average True Range),
- helps gain a perspective on the market's historical volatility vs recent daily changes.
Both the VIX and ATR can be used to track a trade's performance and over time the historic data will tell you if a trade is a "go" or "no go".
ملاحظات الأخبار
2026.01.27 - added RSI, VIX, and ATR lines, all with labels for easy reference
إخلاء المسؤولية
لا يُقصد بالمعلومات والمنشورات أن تكون، أو تشكل، أي نصيحة مالية أو استثمارية أو تجارية أو أنواع أخرى من النصائح أو التوصيات المقدمة أو المعتمدة من TradingView. اقرأ المزيد في شروط الاستخدام.
إخلاء المسؤولية
لا يُقصد بالمعلومات والمنشورات أن تكون، أو تشكل، أي نصيحة مالية أو استثمارية أو تجارية أو أنواع أخرى من النصائح أو التوصيات المقدمة أو المعتمدة من TradingView. اقرأ المزيد في شروط الاستخدام.