تم تحديثه
Mbedaiwi Candlestick Patterns & Setups
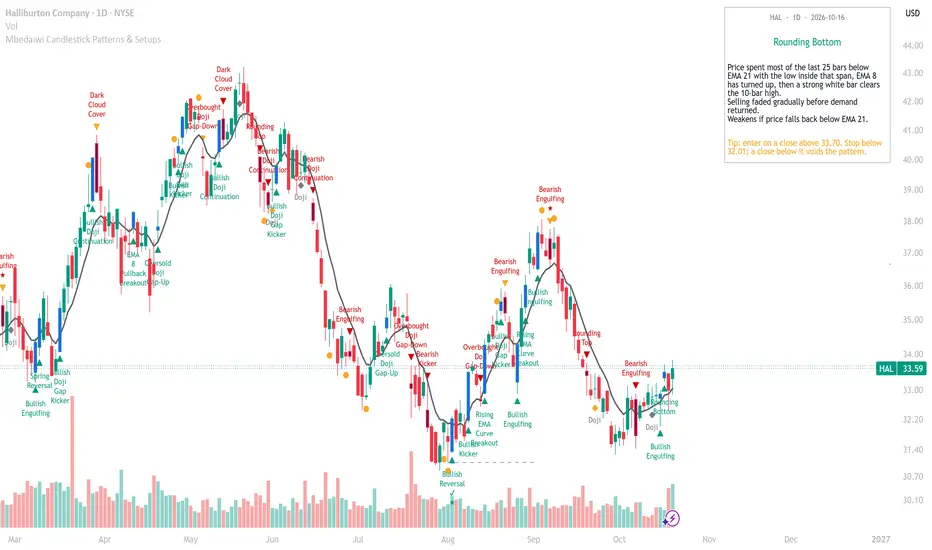
This indicator names Japanese candlestick patterns and a set of multi-bar price setups on the chart, and adds context that a candle alone cannot give: support and resistance, momentum, the direction of the market index, and a confirmation step. Bullish names are printed below the bar, bearish names above it. Hover any name to read what the pattern shows, how it is confirmed and where it is invalidated (English or Arabic).
What makes it different
How it works
1. Classic candles
2. Doji setups
3. Gap and kicker setups
4. Price setups
5. Lower-reliability setups (off by default, "Show low-reliability setups")
How to use it
Step 1: Choose what to see
In "1 - Groups" turn each family on or off. "Display set" can show both families, setups only, or classic candles only. Changing it hides groups but never moves a pattern.
Step 2: Read the colours
Step 3: Read the note
Hover a name to read the pattern, its confirmation and its invalidation. The notes panel shows the latest pattern with symbol, timeframe and date. "Notes language" can be English, العربية (Arabic) or Off.
Step 4: Plan the risk
Every bullish pattern has a clear invalidation level, usually the pattern low. Use it as the stop and size the position from it. For Bullish Reversal the stop line is drawn for you. A pattern is a question, not an answer: a close beyond its invalidation level ends it.
Step 5: Market filter (optional)
In "2c - Early warning & confirmation", "Market index" is empty by default (automatic). Enter any symbol, for example a sector index, to use it instead. Turn the filter off to show every Bullish Reversal in colour.
Step 6: Performance table (optional, off by default)
For each signal on the current chart the table counts how often price moved 1 x ATR in the signal direction before moving 1 x ATR against it, within the chosen number of bars. It describes the past on this chart only.
Step 7: Alerts
Alerts are included for bullish patterns, bearish patterns, confirmed reversals and early warnings. Use "Once per bar close" so alerts match what is drawn.
Step 8: Trade markers (optional, off by default)
"Show BUY / EXIT markers" draws a simple illustrative sequence: BUY on the first bullish signal while flat, EXIT at a stop of 1.5 x ATR below the entry close or on a close below EMA 8. It is a study aid, not a strategy or a backtest.
Repainting
With "Bar close only" on (default), names, marks and lines are drawn only after the bar closes and never change afterwards. The market index is read on the same timeframe with lookahead off, so no future data is used. With the option off, a name can appear and disappear while the current bar is still forming.
Limitations
Disclaimer
This script is for education and chart analysis only. It is not financial advice, and past patterns or statistics do not guarantee future results.
What makes it different
- Every size is relative. Bodies are compared with the average body of the previous 10 bars, and setup distances are measured in ATR, so the rules adapt to each symbol and timeframe.
- Location matters. Reversal candles are judged at support (the prior 20-bar low or the last confirmed swing low) or resistance (the prior 20-bar high or the last swing high), with the Stochastic stretched.
- Early warning, then confirmation. A yellow dot marks the first reversal-type bar at support or resistance. A ✔ is added when the next bar confirms the turn. A ★ marks an RSI divergence.
- The market is part of the signal. For stocks, the indicator reads the market index (TADAWUL:TASI for Saudi stocks, SP:SPX for other stocks and funds, or any index you choose). A Bullish Reversal while the index EMA 8 is falling is drawn in grey as a weaker signal.
- One name per bar by default, chosen from a fixed priority list, so the chart stays readable. Multi-bar setups win over the single candles they contain.
How it works
1. Classic candles
- Doji: open and close almost equal (body at most 5% of the average body). Grey diamond, information only.
- Bullish / Bearish Engulfing: a body that fully covers the previous opposite-colour body.
- Piercing Line: two long bars; the white bar opens below the black close and closes above its midpoint.
- Dark Cloud Cover: a long white bar, then a black bar of at least average size that opens above its close and closes below its midpoint.
- Bullish / Bearish Harami: a long bar, then a small opposite-colour body inside it.
- Morning / Evening Star: a long bar, a small star beyond its body, then a reversal bar closing past the first bar's midpoint.
- Hanging Man: the Hammer shape with the Stochastic (12,3) above 80.
- Shooting Star: small body, long upper shadow, an open at or above the previous high and the Stochastic (12,3) above 80.
- Hammer: small body, long lower shadow, Stochastic oversold, at support. It is printed in yellow as a watch. The signal is the next bar, named "Hammer ✔", when it closes above the Hammer's high.
- Inverted Hammer: a wide bar (at least 1.2 ATR) with an upper shadow of at least 60% of its range, almost no lower shadow, a body no larger than the 10-bar average, and a low within 1 ATR of the prior 20-bar low.
- Optional: "Classic candles: colour and arrow only in context" keeps classic candles grey unless they appear at support / resistance, with the Stochastic stretched and the market index moving the same way.
2. Doji setups
- Oversold Doji Gap-Up / Overbought Doji Gap-Down: an indecision bar at a stretched low (high), then a gap away from it.
- Doji + Bullish / Bearish Engulfing: an indecision bar at support (resistance), then an engulfing candle of at least 0.8 ATR.
- Doji Cluster Breakout: three or more indecision bars in five, packed inside 1.5 ATR after a decline, then a close a quarter ATR above the box with volume.
- Bullish / Bearish Doji Continuation: a strong bar, a pause that holds in its half, then another strong bar in the trend direction.
- Morning Star Continuation: a Morning Star followed within 6 bars by a strong close above everything since the star.
3. Gap and kicker setups
- Bullish / Bearish Kicker: opposite-colour bodies, the second opening at or beyond the first open.
- Bullish / Bearish Doji Gap Kicker: a solid bar, an indecision bar holding beyond its close, then a bar opening past the indecision body and closing beyond it.
4. Price setups
- Rounding Bottom / Top: price spent most of the last 25 bars below (above) EMA 21, EMA 8 has turned, then a thrust bar clears the 10-bar high (low).
- Spring Reversal: a tight 10-bar shelf, a brief break beneath it, then a close back inside that rejects the break.
- Pullback Hook Breakout: a run of at least 5 ATR, a 25-62% pullback, then the first bar closing above the prior high.
- Bullish / Bearish Belt Hold: a long bar (at least 1.5 ATR) opening at its extreme after a stretched move.
- Rising EMA Curve Breakout: EMA 8 rising and accelerating above EMA 21, price riding it, a short dip, then a white close above the 5-bar high.
- EMA 8 Pullback Breakout: an established uptrend, a touch of EMA 8, then a white close above the 3-bar high.
- MA Retest Breakout: a close above SMA 50 or SMA 200, a retest of it within 3-15 bars, then a close above the 5-bar high.
- Bullish Reversal: a confirmed turn from an early-warning bar (✔). A grey dashed stop line is drawn at the low of the warning and confirmation bars and runs until a close below it or for 20 bars.
5. Lower-reliability setups (off by default, "Show low-reliability setups")
- Cup & Handle Breakout: a left rim, a cup at least 4 ATR deep, a right side back near the rim, a handle in the upper part of the cup, then a close above the handle with volume.
- Base Reversal: a large black bar at a stretched low, 3-10 mostly indecisive bars below its open, then a white bar at least 70% of its size closing above the base. Always shown on non-Saudi symbols.
- Bearish Reversal: an early-warning bar at resistance, then a black bar closing below its body with the Stochastic turning down (✔).
- Upthrust Reversal: a Bearish Reversal that rejects a brief break above a tight 10-bar shelf.
- Doji Cluster Breakdown: the mirror of the Doji Cluster Breakout after an advance.
How to use it
Step 1: Choose what to see
In "1 - Groups" turn each family on or off. "Display set" can show both families, setups only, or classic candles only. Changing it hides groups but never moves a pattern.
Step 2: Read the colours
- Green below the bar: bullish. Red above the bar: bearish.
- Yellow dot: early warning only. Wait for the next bar.
- Yellow "Hammer": watch only. "Hammer ✔" on the next bar is the signal.
- Grey "Bullish Reversal": the market index is falling, so treat it as weaker.
- Grey diamond: plain Doji, information only.
Step 3: Read the note
Hover a name to read the pattern, its confirmation and its invalidation. The notes panel shows the latest pattern with symbol, timeframe and date. "Notes language" can be English, العربية (Arabic) or Off.
Step 4: Plan the risk
Every bullish pattern has a clear invalidation level, usually the pattern low. Use it as the stop and size the position from it. For Bullish Reversal the stop line is drawn for you. A pattern is a question, not an answer: a close beyond its invalidation level ends it.
Step 5: Market filter (optional)
In "2c - Early warning & confirmation", "Market index" is empty by default (automatic). Enter any symbol, for example a sector index, to use it instead. Turn the filter off to show every Bullish Reversal in colour.
Step 6: Performance table (optional, off by default)
For each signal on the current chart the table counts how often price moved 1 x ATR in the signal direction before moving 1 x ATR against it, within the chosen number of bars. It describes the past on this chart only.
Step 7: Alerts
Alerts are included for bullish patterns, bearish patterns, confirmed reversals and early warnings. Use "Once per bar close" so alerts match what is drawn.
Step 8: Trade markers (optional, off by default)
"Show BUY / EXIT markers" draws a simple illustrative sequence: BUY on the first bullish signal while flat, EXIT at a stop of 1.5 x ATR below the entry close or on a close below EMA 8. It is a study aid, not a strategy or a backtest.
Repainting
With "Bar close only" on (default), names, marks and lines are drawn only after the bar closes and never change afterwards. The market index is read on the same timeframe with lookahead off, so no future data is used. With the option off, a name can appear and disappear while the current bar is still forming.
Limitations
- Designed for standard candlestick charts. Heikin Ashi, Renko and other synthetic chart types change the prices and give misleading patterns.
- Gap-based setups are most meaningful on instruments that gap, such as stocks on daily charts.
- Volume conditions are skipped on symbols without volume.
- The market filter applies to stocks and funds by default. Forex, crypto and futures have no automatic index; you can enter one manually.
- Moving-average setups need up to 200 bars of history before they can appear.
- No candlestick pattern works on its own. Many are close to a coin flip in isolation; context, confirmation and risk control matter more than the name.
Disclaimer
This script is for education and chart analysis only. It is not financial advice, and past patterns or statistics do not guarantee future results.
ملاحظات الأخبار
v1.1- Practical tip in every note: each pattern note and the notes panel now end with a tip that prints the actual levels for that bar, the close that triggers the pattern and the stop level whose break voids it. When the market index is falling, the tip also suggests a smaller position.
- Arabic notes fixed: English pattern names and terms such as EMA 21 and ATR inside Arabic sentences no longer scramble the word order. Every Arabic line now reads right to left in both the hover note and the panel.
- The Bullish Reversal stop level moved into the tip line.

إخلاء المسؤولية
لا يُقصد بالمعلومات والمنشورات أن تكون، أو تشكل، أي نصيحة مالية أو استثمارية أو تجارية أو أنواع أخرى من النصائح أو التوصيات المقدمة أو المعتمدة من TradingView. اقرأ المزيد في شروط الاستخدام.
إخلاء المسؤولية
لا يُقصد بالمعلومات والمنشورات أن تكون، أو تشكل، أي نصيحة مالية أو استثمارية أو تجارية أو أنواع أخرى من النصائح أو التوصيات المقدمة أو المعتمدة من TradingView. اقرأ المزيد في شروط الاستخدام.