تم تحديثه
Options OI Profile on Futures
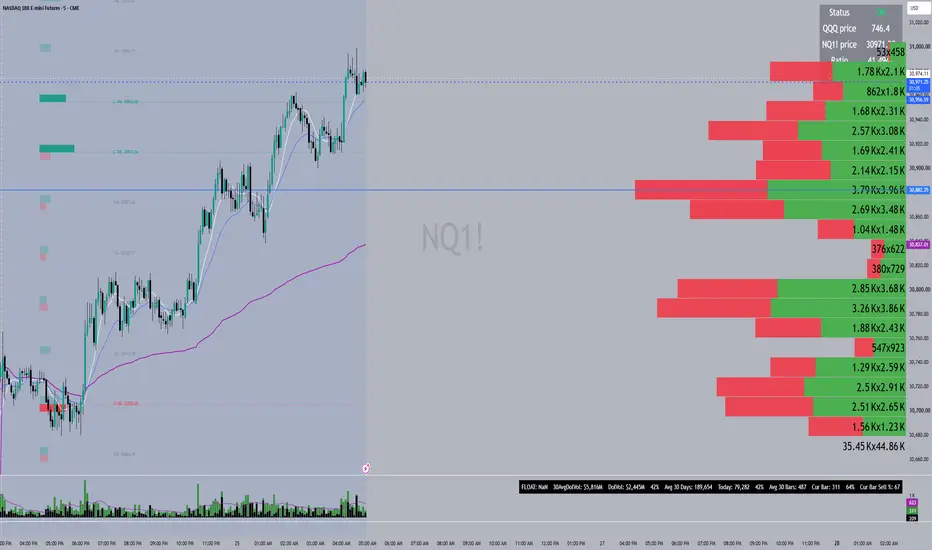
Title: Options OI Profile on Futures (QQQ → NQ, SPY → ES)
Description:
This indicator displays ETF options open interest as a horizontal profile on index futures charts. It converts QQQ strikes to NQ prices and SPY strikes to ES prices, so options positioning can be viewed directly on the futures chart.
What it does
Large clusters of open interest at specific strikes are often watched as potential areas of interest, because market makers may hedge around them. Those strikes are quoted in ETF prices, though, which don't match futures prices. This script converts each strike to its futures equivalent using a live ratio:
Futures level = ETF strike × (futures price ÷ ETF price)
The ratio is recalculated from live prices rather than hardcoded, so levels stay aligned as the futures basis drifts toward expiration and across contract rolls. Outside regular hours, it uses extended-session ETF prices, and it holds the last valid ratio when the ETF isn't trading.
What you see
Call open interest (upper half of each strike) and put open interest (lower half), drawn as horizontal bars sized relative to the largest strike
The strikes with the most call and put open interest, highlighted as "walls" with a dotted level line and a label showing the ETF strike and converted futures price
An optional info panel showing the ETF symbol, current ratio, data date, and status. It appears automatically if something needs attention, such as missing data or levels outside the visible price range.
How to use it
Pine Script cannot download options data, so you supply it. Paste open interest into the OI data input in this format:
strike:callOI:putOI,strike:callOI:putOI,...
Example: 600:25000:60000,605:18000:22000
Open interest is published once per day, so updating the data each morning before the session is enough. Add the indicator once per chart: set the ETF input to QQQ on an NQ chart, or SPY on an ES chart. Test Mode generates sample data around the current price, so you can check the layout before adding real data.
Settings
Data: ETF symbol, OI data, data date, test mode, and an optional manual ratio
Layout: profile position (right of price or left), bar length and thickness, a filter to hide small strikes, and a redraw sensitivity setting
Walls: number of highlighted walls, line length, and labels on or off
Style: colors and info panel visibility
Performance
Drawings update on each new bar, or when levels drift beyond a set number of points, not on every tick. This keeps the chart responsive.
Limitations
Levels are only as current as the open interest data you paste in. Intraday changes in options positioning are not reflected.
The conversion assumes the ETF and futures track each other closely, which is generally true for QQQ/NQ and SPY/ES but can diverge around dividends and during fast markets.
For an accurate live ratio, both symbols need real-time data. Delayed futures data will skew the conversion.
This script shows positioning only. It does not show order book depth or resting liquidity.
This indicator is a visualization tool for analysis and education. It does not generate trade signals and is not financial advice.
Before you publish:
Clean chart: TradingView requires the publishing chart to show only this indicator, so remove your other studies first. Load real OI data, or turn on test mode, so the screenshot shows the profile.
Open or protected: choose Open source if you're fine with others seeing the code; TradingView favors open-source scripts in public listings. Choose Protected if you want to keep the code private.
Moderator review: the manual data input may get questions. The description explains why it's necessary, which is what moderators look for.
Description:
This indicator displays ETF options open interest as a horizontal profile on index futures charts. It converts QQQ strikes to NQ prices and SPY strikes to ES prices, so options positioning can be viewed directly on the futures chart.
What it does
Large clusters of open interest at specific strikes are often watched as potential areas of interest, because market makers may hedge around them. Those strikes are quoted in ETF prices, though, which don't match futures prices. This script converts each strike to its futures equivalent using a live ratio:
Futures level = ETF strike × (futures price ÷ ETF price)
The ratio is recalculated from live prices rather than hardcoded, so levels stay aligned as the futures basis drifts toward expiration and across contract rolls. Outside regular hours, it uses extended-session ETF prices, and it holds the last valid ratio when the ETF isn't trading.
What you see
Call open interest (upper half of each strike) and put open interest (lower half), drawn as horizontal bars sized relative to the largest strike
The strikes with the most call and put open interest, highlighted as "walls" with a dotted level line and a label showing the ETF strike and converted futures price
An optional info panel showing the ETF symbol, current ratio, data date, and status. It appears automatically if something needs attention, such as missing data or levels outside the visible price range.
How to use it
Pine Script cannot download options data, so you supply it. Paste open interest into the OI data input in this format:
strike:callOI:putOI,strike:callOI:putOI,...
Example: 600:25000:60000,605:18000:22000
Open interest is published once per day, so updating the data each morning before the session is enough. Add the indicator once per chart: set the ETF input to QQQ on an NQ chart, or SPY on an ES chart. Test Mode generates sample data around the current price, so you can check the layout before adding real data.
Settings
Data: ETF symbol, OI data, data date, test mode, and an optional manual ratio
Layout: profile position (right of price or left), bar length and thickness, a filter to hide small strikes, and a redraw sensitivity setting
Walls: number of highlighted walls, line length, and labels on or off
Style: colors and info panel visibility
Performance
Drawings update on each new bar, or when levels drift beyond a set number of points, not on every tick. This keeps the chart responsive.
Limitations
Levels are only as current as the open interest data you paste in. Intraday changes in options positioning are not reflected.
The conversion assumes the ETF and futures track each other closely, which is generally true for QQQ/NQ and SPY/ES but can diverge around dividends and during fast markets.
For an accurate live ratio, both symbols need real-time data. Delayed futures data will skew the conversion.
This script shows positioning only. It does not show order book depth or resting liquidity.
This indicator is a visualization tool for analysis and education. It does not generate trade signals and is not financial advice.
Before you publish:
Clean chart: TradingView requires the publishing chart to show only this indicator, so remove your other studies first. Load real OI data, or turn on test mode, so the screenshot shows the profile.
Open or protected: choose Open source if you're fine with others seeing the code; TradingView favors open-source scripts in public listings. Choose Protected if you want to keep the code private.
Moderator review: the manual data input may get questions. The description explains why it's necessary, which is what moderators look for.
ملاحظات الأخبار
small update
إخلاء المسؤولية
لا يُقصد بالمعلومات والمنشورات أن تكون، أو تشكل، أي نصيحة مالية أو استثمارية أو تجارية أو أنواع أخرى من النصائح أو التوصيات المقدمة أو المعتمدة من TradingView. اقرأ المزيد في شروط الاستخدام.
إخلاء المسؤولية
لا يُقصد بالمعلومات والمنشورات أن تكون، أو تشكل، أي نصيحة مالية أو استثمارية أو تجارية أو أنواع أخرى من النصائح أو التوصيات المقدمة أو المعتمدة من TradingView. اقرأ المزيد في شروط الاستخدام.