Predictive Gann Spider V3.2 [Multiplier FIX]
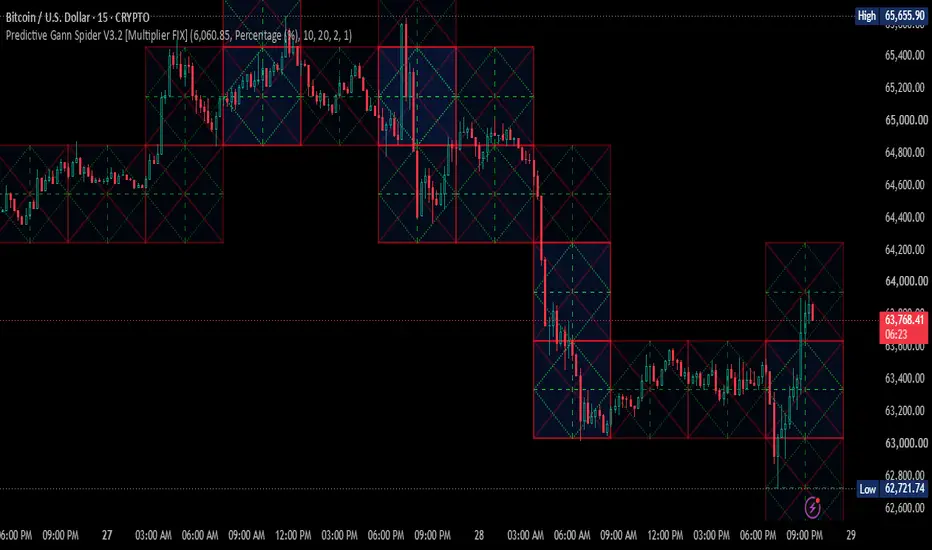
Predictive Gann Spider V3.2 [Multiplier FIX] - Complete Guide
>> "Why is it called "Predictive"?
Most traditional indicators (like Moving Averages, RSI, or MACD) are lagging—they react to price action that has already happened. The Predictive Gann Spider, however, is a leading (forward-looking) tool.
Here is why it earns the name "Predictive":
Future Projection: By anchoring to a single historical High or Low, the indicator's mathematical engine projects the geometric grid (the boxes and angles) far into the future, mapping out empty space on the right side of your chart.
Pre-Defined Zones: It plots exact support levels, resistance barriers, and crucial time/price intersections before the market actually reaches them.
The Roadmap: Instead of chasing the price, you are waiting for the price to arrive at pre-calculated, highly sensitive zones. It acts as a predictive roadmap, telling you exactly where the market is likely to pause, bounce, or reverse next.
Overview
The Predictive Gann Spider V3.2 is an advanced technical indicator rooted in W.D. Gann’s legendary "Price and Time Squaring" theories. By generating a geometric "Spider Web" of boxes and diagonal angles on your chart, it projects dynamic support, resistance, and potential market reversal zones.
To get the most out of this tool, it is crucial to understand how to configure its settings. Below is a detailed breakdown of the indicator's input parameters.
Settings Breakdown & Configuration
1. Anchor Settings (Start Point)
In Gann theory, all calculations must begin from a significant market extreme (a major swing high or swing low). This section locks in that starting coordinate.
Anchor Date & Time: Defines the exact historical moment the swing occurred (e.g., 2026-01-05 09:15).
Anchor Price Level: The exact price of that swing high/low (e.g., 6060.85).
Is this a Bottom Anchor? (Uncheck for Top):
Checked: Tells the indicator that the anchor is a major Low. The grid will project upwards to track a bullish structure.
Unchecked: Tells the indicator the anchor is a major High, projecting the grid downwards for a bearish structure.
2. Dynamic Multiplier & Time Engine
This is the core mathematical engine that determines the size and scale of your Gann grid. It dictates how price and time are "squared."
Scaling Method: Allows you to choose how the grid size is calculated. In the current setup, it is set to Fixed Points.
Scale Value (Points / % / ATR Multiplier): Currently set to 1000. Because the scaling method is set to Fixed Points, this means every single red square (Gann Box) on the chart represents exactly a 1000-point range. If price breaks out of a 1000-point box, it is expected to migrate to the next box.
3. Styling & Aesthetics
Main Line Thickness (1-4): Adjusts the boldness of the primary Gann Box borders (currently set to 2).
Box Background Color: Allows you to fill the boxes with color for better visual distinction, though keeping it transparent often keeps the chart cleaner.
4. Deep Spider Web (Internal Angles)
This section controls the inner diagonal lines that create the "Spider Web" effect within each Gann Box.
Show Internal Sub-Divisions (Angles): When checked, it reveals the critical Gann Angles inside the boxes. These diagonal lines act as dynamic support and resistance. Intersections of these lines often pinpoint highly volatile time/price zones.
Sub-Line Color & Thickness: Customizes the internal web lines (currently set to green, thickness 1) to differentiate them from the main box borders.
5. Visual Stealth Control
Stealth Mode (Hide Past Boxes): A fantastic quality-of-life feature. When checked, it hides all historical Gann boxes that price has already moved past, keeping your current chart completely clutter-free and focused only on active price action.
> How to Trade with the Gann Spider
The Box Step: Treat the red boxes as primary zones. If the price is inside a box, the upper boundary is resistance and the lower boundary is support. A strong candle close outside the box signals a breakout toward the next zone.
Midpoint Magnet: The horizontal dotted lines represent the 50% retracement of each box. In Gann theory, the 50% level is the most important natural support/resistance.
Angle Bounces: Watch how price reacts when it touches the internal green diagonal lines. Look for reversal candlestick patterns (like Pin Bars or Engulfing candles) at these diagonal intersections for high-probability trade entries.
Disclaimer: This indicator is for educational and analytical purposes only. Technical analysis tools are not infallible. Always combine Gann theory with proper risk management, stop losses, and your own due diligence before entering live trades.
>> "Why is it called "Predictive"?
Most traditional indicators (like Moving Averages, RSI, or MACD) are lagging—they react to price action that has already happened. The Predictive Gann Spider, however, is a leading (forward-looking) tool.
Here is why it earns the name "Predictive":
Future Projection: By anchoring to a single historical High or Low, the indicator's mathematical engine projects the geometric grid (the boxes and angles) far into the future, mapping out empty space on the right side of your chart.
Pre-Defined Zones: It plots exact support levels, resistance barriers, and crucial time/price intersections before the market actually reaches them.
The Roadmap: Instead of chasing the price, you are waiting for the price to arrive at pre-calculated, highly sensitive zones. It acts as a predictive roadmap, telling you exactly where the market is likely to pause, bounce, or reverse next.
Overview
The Predictive Gann Spider V3.2 is an advanced technical indicator rooted in W.D. Gann’s legendary "Price and Time Squaring" theories. By generating a geometric "Spider Web" of boxes and diagonal angles on your chart, it projects dynamic support, resistance, and potential market reversal zones.
To get the most out of this tool, it is crucial to understand how to configure its settings. Below is a detailed breakdown of the indicator's input parameters.
Settings Breakdown & Configuration
1. Anchor Settings (Start Point)
In Gann theory, all calculations must begin from a significant market extreme (a major swing high or swing low). This section locks in that starting coordinate.
Anchor Date & Time: Defines the exact historical moment the swing occurred (e.g., 2026-01-05 09:15).
Anchor Price Level: The exact price of that swing high/low (e.g., 6060.85).
Is this a Bottom Anchor? (Uncheck for Top):
Checked: Tells the indicator that the anchor is a major Low. The grid will project upwards to track a bullish structure.
Unchecked: Tells the indicator the anchor is a major High, projecting the grid downwards for a bearish structure.
2. Dynamic Multiplier & Time Engine
This is the core mathematical engine that determines the size and scale of your Gann grid. It dictates how price and time are "squared."
Scaling Method: Allows you to choose how the grid size is calculated. In the current setup, it is set to Fixed Points.
Scale Value (Points / % / ATR Multiplier): Currently set to 1000. Because the scaling method is set to Fixed Points, this means every single red square (Gann Box) on the chart represents exactly a 1000-point range. If price breaks out of a 1000-point box, it is expected to migrate to the next box.
3. Styling & Aesthetics
Main Line Thickness (1-4): Adjusts the boldness of the primary Gann Box borders (currently set to 2).
Box Background Color: Allows you to fill the boxes with color for better visual distinction, though keeping it transparent often keeps the chart cleaner.
4. Deep Spider Web (Internal Angles)
This section controls the inner diagonal lines that create the "Spider Web" effect within each Gann Box.
Show Internal Sub-Divisions (Angles): When checked, it reveals the critical Gann Angles inside the boxes. These diagonal lines act as dynamic support and resistance. Intersections of these lines often pinpoint highly volatile time/price zones.
Sub-Line Color & Thickness: Customizes the internal web lines (currently set to green, thickness 1) to differentiate them from the main box borders.
5. Visual Stealth Control
Stealth Mode (Hide Past Boxes): A fantastic quality-of-life feature. When checked, it hides all historical Gann boxes that price has already moved past, keeping your current chart completely clutter-free and focused only on active price action.
> How to Trade with the Gann Spider
The Box Step: Treat the red boxes as primary zones. If the price is inside a box, the upper boundary is resistance and the lower boundary is support. A strong candle close outside the box signals a breakout toward the next zone.
Midpoint Magnet: The horizontal dotted lines represent the 50% retracement of each box. In Gann theory, the 50% level is the most important natural support/resistance.
Angle Bounces: Watch how price reacts when it touches the internal green diagonal lines. Look for reversal candlestick patterns (like Pin Bars or Engulfing candles) at these diagonal intersections for high-probability trade entries.
Disclaimer: This indicator is for educational and analytical purposes only. Technical analysis tools are not infallible. Always combine Gann theory with proper risk management, stop losses, and your own due diligence before entering live trades.

إخلاء المسؤولية
لا يُقصد بالمعلومات والمنشورات أن تكون، أو تشكل، أي نصيحة مالية أو استثمارية أو تجارية أو أنواع أخرى من النصائح أو التوصيات المقدمة أو المعتمدة من TradingView. اقرأ المزيد في شروط الاستخدام.
إخلاء المسؤولية
لا يُقصد بالمعلومات والمنشورات أن تكون، أو تشكل، أي نصيحة مالية أو استثمارية أو تجارية أو أنواع أخرى من النصائح أو التوصيات المقدمة أو المعتمدة من TradingView. اقرأ المزيد في شروط الاستخدام.