OPEN-SOURCE SCRIPT
تم تحديثه Gap Fill Probability for SPY SPX XSP
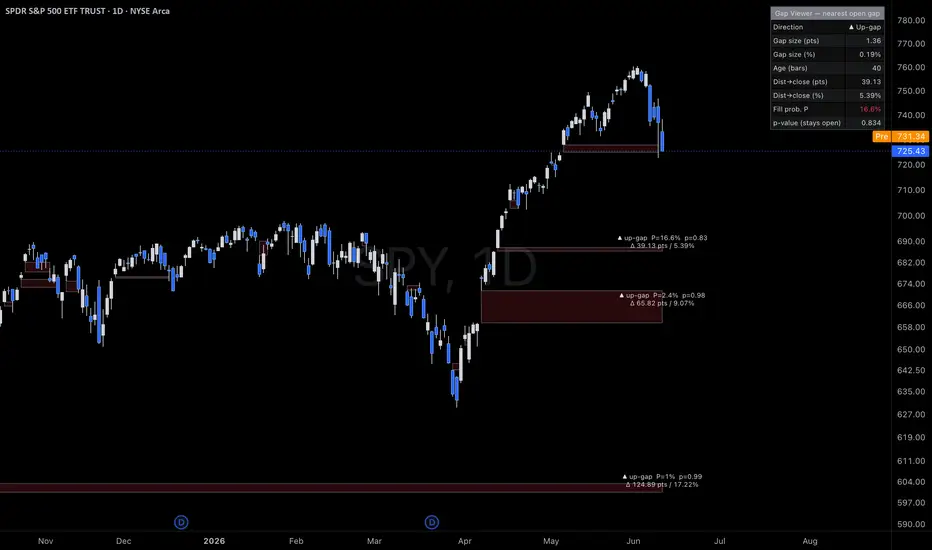
Gap Fill Probability Viewer - open gaps with an adaptive fill probability
Gap Fill Probability Viewer automatically finds price gaps on your chart and draws each one as a colored zone - no more drawing rectangles by hand. It then tells you how likely each open gap is to "fill," and exactly how far price has to travel to close it.
What it shows
How the probability works
The estimate adapts to three things research associates with gap fills:
- Size - bigger gaps are harder to fill.
- Distance - the closer price is to the gap, the higher the odds.
- Recency - fresh gaps fill faster; old, stubborn gaps lose momentum.
Handy options
- Auto-hide, fade, or keep gaps once they fill.
- Filter out tiny gaps by % or ATR.
- Detect gaps on wicks or candle bodies.
- Fully tunable probability model and colors.
⚠️ The fill probability is a heuristic estimate for study and education — not a guarantee or financial advice. Calibrate the settings to your own market and timeframe.
Gap Fill Probability Viewer automatically finds price gaps on your chart and draws each one as a colored zone - no more drawing rectangles by hand. It then tells you how likely each open gap is to "fill," and exactly how far price has to travel to close it.
What it shows
- Gap zones - every gap-up and gap-down, drawn as a box that extends to the current bar.
- Fill probability (P) - an estimate of how likely the gap is to close, shown as a % and color-coded (green = likely, orange = uncertain, red = unlikely).
- p-value - the flip side of P: the chance the gap stays open.
- Distance to close - how far the current price is from fully closing the gap, in both points and % of the charted symbol.
- Stats table - a clean summary for the gap closest to filling.
How the probability works
The estimate adapts to three things research associates with gap fills:
- Size - bigger gaps are harder to fill.
- Distance - the closer price is to the gap, the higher the odds.
- Recency - fresh gaps fill faster; old, stubborn gaps lose momentum.
Handy options
- Auto-hide, fade, or keep gaps once they fill.
- Filter out tiny gaps by % or ATR.
- Detect gaps on wicks or candle bodies.
- Fully tunable probability model and colors.
⚠️ The fill probability is a heuristic estimate for study and education — not a guarantee or financial advice. Calibrate the settings to your own market and timeframe.
ملاحظات الأخبار
Renamed, Chart updatedنص برمجي مفتوح المصدر
بروح TradingView الحقيقية، قام مبتكر هذا النص البرمجي بجعله مفتوح المصدر، بحيث يمكن للمتداولين مراجعة وظائفه والتحقق منها. شكرا للمؤلف! بينما يمكنك استخدامه مجانًا، تذكر أن إعادة نشر الكود يخضع لقواعد الموقع الخاصة بنا.

إخلاء المسؤولية
لا يُقصد بالمعلومات والمنشورات أن تكون، أو تشكل، أي نصيحة مالية أو استثمارية أو تجارية أو أنواع أخرى من النصائح أو التوصيات المقدمة أو المعتمدة من TradingView. اقرأ المزيد في شروط الاستخدام.
نص برمجي مفتوح المصدر
بروح TradingView الحقيقية، قام مبتكر هذا النص البرمجي بجعله مفتوح المصدر، بحيث يمكن للمتداولين مراجعة وظائفه والتحقق منها. شكرا للمؤلف! بينما يمكنك استخدامه مجانًا، تذكر أن إعادة نشر الكود يخضع لقواعد الموقع الخاصة بنا.
إخلاء المسؤولية
لا يُقصد بالمعلومات والمنشورات أن تكون، أو تشكل، أي نصيحة مالية أو استثمارية أو تجارية أو أنواع أخرى من النصائح أو التوصيات المقدمة أو المعتمدة من TradingView. اقرأ المزيد في شروط الاستخدام.