تم تحديثه
Liquidity Sweep Reversal | M. Bedaiwi
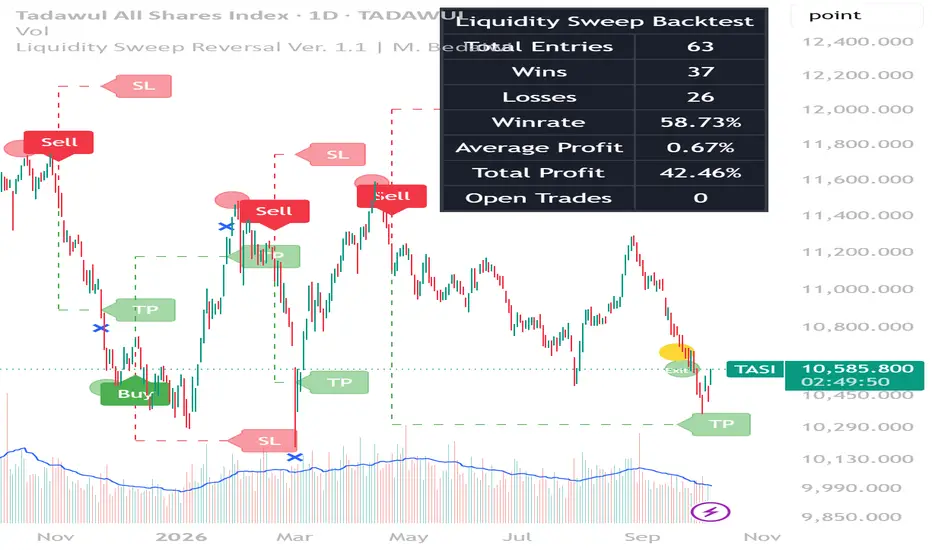
Liquidity Sweep Reversal | M. Bedaiwi
Overview
Liquidity Sweep Reversal is a price-action indicator designed to identify potential market reversals following liquidity sweeps above previous highs or below previous lows.
The indicator monitors a higher-period liquidity range. When price moves beyond one side of that range, it waits for a subsequent Market Structure Shift (MSS) before generating a potential Buy or Sell signal.
A liquidity sweep alone does not generate an entry. Market structure confirmation is an essential part of the setup.
How It Works
• A sweep below the previous liquidity low prepares a potential long setup.
• A sweep above the previous liquidity high prepares a potential short setup.
• Entry confirmation is based on a Market Structure Shift using the selected MSS Swing Length.
• Liquidity sweeps can be detected using candle wicks or closing prices.
• Classic and Adaptive entry methods are available.
• If the selected Higher Timeframe is equal to or lower than the chart timeframe, the indicator automatically uses a reference period equivalent to four chart bars.
The indicator calculates a rolling liquidity range on the current chart equivalent to the selected reference period. It does not request independent higher-timeframe candles through `request.security()`.
Features
• Liquidity sweep detection
• Market structure confirmation
• Potential long and short signals
• Classic and Adaptive entry methods
• Higher-timeframe safety handling
• Automatic four-bar fallback
• Fixed or ATR-based TP/SL levels
• Entry, take-profit and stop-loss alerts
• Optional liquidity zones and sweep markers
• Historical performance dashboard
• Pine Script v6 compatibility
How to Use
1. Select the Chart Timeframe
Choose the chart timeframe according to your trading style:
• 5–15 minutes: Intraday trading
• 1–4 hours: Short-term or swing trading
• Daily: Medium-term trading
Standard candlestick charts are recommended.
2. Select the Higher Timeframe
The Higher Timeframe setting defines the reference period used to calculate liquidity highs and lows.
Suggested combinations:
• 5-minute chart → 30 or 60 minutes
• 15-minute chart → 60 or 240 minutes
• 1-hour chart → 4 hours
• 4-hour chart → Daily
• Daily chart → Weekly
The selected Higher Timeframe should normally be higher than the chart timeframe.
If it is equal to or lower than the chart timeframe, the indicator automatically uses a period equivalent to four chart bars. The liquidity label displays “Auto x4” when this fallback is active.
3. Configure Liquidity Sweep Detection
Breakout Method provides two options:
Wick
Detects a sweep when the candle wick crosses the liquidity level.
• Earlier detection
• More frequent signals
• Greater sensitivity to temporary price spikes
Close
Requires the candle to close beyond the liquidity level.
• Stronger confirmation
• Fewer signals
• Filters some wick-only sweeps
4. Configure Market Structure Confirmation
MSS Swing Length controls the number of candles used to calculate the swing high and swing low for Market Structure Shift confirmation.
• Lower values generate faster and more frequent signals.
• Higher values generate slower and more selective signals.
The default value is 10. A range between 5 and 15 may be used as a starting point, depending on the asset and timeframe.
5. Select the Entry Method
Classic
Uses the traditional reversal approach:
• A sweep below the previous liquidity low prepares a potential long setup.
• A sweep above the previous liquidity high prepares a potential short setup.
Classic mode is generally easier to understand and evaluate.
Adaptive
Uses the indicator’s internal historical behavior to adjust the potential trade direction.
Depending on its internal long and short performance counters, Adaptive mode may occasionally select a continuation direction instead of the traditional reversal direction.
Adaptive mode is experimental, and its behavior may vary between assets and timeframes.
6. Interpret the Signals
Potential Long Setup
• Price sweeps below the previous liquidity low.
• The indicator detects a bullish Market Structure Shift on a later candle.
• A Buy label appears after confirmation.
• Entry, take-profit and stop-loss levels are calculated.
Potential Short Setup
• Price sweeps above the previous liquidity high.
• The indicator detects a bearish Market Structure Shift on a later candle.
• A Sell label appears after confirmation.
• Entry, take-profit and stop-loss levels are calculated.
Liquidity sweep markers show where price crossed a previous liquidity level. Do not enter solely because a sweep marker appears. Wait for the subsequent structure confirmation and Buy or Sell label.
7. Configure Take Profit and Stop Loss
The indicator provides two TP/SL calculation methods:
Dynamic Method
Uses:
• A five-bar ATR
• The selected Risk setting
• The MSS swing high or low
• An internal reward-to-risk multiplier of approximately 0.9
For long trades, the stop-loss is placed below the MSS swing low with an additional ATR-based distance. The target is calculated above the entry using the entry-to-stop distance.
For short trades, the stop-loss is placed above the MSS swing high with an additional ATR-based distance. The target is calculated below the entry using the entry-to-stop distance.
Fixed Method
Uses user-defined percentages from the entry price.
Default values:
• Take Profit: 0.3%
• Stop Loss: 0.4%
These values should be adjusted according to the asset’s volatility and the selected timeframe.
Risk Setting
The Risk setting controls the ATR multiplier used to determine the Dynamic stop-loss distance:
• Highest: 10
• High: 6.5
• Normal: 5.5
• Low: 3.5
• Lowest: 1.15
This setting controls the distance of the stop-loss. It does not calculate position size or the monetary amount at risk.
A wider stop-loss should normally be combined with a smaller position size.
8. Select the TP/SL Layout
Default
Displays dashed lines with TP and SL labels.
Alternative
Displays take-profit and stop-loss areas as colored boxes.
This setting changes only the visual layout and does not change the calculated prices.
9. Enable Visual Elements
• Show Liquidity Zones: Displays the reference liquidity areas.
• Liq Grabs: Displays detected liquidity sweep markers.
• TP / SL: Displays entry, take-profit and stop-loss levels.
• Buy and Sell Colors: Controls the signal and zone colors.
• Text Color: Controls the color of labels and displayed values.
10. Create Alerts
Alerts are available for:
• Buy Signal
• Sell Signal
• Take-Profit Signal
• Stop-Loss Signal
To create an alert:
1. Open TradingView’s alert menu.
2. Select Liquidity Sweep Reversal.
3. Choose the required alert condition.
4. Select the notification method.
5. Consider using “Once Per Bar Close” to reduce intrabar signals.
6. Apply Practical Confirmation
For more selective setups, consider confirming signals with:
• Higher-timeframe trend direction
• Support and resistance levels
• Trading volume
• Market session and available liquidity
• Supply and demand zones
• Candle-close confirmation
Always review the displayed entry, target and stop-loss levels before taking a trade. Calculate position size independently according to the stop-loss distance.
Example Starting Configuration
For a 15-minute chart:
• Higher Timeframe: 60 minutes
• MSS Swing Length: 10
• Breakout Method: Close
• Entry Method: Classic
• TP / SL Method: Dynamic
• Risk: Low
These settings are only a starting point and are not universally optimal.
Historical Dashboard
The Liquidity Sweep Backtest dashboard displays:
• Total Entries
• Wins
• Losses
• Win Rate
• Average Profit
• Total Profit
The dashboard is intended for approximate comparison between settings. The script is an indicator, not a strategy, and the dashboard is not equivalent to TradingView’s Strategy Tester.
The calculations do not include:
• Brokerage commissions
• Slippage
• Bid-ask spread
• Position sizing
• Price gaps
• Actual order execution
• Taxes or financing costs
Historical results do not guarantee future performance.
Practical Limitations
The indicator may be less effective during:
• Strong one-directional trends
• Low-liquidity market conditions
• Major news releases
• Large price gaps
• Narrow or random consolidation
• Highly volatile intrabar movement
• Non-standard chart types
• Poorly matched timeframe settings
The indicator processes approximately the most recent 4,900 bars to maintain performance. Results may change when the symbol, timeframe or settings are changed.
Attribution and Modifications
Original open-source code by fluxchart.
Modified by Mohammed Bedaiwi (mbedaiwi2).
Modifications include:
• Conversion to Pine Script v6
• Safer higher-timeframe handling
• Automatic four-bar fallback when the selected timeframe is not higher than the chart timeframe
• Dashboard calculation safeguards
• Independent indicator naming and presentation
The modified source code remains available under the Mozilla Public License 2.0.
Important Notice
This indicator is provided for educational and analytical purposes only. It does not constitute financial advice, an investment recommendation or a guarantee of profitable results.
Trading and investing involve substantial risk. Users should perform independent analysis, apply appropriate position sizing and risk management, and avoid risking funds they cannot afford to lose.
────────────────────────────
الوصف العربي
نظرة عامة
مؤشر Liquidity Sweep Reversal هو مؤشر لتحليل حركة السعر، صُمم لاكتشاف فرص الانعكاس المحتملة بعد سحب السيولة أعلى القمم السابقة أو أسفل القيعان السابقة.
يراقب المؤشر نطاقًا مرجعيًا للسيولة. عندما يتحرك السعر خارج أحد طرفي هذا النطاق، ينتظر المؤشر تغيرًا لاحقًا في هيكل السوق قبل إصدار إشارة شراء أو بيع محتملة.
لا يؤدي سحب السيولة وحده إلى إصدار إشارة دخول، بل يجب ظهور تأكيد لاحق من هيكل السوق.
طريقة العمل
• سحب السيولة أسفل القاع السابق يجهز فرصة شراء محتملة.
• سحب السيولة أعلى القمة السابقة يجهز فرصة بيع محتملة.
• يتم تأكيد الدخول بواسطة تغير هيكل السوق وفق إعداد MSS Swing Length.
• يمكن اكتشاف سحب السيولة بواسطة ظلال الشموع أو أسعار الإغلاق.
• يتوفر أسلوبا دخول Classic وAdaptive.
• إذا كان الإطار المرجعي مساويًا أو أقل من إطار الرسم، يستخدم المؤشر تلقائيًا فترة تعادل أربع شمعات.
الميزات
• اكتشاف سحب السيولة
• تأكيد تغير هيكل السوق
• إشارات شراء وبيع محتملة
• أسلوبا دخول Classic وAdaptive
• معالجة آمنة للإطار الزمني
• أهداف ووقف خسارة ثابتة أو مبنية على ATR
• تنبيهات الشراء والبيع والهدف ووقف الخسارة
• مناطق سيولة وعلامات سحب اختيارية
• لوحة نتائج تاريخية
• التوافق مع Pine Script v6
طريقة الاستخدام
1. اختر إطار الرسم
• 5–15 دقيقة: للتداول اليومي
• ساعة إلى 4 ساعات: للتداول قصير أو متوسط الأجل
• يومي: للتداول متوسط الأجل
يفضل استخدام رسم الشموع العادي.
2. اختر الإطار المرجعي الأعلى
إعدادات مقترحة:
• رسم 5 دقائق ← 30 أو 60 دقيقة
• رسم 15 دقيقة ← 60 أو 240 دقيقة
• رسم ساعة ← 4 ساعات
• رسم 4 ساعات ← يومي
• رسم يومي ← أسبوعي
إذا كان الإطار المختار مساويًا أو أقل من إطار الرسم، يستخدم المؤشر فترة تلقائية تعادل أربع شمعات، وتظهر عبارة `Auto x4`.
3. اختر طريقة اكتشاف سحب السيولة
Wick
يعتمد على اختراق ظل الشمعة:
• اكتشاف أسرع
• إشارات أكثر
• حساسية أعلى للحركات اللحظية
Close
يشترط إغلاق الشمعة بعد مستوى السيولة:
• تأكيد أقوى
• إشارات أقل
• تصفية بعض اختراقات الظلال
4. اضبط MSS Swing Length
يحدد عدد الشمعات المستخدمة لتأكيد تغير هيكل السوق.
• القيمة المنخفضة تعطي إشارات أسرع وأكثر عددًا.
• القيمة المرتفعة تعطي إشارات أقل وأكثر انتقائية.
القيمة الافتراضية هي 10، ويمكن البدء بنطاق بين 5 و15.
5. اختر أسلوب الدخول
Classic
• سحب سيولة القاع يؤدي إلى البحث عن شراء.
• سحب سيولة القمة يؤدي إلى البحث عن بيع.
Adaptive
يستخدم السلوك التاريخي الداخلي للمؤشر لتعديل اتجاه الصفقة المحتمل، وقد يختار أحيانًا اتجاهًا استمراريًا بدل الانعكاس التقليدي.
يفضل البدء بوضع Classic لأنه أسهل في الفهم والتقييم.
6. قراءة الإشارات
إشارة شراء محتملة:
• يسحب السعر السيولة أسفل القاع السابق.
• يظهر تغير صاعد في هيكل السوق على شمعة لاحقة.
• تظهر علامة Buy.
• يتم حساب الدخول والهدف ووقف الخسارة.
إشارة بيع محتملة:
• يسحب السعر السيولة أعلى القمة السابقة.
• يظهر تغير هابط في هيكل السوق على شمعة لاحقة.
• تظهر علامة Sell.
• يتم حساب الدخول والهدف ووقف الخسارة.
لا تدخل اعتمادًا على علامة سحب السيولة وحدها، بل انتظر تأكيد هيكل السوق وظهور Buy أو Sell.
7. إعداد الهدف ووقف الخسارة
Dynamic
يستخدم:
• ATR بطول خمس شمعات
• مستوى Risk المختار
• قمة أو قاع MSS
• نسبة عائد إلى مخاطرة داخلية تقارب 0.9
Fixed
يستخدم نسبًا ثابتة من سعر الدخول.
القيم الافتراضية:
• الهدف: 0.3%
• وقف الخسارة: 0.4%
يجب تعديل هذه القيم وفق تذبذب الأصل والإطار الزمني.
إعداد Risk يتحكم في المسافة بين الدخول ووقف الخسارة، ولا يحسب حجم الصفقة أو المبلغ المالي المعرض للخسارة.
8. العناصر المرئية
• Show Liquidity Zones: إظهار مناطق السيولة
• Liq Grabs: إظهار علامات سحب السيولة
• TP / SL: إظهار الدخول والهدف ووقف الخسارة
• Default Layout: عرض المستويات على شكل خطوط
• Alternative Layout: عرض المستويات على شكل مناطق ملونة
9. التنبيهات
يدعم المؤشر تنبيهات:
• الشراء
• البيع
• الوصول إلى الهدف
• الوصول إلى وقف الخسارة
يفضل ضبط التنبيه على مرة واحدة عند إغلاق الشمعة لتقليل الإشارات اللحظية.
10. التأكيد العملي
يمكن تحسين انتقائية الإشارات باستخدام:
• اتجاه الإطار الزمني الأعلى
• الدعم والمقاومة
• حجم التداول
• جلسة السوق والسيولة
• مناطق العرض والطلب
• تأكيد إغلاق الشمعة
يجب مراجعة الهدف ووقف الخسارة وحساب حجم الصفقة بصورة مستقلة قبل الدخول.
لوحة النتائج التاريخية
تعرض لوحة Liquidity Sweep Backtest:
• إجمالي الصفقات
• الصفقات الرابحة
• الصفقات الخاسرة
• نسبة النجاح
• متوسط النتيجة
• إجمالي النتيجة
اللوحة مخصصة للمقارنة التقريبية بين الإعدادات. السكريبت مؤشر وليس استراتيجية، ولذلك لا تعادل اللوحة Strategy Tester في TradingView.
لا تتضمن النتائج العمولات أو الانزلاق السعري أو فرق العرض والطلب أو حجم الصفقة أو إمكانية التنفيذ الفعلي.
حقوق الكود والتعديلات
الكود الأصلي مفتوح المصدر من تطوير fluxchart.
تم تعديله بواسطة Mohammed Bedaiwi (mbedaiwi2).
تشمل التعديلات:
• التحويل إلى Pine Script v6
• تحسين معالجة الإطار الزمني
• استخدام فترة تلقائية تعادل أربع شمعات عند الحاجة
• حماية حسابات لوحة النتائج
• تغيير اسم وهوية المؤشر بصورة مستقلة
يظل الكود المعدل خاضعًا لترخيص Mozilla Public License 2.0.
إخلاء المسؤولية
هذا المؤشر أداة تعليمية وتحليلية فقط، ولا يمثل توصية مالية أو ضمانًا للربح.
ينطوي التداول والاستثمار على مخاطر. يجب على المستخدم إجراء تحليله المستقل، واستخدام حجم صفقة مناسب، وتطبيق إدارة المخاطر وعدم المخاطرة بأموال لا يستطيع تحمل خسارتها.
Overview
Liquidity Sweep Reversal is a price-action indicator designed to identify potential market reversals following liquidity sweeps above previous highs or below previous lows.
The indicator monitors a higher-period liquidity range. When price moves beyond one side of that range, it waits for a subsequent Market Structure Shift (MSS) before generating a potential Buy or Sell signal.
A liquidity sweep alone does not generate an entry. Market structure confirmation is an essential part of the setup.
How It Works
• A sweep below the previous liquidity low prepares a potential long setup.
• A sweep above the previous liquidity high prepares a potential short setup.
• Entry confirmation is based on a Market Structure Shift using the selected MSS Swing Length.
• Liquidity sweeps can be detected using candle wicks or closing prices.
• Classic and Adaptive entry methods are available.
• If the selected Higher Timeframe is equal to or lower than the chart timeframe, the indicator automatically uses a reference period equivalent to four chart bars.
The indicator calculates a rolling liquidity range on the current chart equivalent to the selected reference period. It does not request independent higher-timeframe candles through `request.security()`.
Features
• Liquidity sweep detection
• Market structure confirmation
• Potential long and short signals
• Classic and Adaptive entry methods
• Higher-timeframe safety handling
• Automatic four-bar fallback
• Fixed or ATR-based TP/SL levels
• Entry, take-profit and stop-loss alerts
• Optional liquidity zones and sweep markers
• Historical performance dashboard
• Pine Script v6 compatibility
How to Use
1. Select the Chart Timeframe
Choose the chart timeframe according to your trading style:
• 5–15 minutes: Intraday trading
• 1–4 hours: Short-term or swing trading
• Daily: Medium-term trading
Standard candlestick charts are recommended.
2. Select the Higher Timeframe
The Higher Timeframe setting defines the reference period used to calculate liquidity highs and lows.
Suggested combinations:
• 5-minute chart → 30 or 60 minutes
• 15-minute chart → 60 or 240 minutes
• 1-hour chart → 4 hours
• 4-hour chart → Daily
• Daily chart → Weekly
The selected Higher Timeframe should normally be higher than the chart timeframe.
If it is equal to or lower than the chart timeframe, the indicator automatically uses a period equivalent to four chart bars. The liquidity label displays “Auto x4” when this fallback is active.
3. Configure Liquidity Sweep Detection
Breakout Method provides two options:
Wick
Detects a sweep when the candle wick crosses the liquidity level.
• Earlier detection
• More frequent signals
• Greater sensitivity to temporary price spikes
Close
Requires the candle to close beyond the liquidity level.
• Stronger confirmation
• Fewer signals
• Filters some wick-only sweeps
4. Configure Market Structure Confirmation
MSS Swing Length controls the number of candles used to calculate the swing high and swing low for Market Structure Shift confirmation.
• Lower values generate faster and more frequent signals.
• Higher values generate slower and more selective signals.
The default value is 10. A range between 5 and 15 may be used as a starting point, depending on the asset and timeframe.
5. Select the Entry Method
Classic
Uses the traditional reversal approach:
• A sweep below the previous liquidity low prepares a potential long setup.
• A sweep above the previous liquidity high prepares a potential short setup.
Classic mode is generally easier to understand and evaluate.
Adaptive
Uses the indicator’s internal historical behavior to adjust the potential trade direction.
Depending on its internal long and short performance counters, Adaptive mode may occasionally select a continuation direction instead of the traditional reversal direction.
Adaptive mode is experimental, and its behavior may vary between assets and timeframes.
6. Interpret the Signals
Potential Long Setup
• Price sweeps below the previous liquidity low.
• The indicator detects a bullish Market Structure Shift on a later candle.
• A Buy label appears after confirmation.
• Entry, take-profit and stop-loss levels are calculated.
Potential Short Setup
• Price sweeps above the previous liquidity high.
• The indicator detects a bearish Market Structure Shift on a later candle.
• A Sell label appears after confirmation.
• Entry, take-profit and stop-loss levels are calculated.
Liquidity sweep markers show where price crossed a previous liquidity level. Do not enter solely because a sweep marker appears. Wait for the subsequent structure confirmation and Buy or Sell label.
7. Configure Take Profit and Stop Loss
The indicator provides two TP/SL calculation methods:
Dynamic Method
Uses:
• A five-bar ATR
• The selected Risk setting
• The MSS swing high or low
• An internal reward-to-risk multiplier of approximately 0.9
For long trades, the stop-loss is placed below the MSS swing low with an additional ATR-based distance. The target is calculated above the entry using the entry-to-stop distance.
For short trades, the stop-loss is placed above the MSS swing high with an additional ATR-based distance. The target is calculated below the entry using the entry-to-stop distance.
Fixed Method
Uses user-defined percentages from the entry price.
Default values:
• Take Profit: 0.3%
• Stop Loss: 0.4%
These values should be adjusted according to the asset’s volatility and the selected timeframe.
Risk Setting
The Risk setting controls the ATR multiplier used to determine the Dynamic stop-loss distance:
• Highest: 10
• High: 6.5
• Normal: 5.5
• Low: 3.5
• Lowest: 1.15
This setting controls the distance of the stop-loss. It does not calculate position size or the monetary amount at risk.
A wider stop-loss should normally be combined with a smaller position size.
8. Select the TP/SL Layout
Default
Displays dashed lines with TP and SL labels.
Alternative
Displays take-profit and stop-loss areas as colored boxes.
This setting changes only the visual layout and does not change the calculated prices.
9. Enable Visual Elements
• Show Liquidity Zones: Displays the reference liquidity areas.
• Liq Grabs: Displays detected liquidity sweep markers.
• TP / SL: Displays entry, take-profit and stop-loss levels.
• Buy and Sell Colors: Controls the signal and zone colors.
• Text Color: Controls the color of labels and displayed values.
10. Create Alerts
Alerts are available for:
• Buy Signal
• Sell Signal
• Take-Profit Signal
• Stop-Loss Signal
To create an alert:
1. Open TradingView’s alert menu.
2. Select Liquidity Sweep Reversal.
3. Choose the required alert condition.
4. Select the notification method.
5. Consider using “Once Per Bar Close” to reduce intrabar signals.
6. Apply Practical Confirmation
For more selective setups, consider confirming signals with:
• Higher-timeframe trend direction
• Support and resistance levels
• Trading volume
• Market session and available liquidity
• Supply and demand zones
• Candle-close confirmation
Always review the displayed entry, target and stop-loss levels before taking a trade. Calculate position size independently according to the stop-loss distance.
Example Starting Configuration
For a 15-minute chart:
• Higher Timeframe: 60 minutes
• MSS Swing Length: 10
• Breakout Method: Close
• Entry Method: Classic
• TP / SL Method: Dynamic
• Risk: Low
These settings are only a starting point and are not universally optimal.
Historical Dashboard
The Liquidity Sweep Backtest dashboard displays:
• Total Entries
• Wins
• Losses
• Win Rate
• Average Profit
• Total Profit
The dashboard is intended for approximate comparison between settings. The script is an indicator, not a strategy, and the dashboard is not equivalent to TradingView’s Strategy Tester.
The calculations do not include:
• Brokerage commissions
• Slippage
• Bid-ask spread
• Position sizing
• Price gaps
• Actual order execution
• Taxes or financing costs
Historical results do not guarantee future performance.
Practical Limitations
The indicator may be less effective during:
• Strong one-directional trends
• Low-liquidity market conditions
• Major news releases
• Large price gaps
• Narrow or random consolidation
• Highly volatile intrabar movement
• Non-standard chart types
• Poorly matched timeframe settings
The indicator processes approximately the most recent 4,900 bars to maintain performance. Results may change when the symbol, timeframe or settings are changed.
Attribution and Modifications
Original open-source code by fluxchart.
Modified by Mohammed Bedaiwi (mbedaiwi2).
Modifications include:
• Conversion to Pine Script v6
• Safer higher-timeframe handling
• Automatic four-bar fallback when the selected timeframe is not higher than the chart timeframe
• Dashboard calculation safeguards
• Independent indicator naming and presentation
The modified source code remains available under the Mozilla Public License 2.0.
Important Notice
This indicator is provided for educational and analytical purposes only. It does not constitute financial advice, an investment recommendation or a guarantee of profitable results.
Trading and investing involve substantial risk. Users should perform independent analysis, apply appropriate position sizing and risk management, and avoid risking funds they cannot afford to lose.
────────────────────────────
الوصف العربي
نظرة عامة
مؤشر Liquidity Sweep Reversal هو مؤشر لتحليل حركة السعر، صُمم لاكتشاف فرص الانعكاس المحتملة بعد سحب السيولة أعلى القمم السابقة أو أسفل القيعان السابقة.
يراقب المؤشر نطاقًا مرجعيًا للسيولة. عندما يتحرك السعر خارج أحد طرفي هذا النطاق، ينتظر المؤشر تغيرًا لاحقًا في هيكل السوق قبل إصدار إشارة شراء أو بيع محتملة.
لا يؤدي سحب السيولة وحده إلى إصدار إشارة دخول، بل يجب ظهور تأكيد لاحق من هيكل السوق.
طريقة العمل
• سحب السيولة أسفل القاع السابق يجهز فرصة شراء محتملة.
• سحب السيولة أعلى القمة السابقة يجهز فرصة بيع محتملة.
• يتم تأكيد الدخول بواسطة تغير هيكل السوق وفق إعداد MSS Swing Length.
• يمكن اكتشاف سحب السيولة بواسطة ظلال الشموع أو أسعار الإغلاق.
• يتوفر أسلوبا دخول Classic وAdaptive.
• إذا كان الإطار المرجعي مساويًا أو أقل من إطار الرسم، يستخدم المؤشر تلقائيًا فترة تعادل أربع شمعات.
الميزات
• اكتشاف سحب السيولة
• تأكيد تغير هيكل السوق
• إشارات شراء وبيع محتملة
• أسلوبا دخول Classic وAdaptive
• معالجة آمنة للإطار الزمني
• أهداف ووقف خسارة ثابتة أو مبنية على ATR
• تنبيهات الشراء والبيع والهدف ووقف الخسارة
• مناطق سيولة وعلامات سحب اختيارية
• لوحة نتائج تاريخية
• التوافق مع Pine Script v6
طريقة الاستخدام
1. اختر إطار الرسم
• 5–15 دقيقة: للتداول اليومي
• ساعة إلى 4 ساعات: للتداول قصير أو متوسط الأجل
• يومي: للتداول متوسط الأجل
يفضل استخدام رسم الشموع العادي.
2. اختر الإطار المرجعي الأعلى
إعدادات مقترحة:
• رسم 5 دقائق ← 30 أو 60 دقيقة
• رسم 15 دقيقة ← 60 أو 240 دقيقة
• رسم ساعة ← 4 ساعات
• رسم 4 ساعات ← يومي
• رسم يومي ← أسبوعي
إذا كان الإطار المختار مساويًا أو أقل من إطار الرسم، يستخدم المؤشر فترة تلقائية تعادل أربع شمعات، وتظهر عبارة `Auto x4`.
3. اختر طريقة اكتشاف سحب السيولة
Wick
يعتمد على اختراق ظل الشمعة:
• اكتشاف أسرع
• إشارات أكثر
• حساسية أعلى للحركات اللحظية
Close
يشترط إغلاق الشمعة بعد مستوى السيولة:
• تأكيد أقوى
• إشارات أقل
• تصفية بعض اختراقات الظلال
4. اضبط MSS Swing Length
يحدد عدد الشمعات المستخدمة لتأكيد تغير هيكل السوق.
• القيمة المنخفضة تعطي إشارات أسرع وأكثر عددًا.
• القيمة المرتفعة تعطي إشارات أقل وأكثر انتقائية.
القيمة الافتراضية هي 10، ويمكن البدء بنطاق بين 5 و15.
5. اختر أسلوب الدخول
Classic
• سحب سيولة القاع يؤدي إلى البحث عن شراء.
• سحب سيولة القمة يؤدي إلى البحث عن بيع.
Adaptive
يستخدم السلوك التاريخي الداخلي للمؤشر لتعديل اتجاه الصفقة المحتمل، وقد يختار أحيانًا اتجاهًا استمراريًا بدل الانعكاس التقليدي.
يفضل البدء بوضع Classic لأنه أسهل في الفهم والتقييم.
6. قراءة الإشارات
إشارة شراء محتملة:
• يسحب السعر السيولة أسفل القاع السابق.
• يظهر تغير صاعد في هيكل السوق على شمعة لاحقة.
• تظهر علامة Buy.
• يتم حساب الدخول والهدف ووقف الخسارة.
إشارة بيع محتملة:
• يسحب السعر السيولة أعلى القمة السابقة.
• يظهر تغير هابط في هيكل السوق على شمعة لاحقة.
• تظهر علامة Sell.
• يتم حساب الدخول والهدف ووقف الخسارة.
لا تدخل اعتمادًا على علامة سحب السيولة وحدها، بل انتظر تأكيد هيكل السوق وظهور Buy أو Sell.
7. إعداد الهدف ووقف الخسارة
Dynamic
يستخدم:
• ATR بطول خمس شمعات
• مستوى Risk المختار
• قمة أو قاع MSS
• نسبة عائد إلى مخاطرة داخلية تقارب 0.9
Fixed
يستخدم نسبًا ثابتة من سعر الدخول.
القيم الافتراضية:
• الهدف: 0.3%
• وقف الخسارة: 0.4%
يجب تعديل هذه القيم وفق تذبذب الأصل والإطار الزمني.
إعداد Risk يتحكم في المسافة بين الدخول ووقف الخسارة، ولا يحسب حجم الصفقة أو المبلغ المالي المعرض للخسارة.
8. العناصر المرئية
• Show Liquidity Zones: إظهار مناطق السيولة
• Liq Grabs: إظهار علامات سحب السيولة
• TP / SL: إظهار الدخول والهدف ووقف الخسارة
• Default Layout: عرض المستويات على شكل خطوط
• Alternative Layout: عرض المستويات على شكل مناطق ملونة
9. التنبيهات
يدعم المؤشر تنبيهات:
• الشراء
• البيع
• الوصول إلى الهدف
• الوصول إلى وقف الخسارة
يفضل ضبط التنبيه على مرة واحدة عند إغلاق الشمعة لتقليل الإشارات اللحظية.
10. التأكيد العملي
يمكن تحسين انتقائية الإشارات باستخدام:
• اتجاه الإطار الزمني الأعلى
• الدعم والمقاومة
• حجم التداول
• جلسة السوق والسيولة
• مناطق العرض والطلب
• تأكيد إغلاق الشمعة
يجب مراجعة الهدف ووقف الخسارة وحساب حجم الصفقة بصورة مستقلة قبل الدخول.
لوحة النتائج التاريخية
تعرض لوحة Liquidity Sweep Backtest:
• إجمالي الصفقات
• الصفقات الرابحة
• الصفقات الخاسرة
• نسبة النجاح
• متوسط النتيجة
• إجمالي النتيجة
اللوحة مخصصة للمقارنة التقريبية بين الإعدادات. السكريبت مؤشر وليس استراتيجية، ولذلك لا تعادل اللوحة Strategy Tester في TradingView.
لا تتضمن النتائج العمولات أو الانزلاق السعري أو فرق العرض والطلب أو حجم الصفقة أو إمكانية التنفيذ الفعلي.
حقوق الكود والتعديلات
الكود الأصلي مفتوح المصدر من تطوير fluxchart.
تم تعديله بواسطة Mohammed Bedaiwi (mbedaiwi2).
تشمل التعديلات:
• التحويل إلى Pine Script v6
• تحسين معالجة الإطار الزمني
• استخدام فترة تلقائية تعادل أربع شمعات عند الحاجة
• حماية حسابات لوحة النتائج
• تغيير اسم وهوية المؤشر بصورة مستقلة
يظل الكود المعدل خاضعًا لترخيص Mozilla Public License 2.0.
إخلاء المسؤولية
هذا المؤشر أداة تعليمية وتحليلية فقط، ولا يمثل توصية مالية أو ضمانًا للربح.
ينطوي التداول والاستثمار على مخاطر. يجب على المستخدم إجراء تحليله المستقل، واستخدام حجم صفقة مناسب، وتطبيق إدارة المخاطر وعدم المخاطرة بأموال لا يستطيع تحمل خسارتها.
ملاحظات الأخبار
Ver. 1.1- Fixed: the indicator showed no signals (0 entries) on charts with fewer than ~4,900 bars (e.g. 4H and Daily charts on stocks and TASI). Setups are now created only after the liquidity levels are fully calculated.
- Fixed dashboard: returns are now measured from the entry price; open trades are no longer counted as losses (new "Open Trades" row).
- Exits: the stop is checked before the target on the same bar; take profit exits at the target level; gap-through stops exit at the open price.
- New settings: Max Stop Distance %, Setup Expiry (bars), Max Bars in Trade.
- Default Breakout Method changed to Close (more selective, fewer false sweeps).
- Renamed to "Liquidity Sweep Reversal Ver. 1.1 | M. Bedaiwi".
الإصدار 1.1
- إصلاح غياب الإشارات على التشارتات التي فيها أقل من 4,900 شمعة تقريبًا (مثل فريم 4 ساعات واليومي على الأسهم وتاسي).
- تصحيح لوحة النتائج: الربح يُحسب من سعر الدخول، والصفقات المفتوحة لا تُحسب خسارة.
- تحسين الخروج: الوقف أولًا عند لمس المستويين في نفس الشمعة، والخروج عند الهدف نفسه، والخروج بسعر الافتتاح عند الفجوة.
- إعدادات جديدة: حد أقصى لمسافة الوقف، انتهاء صلاحية الإعداد، حد أقصى لمدة الصفقة.
- طريقة الكسر الافتراضية أصبحت Close.
- تغيير الاسم إلى "Liquidity Sweep Reversal Ver. 1.1 | M. Bedaiwi".
ملاحظات الأخبار
Ver. 1.1.1- Updated the publication chart preview (TASI, Daily). No logic changes.
- See the Ver. 1.1 release notes below for the full list of fixes and new settings.
الإصدار 1.1.1
- تحديث صورة التشارت في صفحة النشر (تاسي، يومي). لا توجد تغييرات في المنطق.
- راجع ملاحظات الإصدار 1.1 أدناه لقائمة الإصلاحات والإعدادات الجديدة.

إخلاء المسؤولية
لا يُقصد بالمعلومات والمنشورات أن تكون، أو تشكل، أي نصيحة مالية أو استثمارية أو تجارية أو أنواع أخرى من النصائح أو التوصيات المقدمة أو المعتمدة من TradingView. اقرأ المزيد في شروط الاستخدام.
إخلاء المسؤولية
لا يُقصد بالمعلومات والمنشورات أن تكون، أو تشكل، أي نصيحة مالية أو استثمارية أو تجارية أو أنواع أخرى من النصائح أو التوصيات المقدمة أو المعتمدة من TradingView. اقرأ المزيد في شروط الاستخدام.