OPEN-SOURCE SCRIPT
Zuri HTF SMA Band
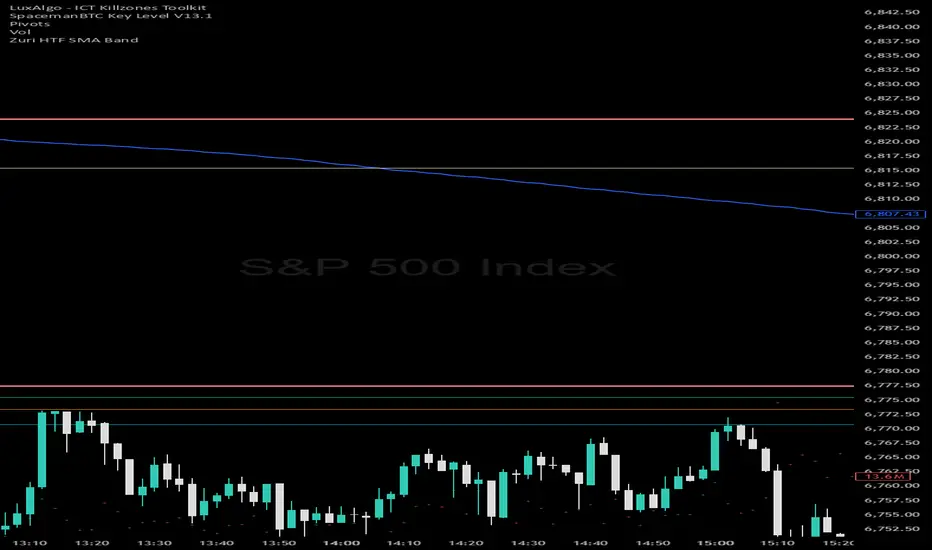
Zuri HTF SMA Band displays the 200-period Simple Moving Average from the 5-minute timeframe and the 1-hour timeframe on any chart. This allows traders to see higher timeframe structure while executing entries on lower timeframes such as the 1-minute or 2-minute chart.
The blue line represents the 5-minute 200 SMA, which helps identify intraday structure, pullbacks, and continuation areas.
The orange line represents the 1-hour 200 SMA, providing a broader view of market bias and higher timeframe trend direction.
By plotting both moving averages together, traders can quickly see when price is:
• trending above higher timeframe structure
• pulling back into a key moving average zone
• compressing between higher timeframe levels
This indicator is designed to keep the chart clean and uncluttered, focusing only on the most commonly respected institutional moving averages for futures markets such as ES and NQ.
It is especially useful for traders who prefer to combine higher timeframe structure with lower timeframe price action to time entries around pullbacks, bounces, and retests of key moving average levels.
نص برمجي مفتوح المصدر
بروح TradingView الحقيقية، قام مبتكر هذا النص البرمجي بجعله مفتوح المصدر، بحيث يمكن للمتداولين مراجعة وظائفه والتحقق منها. شكرا للمؤلف! بينما يمكنك استخدامه مجانًا، تذكر أن إعادة نشر الكود يخضع لقواعد الموقع الخاصة بنا.

إخلاء المسؤولية
لا يُقصد بالمعلومات والمنشورات أن تكون، أو تشكل، أي نصيحة مالية أو استثمارية أو تجارية أو أنواع أخرى من النصائح أو التوصيات المقدمة أو المعتمدة من TradingView. اقرأ المزيد في شروط الاستخدام.
نص برمجي مفتوح المصدر
بروح TradingView الحقيقية، قام مبتكر هذا النص البرمجي بجعله مفتوح المصدر، بحيث يمكن للمتداولين مراجعة وظائفه والتحقق منها. شكرا للمؤلف! بينما يمكنك استخدامه مجانًا، تذكر أن إعادة نشر الكود يخضع لقواعد الموقع الخاصة بنا.
إخلاء المسؤولية
لا يُقصد بالمعلومات والمنشورات أن تكون، أو تشكل، أي نصيحة مالية أو استثمارية أو تجارية أو أنواع أخرى من النصائح أو التوصيات المقدمة أو المعتمدة من TradingView. اقرأ المزيد في شروط الاستخدام.