Market Regime [EMA & ATR]
Description:
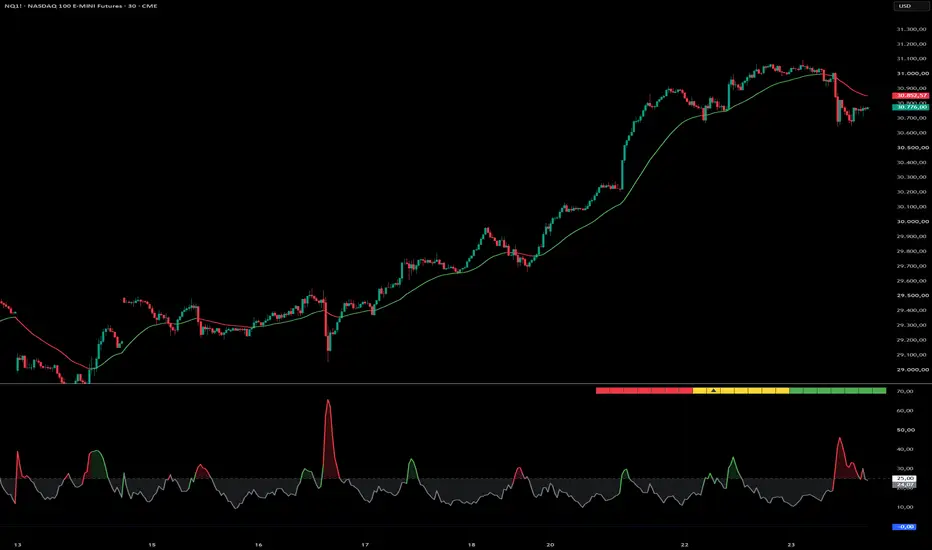
The Market Regime Explorer is a comprehensive multi-timeframe indicator designed to identify the current market environment by combining trend direction and volatility breakouts. It utilizes a dual-chart display technique, bringing essential trend data to your main chart while keeping momentum and volatility metrics neatly organized in the subchart.
Key Features:
Customization:
Every aspect of this indicator is fully customizable. You can adjust the MA types (SMA, EMA, WMA, RMA), smoothing lengths, ATR thresholds, HUD positioning, and color schemes to perfectly fit your trading strategy and visual preferences.
Disclaimer:
This script is provided for educational and informational purposes only and does not constitute financial advice. Trading in financial markets involves a high level of risk and may not be suitable for all investors. Past performance is not indicative of future results. Always conduct your own research and trade at your own risk.
The Market Regime Explorer is a comprehensive multi-timeframe indicator designed to identify the current market environment by combining trend direction and volatility breakouts. It utilizes a dual-chart display technique, bringing essential trend data to your main chart while keeping momentum and volatility metrics neatly organized in the subchart.
Key Features:
- Dual-Display Magic (Main Chart & Subchart): Built with Pine Script v5's force_overlay feature, this script plots the moving average directly over your price action on the main chart, while simultaneously rendering the ATR and EMA Slope in a clean subchart below.
- Trend Direction (Main Chart): A customizable moving average (Default: 200 EMA) is plotted on the main chart. It dynamically changes color based on whether the price closes above or below the MA, giving you an immediate visual cue of the baseline trend.
- Volatility Breakouts (Subchart): The ATR line tracks market volatility. When the ATR breaches your custom threshold (Default: 25), the area fills with color to signal an active market regime.
- Momentum Coloring: The ATR fill color is driven by the slope (momentum) of the EMA. If the EMA is rising during a volatility breakout, it paints green. If the EMA is falling, it paints red. If volatility is below the threshold, it remains a neutral gray.
- On-Chart HUD Gauge: A dynamic, visual progress bar (Heads-Up Display) is drawn directly on your chart. It visualizes the current EMA slope percentage in real-time, functioning like a speedometer. The gauge features a customizable limit (clipping) and smoothly transitions from red (strong downtrend) to yellow (neutral) to green (strong uptrend).
- Multi-Timeframe (MTF) Support: Easily track higher timeframe market regimes without changing your current chart view using the built-in MTF dropdown.
Customization:
Every aspect of this indicator is fully customizable. You can adjust the MA types (SMA, EMA, WMA, RMA), smoothing lengths, ATR thresholds, HUD positioning, and color schemes to perfectly fit your trading strategy and visual preferences.
Disclaimer:
This script is provided for educational and informational purposes only and does not constitute financial advice. Trading in financial markets involves a high level of risk and may not be suitable for all investors. Past performance is not indicative of future results. Always conduct your own research and trade at your own risk.

إخلاء المسؤولية
لا يُقصد بالمعلومات والمنشورات أن تكون، أو تشكل، أي نصيحة مالية أو استثمارية أو تجارية أو أنواع أخرى من النصائح أو التوصيات المقدمة أو المعتمدة من TradingView. اقرأ المزيد في شروط الاستخدام.
إخلاء المسؤولية
لا يُقصد بالمعلومات والمنشورات أن تكون، أو تشكل، أي نصيحة مالية أو استثمارية أو تجارية أو أنواع أخرى من النصائح أو التوصيات المقدمة أو المعتمدة من TradingView. اقرأ المزيد في شروط الاستخدام.