OPEN-SOURCE SCRIPT
SQVIGU STH MVRV Bollinger Oscillator + Macro Trend
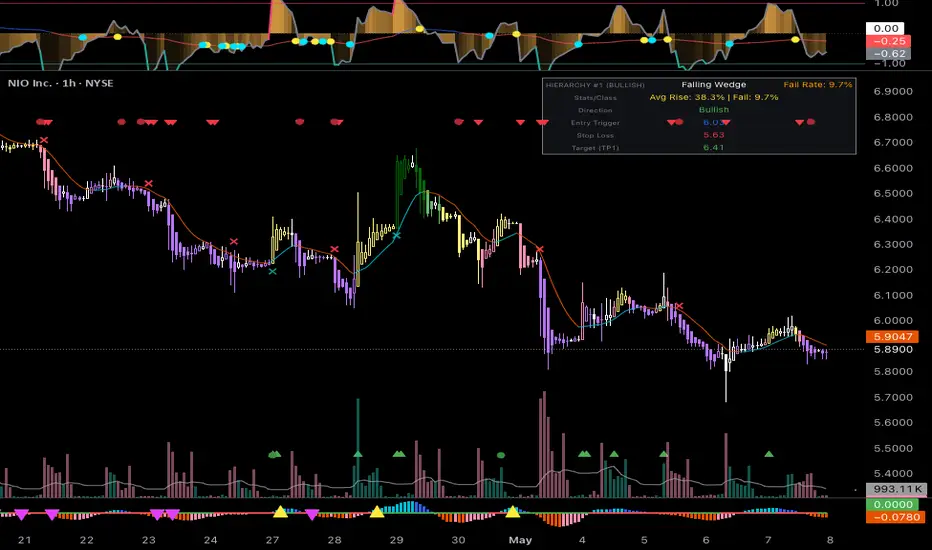
1. Trend Pullbacks (High Probability)
The safest and most consistent setups occur when the short-term oscillator moves against the macro trend, creating a rubber-band effect.
• The Long Setup: Wait for the thin Macro Trend line to be Blue (above zero). Ignore the oscillator when it hits the pink Overheated line. Instead, wait for the oscillator to drop and touch the green Oversold line (-1.0). You are buying a short-term extreme dip in a confirmed macro uptrend.
• The Short Setup: The Macro Trend line is Red (below zero). Wait for the oscillator to spike up into the pink Overheated line (+1.0). You are shorting a dead-cat bounce within a macro downtrend.
2. Spotting Structural Reversals (The Pivot Dots)
This is where those bright Yellow (Peak) and Cyan (Trough) dots on the macro line come into play. They tell you when the underlying momentum is exhausting itself.
• If you are analyzing assets highly sensitive to standard deviation events—like sovereign bond yields, treasury auction data, or broad macro indices—you are looking for a Double Overextension.
• The Top: The short-term oscillator blasts above +1.0 (Overheated), and right at that exact moment, the macro line prints a Bright Yellow Dot and begins to curl down into the red. This means both the immediate price action and the underlying momentum are exhausted simultaneously.
• The Bottom: The oscillator crashes below -1.0 (Oversold) while the macro line prints a Bright Cyan Dot and curls up.
3. Avoiding the "Value Trap"
In a deeply trending market, an asset can stay Overheated or Oversold for a long time, riding the upper or lower Bollinger Bands.
• If the short-term oscillator hits -1.0 (Oversold), but the Macro Trend line is plunging deep into the Red with no signs of curving or printing a Cyan dot, do not catch the falling knife.
• The gradient fill helps visualize this: if the orange fill is heavy and solid at the bottom, and the macro line is aggressively red, the asset is experiencing a high-sigma bleed. Wait for the oscillator to cross back above the green line or for a Cyan macro dot to print before stepping in.
4. Reading the Gradient Heatmap
• Faded/Transparent Middle: When the orange fill is nearly invisible and hovering around the zero line, the asset is chopping around its moving average. There is no edge here. Stay out.
• Solid/Glowing Extremes: When the orange fill becomes dense and solid near the +1.0 or -1.0 lines, volatility has expanded. This is your cue to start watching for peak/trough alerts or macro pivot dots.
The safest and most consistent setups occur when the short-term oscillator moves against the macro trend, creating a rubber-band effect.
• The Long Setup: Wait for the thin Macro Trend line to be Blue (above zero). Ignore the oscillator when it hits the pink Overheated line. Instead, wait for the oscillator to drop and touch the green Oversold line (-1.0). You are buying a short-term extreme dip in a confirmed macro uptrend.
• The Short Setup: The Macro Trend line is Red (below zero). Wait for the oscillator to spike up into the pink Overheated line (+1.0). You are shorting a dead-cat bounce within a macro downtrend.
2. Spotting Structural Reversals (The Pivot Dots)
This is where those bright Yellow (Peak) and Cyan (Trough) dots on the macro line come into play. They tell you when the underlying momentum is exhausting itself.
• If you are analyzing assets highly sensitive to standard deviation events—like sovereign bond yields, treasury auction data, or broad macro indices—you are looking for a Double Overextension.
• The Top: The short-term oscillator blasts above +1.0 (Overheated), and right at that exact moment, the macro line prints a Bright Yellow Dot and begins to curl down into the red. This means both the immediate price action and the underlying momentum are exhausted simultaneously.
• The Bottom: The oscillator crashes below -1.0 (Oversold) while the macro line prints a Bright Cyan Dot and curls up.
3. Avoiding the "Value Trap"
In a deeply trending market, an asset can stay Overheated or Oversold for a long time, riding the upper or lower Bollinger Bands.
• If the short-term oscillator hits -1.0 (Oversold), but the Macro Trend line is plunging deep into the Red with no signs of curving or printing a Cyan dot, do not catch the falling knife.
• The gradient fill helps visualize this: if the orange fill is heavy and solid at the bottom, and the macro line is aggressively red, the asset is experiencing a high-sigma bleed. Wait for the oscillator to cross back above the green line or for a Cyan macro dot to print before stepping in.
4. Reading the Gradient Heatmap
• Faded/Transparent Middle: When the orange fill is nearly invisible and hovering around the zero line, the asset is chopping around its moving average. There is no edge here. Stay out.
• Solid/Glowing Extremes: When the orange fill becomes dense and solid near the +1.0 or -1.0 lines, volatility has expanded. This is your cue to start watching for peak/trough alerts or macro pivot dots.
نص برمجي مفتوح المصدر
بروح TradingView الحقيقية، قام مبتكر هذا النص البرمجي بجعله مفتوح المصدر، بحيث يمكن للمتداولين مراجعة وظائفه والتحقق منها. شكرا للمؤلف! بينما يمكنك استخدامه مجانًا، تذكر أن إعادة نشر الكود يخضع لقواعد الموقع الخاصة بنا.

إخلاء المسؤولية
لا يُقصد بالمعلومات والمنشورات أن تكون، أو تشكل، أي نصيحة مالية أو استثمارية أو تجارية أو أنواع أخرى من النصائح أو التوصيات المقدمة أو المعتمدة من TradingView. اقرأ المزيد في شروط الاستخدام.
نص برمجي مفتوح المصدر
بروح TradingView الحقيقية، قام مبتكر هذا النص البرمجي بجعله مفتوح المصدر، بحيث يمكن للمتداولين مراجعة وظائفه والتحقق منها. شكرا للمؤلف! بينما يمكنك استخدامه مجانًا، تذكر أن إعادة نشر الكود يخضع لقواعد الموقع الخاصة بنا.
إخلاء المسؤولية
لا يُقصد بالمعلومات والمنشورات أن تكون، أو تشكل، أي نصيحة مالية أو استثمارية أو تجارية أو أنواع أخرى من النصائح أو التوصيات المقدمة أو المعتمدة من TradingView. اقرأ المزيد في شروط الاستخدام.