OPEN-SOURCE SCRIPT
Previous Periods Highs and Lows + Labels
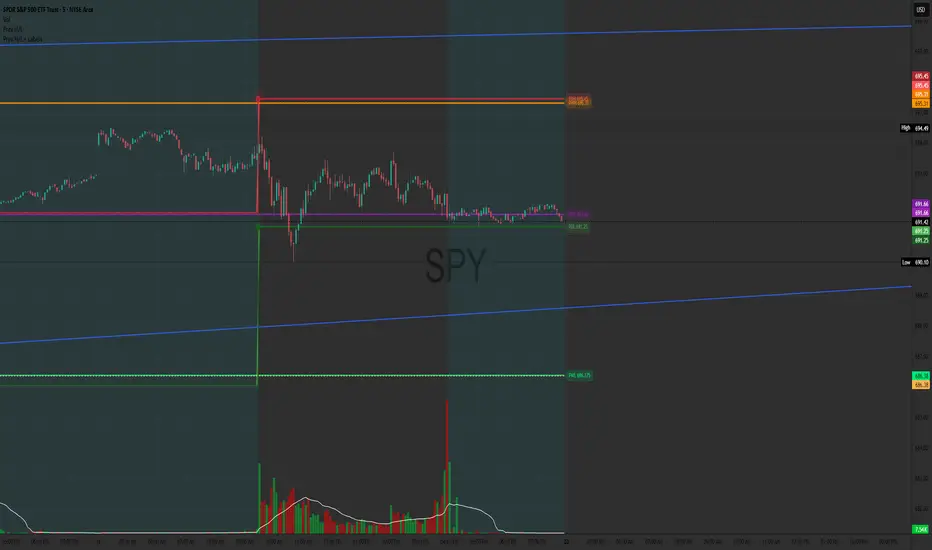
This indicator plots the high and low prices from the previous Day, Week, and Month as horizontal lines on any timeframe chart. It provides clear visual reference to key historical support and resistance levels commonly used by traders for: breakout and reversal identification
stop-loss placement
target setting
Features include distinct colors for each period and optional price labels displayed on the right side of the chart for quick reference.Simple, non-repainting, and optimized for both intraday and swing trading setups.
stop-loss placement
target setting
Features include distinct colors for each period and optional price labels displayed on the right side of the chart for quick reference.Simple, non-repainting, and optimized for both intraday and swing trading setups.
نص برمجي مفتوح المصدر
بروح TradingView الحقيقية، قام مبتكر هذا النص البرمجي بجعله مفتوح المصدر، بحيث يمكن للمتداولين مراجعة وظائفه والتحقق منها. شكرا للمؤلف! بينما يمكنك استخدامه مجانًا، تذكر أن إعادة نشر الكود يخضع لقواعد الموقع الخاصة بنا.

إخلاء المسؤولية
لا يُقصد بالمعلومات والمنشورات أن تكون، أو تشكل، أي نصيحة مالية أو استثمارية أو تجارية أو أنواع أخرى من النصائح أو التوصيات المقدمة أو المعتمدة من TradingView. اقرأ المزيد في شروط الاستخدام.
نص برمجي مفتوح المصدر
بروح TradingView الحقيقية، قام مبتكر هذا النص البرمجي بجعله مفتوح المصدر، بحيث يمكن للمتداولين مراجعة وظائفه والتحقق منها. شكرا للمؤلف! بينما يمكنك استخدامه مجانًا، تذكر أن إعادة نشر الكود يخضع لقواعد الموقع الخاصة بنا.
إخلاء المسؤولية
لا يُقصد بالمعلومات والمنشورات أن تكون، أو تشكل، أي نصيحة مالية أو استثمارية أو تجارية أو أنواع أخرى من النصائح أو التوصيات المقدمة أو المعتمدة من TradingView. اقرأ المزيد في شروط الاستخدام.