تم تحديثه
Merged Master SR, Trendly ICT & VWAP - Pastel Edition
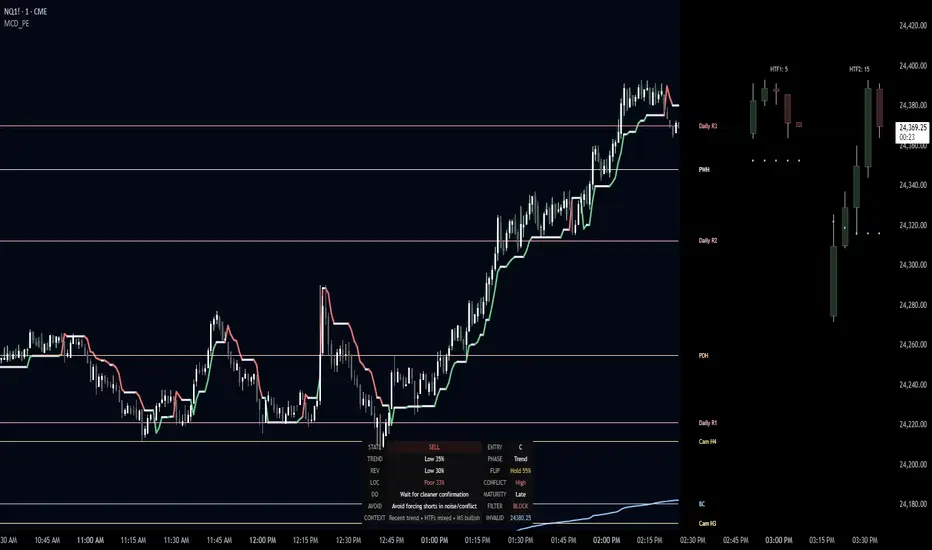
This indicator combines four ideas into one chart:
Static market levels
Daily, weekly, and monthly pivots, CPR, Camarilla levels, and previous highs/lows.
Trendly trend engine
A live trend-following line that helps identify bullish and bearish control.
VWAP
Shows where price is relative to fair intraday value.
HTF projection strip
Displays higher-timeframe candles on the right side so you can quickly read higher-timeframe structure without changing chart timeframe.
It is designed to answer three questions quickly:
Where is price trading relative to important levels?
Who is in control right now, buyers or sellers?
Is price in trend, pullback, compression, or exhaustion?
Core components
1. Static levels
These include:
Daily Pivot / CPR
Daily R1–R4 / S1–S4
Camarilla H1–H4 / L1–L4
Weekly Pivot / R1–R4 / S1–S4
Monthly Pivot / R1–R4 / S1–S4
Previous Day / Week / Month Highs and Lows
These are your reference map.
How to read them
Pivot / VWAP area = value area / decision area
R levels / H levels = resistance / upside objectives
S levels / L levels = support / downside objectives
Previous highs/lows = liquidity and reaction zones
Practical use
Price above pivot usually supports bullish bias
Price below pivot usually supports bearish bias
Price sitting inside CPR usually means balance or chop
Camarilla H3/H4 and L3/L4 are often strong reaction zones
2. Trendly
Trendly is the live trend line.
What it shows
Green = bullish trend state
Red = bearish trend state
It flips only when price changes regime enough to shift the trend logic
How to use it
Use Trendly as:
trend filter
entry confirmation
dynamic invalidation / trailing stop
Basic rule
If price is above Trendly and Trendly is bullish, longs have better odds
If price is below Trendly and Trendly is bearish, shorts have better odds
Do not use Trendly alone. Use it together with:
VWAP
Daily Pivot / CPR
nearby static levels
3. VWAP
VWAP helps you judge whether price is trading above or below fair value.
How to read it
Above VWAP = stronger auction / bullish value acceptance
Below VWAP = weaker auction / bearish value acceptance
Near VWAP = balance, retest, or decision zone
Practical use
Strong longs are better when price is above VWAP
Strong shorts are better when price is below VWAP
If price is repeatedly rotating around VWAP, expect chop until acceptance appears
4. HTF projection candles
These are the candles shown on the right side.
What they do
They let you see higher-timeframe candle structure without leaving your execution timeframe.
Why this matters
You may be trading on 1m or 3m, but the market often reacts to:
15m structure
1h structure
daily structure
The HTF strip helps you see:
bullish or bearish higher-timeframe body
wick rejection
expansion or weakness
multi-timeframe alignment
How the indicator should be used
Step 1: Identify location
Ask:
Is price above or below VWAP?
Is price above or below Daily Pivot?
Is price inside CPR, at resistance, or at support?
This tells you whether price is:
in value
above value
below value
stretched
Step 2: Read Trendly
Ask:
Is Trendly green or red?
Is price respecting it?
Did Trendly recently flip?
This tells you whether the move is:
trending
weakening
reversing
still intact
Step 3: Check higher-timeframe agreement
Look at the HTF strip.
Ask:
Are higher-timeframe candles aligned with the current move?
Are they expanding or rejecting?
Is the current timeframe fighting HTF direction?
Best trades usually happen when:
current chart trend
Trendly
VWAP location
HTF strip
all point the same way.
Step 4: Use static levels for decisions
Use static levels for:
entries
invalidation
partials
targets
reaction expectations
Examples:
Long from daily pivot toward DR1
Short from Cam H3 toward pivot
Buy reaction from DS1 if Trendly and VWAP support it
Fade only when price is stretched and confirmation appears
Best trade conditions
A. Bull trend continuation
Best conditions:
price above VWAP
price above Daily Pivot
Trendly bullish
HTF strip supportive
pullback into pivot / VWAP / DS1 / Cam L3 followed by bullish response
What to do:
wait for pullback
enter on bullish confirmation
use Trendly as dynamic stop reference
target next resistance zone
B. Bear trend continuation
Best conditions:
price below VWAP
price below Daily Pivot
Trendly bearish
HTF strip supportive to downside
rally into pivot / VWAP / DR1 / Cam H3 followed by bearish response
What to do:
wait for rally
enter on bearish confirmation
use Trendly as dynamic stop reference
target next support zone
C. Chop / balance
Signs:
price inside CPR
repeated VWAP crossing
Trendly weak or flipping often
no higher-timeframe agreement
What to do:
reduce size
wait for breakout and acceptance
avoid forcing trades inside value
D. Exhaustion
Signs:
price far from VWAP
price near DR2 / DH4 on upside
price near DS2 / DL4 on downside
candles become stretched
What to do:
do not chase
wait for reset
look for reaction back toward value
How to use each settings group
Master SR
Use this section to control which static levels appear.
Good usage
Keep Daily on for intraday trading
Keep Weekly on if market respects broader levels
Use Monthly when trading index futures or larger swing context
Turn off groups you do not need to reduce clutter
Static Levels Style
This controls how the static levels look.
Options
Transparency: make lines lighter
Width: thicker or thinner lines
Style: solid / dotted / dashed
Show Static Labels: turn labels on or off
Good usage
Use more transparency if chart is crowded
Use dotted or dashed lines for cleaner reading
Hide labels if you already know the map and want a cleaner screen
Limit Static Levels To Recent Bars
This is for decluttering.
What it does
Instead of drawing static levels across the whole chart, it only shows them for the last N bars.
Good usage
On fast intraday charts, use 30 to 100 bars
On slower charts, use a larger value
Turn this on when the chart starts looking too busy
Trendly ATR settings
These adjust Trendly sensitivity.
ATR Length
higher = smoother, slower
lower = faster, more reactive
ATR Factor
higher = fewer flips, wider trend line
lower = more flips, more sensitivity
Sensitivity
higher sensitivity = quicker reaction
lower sensitivity = steadier trend tracking
Good starting point
ATR Length: 14
ATR Factor: 2
Sensitivity: 0.5
ICT HTF Projections
Controls the higher-timeframe candle strip.
Number of Dynamic HTFs
How many higher timeframes to project.
Show Extra Daily HTF Strip
Adds daily strip separately.
Candles Per HTF
How many HTF candles you want to see.
Body Width / Spacing
Purely visual settings.
Good usage
Use 2 HTFs for balance
Use 5 candles for a clean read
Increase spacing if candles feel cramped
VWAP settings
Normally leave these near default unless you have a specific workflow.
Anchor Period
Session is best for intraday
Week / Month is useful for broader value context
How to actually trade with it
Long workflow
Check if price is above VWAP and above Daily Pivot
Check Trendly is bullish
Check HTF strip is not fighting the move
Wait for pullback into support:
VWAP
Pivot
DS1
Cam L3
Enter only after bullish response
Use Trendly or support failure as invalidation
Target next resistance level
Short workflow
Check if price is below VWAP and below Daily Pivot
Check Trendly is bearish
Check HTF strip is not fighting the move
Wait for rally into resistance:
VWAP
Pivot
DR1
Cam H3
Enter only after bearish response
Use Trendly or resistance reclaim as invalidation
Target next support level
Common mistakes
1. Trading inside value
If price is inside CPR and rotating near VWAP, edge is weak.
2. Chasing extension
If price is already stretched near DR2 / DH4 or DS2 / DL4, reward-to-risk is worse.
3. Ignoring higher timeframe
A lower-timeframe entry that fights HTF structure is lower quality.
4. Using Trendly alone
Trendly is strong as a filter, but best when combined with:
VWAP
Pivot
nearby static levels
candle behavior
Best setups summary
Highest quality long
above VWAP
above Daily Pivot
Trendly green
HTF aligned
pullback into support
bullish trigger candle
Highest quality short
below VWAP
below Daily Pivot
Trendly red
HTF aligned
rally into resistance
bearish trigger candle
Lowest quality environment
inside CPR
near VWAP
mixed HTF strip
weak candle closes
repeated back-and-forth Trendly interaction
Simple rule set for users
Bullish
Favor longs when:
price above VWAP
price above pivot
Trendly bullish
Bearish
Favor shorts when:
price below VWAP
price below pivot
Trendly bearish
No-trade
Stand aside when:
price is inside CPR
price repeatedly crosses VWAP
no clean HTF agreement
Take profit zones
Use:
DR1 / DR2 / Cam H3 / H4 for longs
DS1 / DS2 / Cam L3 / L4 for shorts
Invalidation
Use:
Trendly
failed support/resistance zone
reclaim/loss of pivot or VWAP
Best chart type for this indicator
This works especially well on:
index futures
liquid intraday instruments
trending sessions
structured markets that respect pivots and VWAP
Best execution timeframes are usually:
1m
3m
5m
15m
Final idea
Think of the indicator like this:
Static levels tell you where reactions should happen
VWAP tells you where value is
Trendly tells you who controls the move
HTF strip tells you whether bigger structure agrees
When all four align, the trade quality improves a lot.
Static market levels
Daily, weekly, and monthly pivots, CPR, Camarilla levels, and previous highs/lows.
Trendly trend engine
A live trend-following line that helps identify bullish and bearish control.
VWAP
Shows where price is relative to fair intraday value.
HTF projection strip
Displays higher-timeframe candles on the right side so you can quickly read higher-timeframe structure without changing chart timeframe.
It is designed to answer three questions quickly:
Where is price trading relative to important levels?
Who is in control right now, buyers or sellers?
Is price in trend, pullback, compression, or exhaustion?
Core components
1. Static levels
These include:
Daily Pivot / CPR
Daily R1–R4 / S1–S4
Camarilla H1–H4 / L1–L4
Weekly Pivot / R1–R4 / S1–S4
Monthly Pivot / R1–R4 / S1–S4
Previous Day / Week / Month Highs and Lows
These are your reference map.
How to read them
Pivot / VWAP area = value area / decision area
R levels / H levels = resistance / upside objectives
S levels / L levels = support / downside objectives
Previous highs/lows = liquidity and reaction zones
Practical use
Price above pivot usually supports bullish bias
Price below pivot usually supports bearish bias
Price sitting inside CPR usually means balance or chop
Camarilla H3/H4 and L3/L4 are often strong reaction zones
2. Trendly
Trendly is the live trend line.
What it shows
Green = bullish trend state
Red = bearish trend state
It flips only when price changes regime enough to shift the trend logic
How to use it
Use Trendly as:
trend filter
entry confirmation
dynamic invalidation / trailing stop
Basic rule
If price is above Trendly and Trendly is bullish, longs have better odds
If price is below Trendly and Trendly is bearish, shorts have better odds
Do not use Trendly alone. Use it together with:
VWAP
Daily Pivot / CPR
nearby static levels
3. VWAP
VWAP helps you judge whether price is trading above or below fair value.
How to read it
Above VWAP = stronger auction / bullish value acceptance
Below VWAP = weaker auction / bearish value acceptance
Near VWAP = balance, retest, or decision zone
Practical use
Strong longs are better when price is above VWAP
Strong shorts are better when price is below VWAP
If price is repeatedly rotating around VWAP, expect chop until acceptance appears
4. HTF projection candles
These are the candles shown on the right side.
What they do
They let you see higher-timeframe candle structure without leaving your execution timeframe.
Why this matters
You may be trading on 1m or 3m, but the market often reacts to:
15m structure
1h structure
daily structure
The HTF strip helps you see:
bullish or bearish higher-timeframe body
wick rejection
expansion or weakness
multi-timeframe alignment
How the indicator should be used
Step 1: Identify location
Ask:
Is price above or below VWAP?
Is price above or below Daily Pivot?
Is price inside CPR, at resistance, or at support?
This tells you whether price is:
in value
above value
below value
stretched
Step 2: Read Trendly
Ask:
Is Trendly green or red?
Is price respecting it?
Did Trendly recently flip?
This tells you whether the move is:
trending
weakening
reversing
still intact
Step 3: Check higher-timeframe agreement
Look at the HTF strip.
Ask:
Are higher-timeframe candles aligned with the current move?
Are they expanding or rejecting?
Is the current timeframe fighting HTF direction?
Best trades usually happen when:
current chart trend
Trendly
VWAP location
HTF strip
all point the same way.
Step 4: Use static levels for decisions
Use static levels for:
entries
invalidation
partials
targets
reaction expectations
Examples:
Long from daily pivot toward DR1
Short from Cam H3 toward pivot
Buy reaction from DS1 if Trendly and VWAP support it
Fade only when price is stretched and confirmation appears
Best trade conditions
A. Bull trend continuation
Best conditions:
price above VWAP
price above Daily Pivot
Trendly bullish
HTF strip supportive
pullback into pivot / VWAP / DS1 / Cam L3 followed by bullish response
What to do:
wait for pullback
enter on bullish confirmation
use Trendly as dynamic stop reference
target next resistance zone
B. Bear trend continuation
Best conditions:
price below VWAP
price below Daily Pivot
Trendly bearish
HTF strip supportive to downside
rally into pivot / VWAP / DR1 / Cam H3 followed by bearish response
What to do:
wait for rally
enter on bearish confirmation
use Trendly as dynamic stop reference
target next support zone
C. Chop / balance
Signs:
price inside CPR
repeated VWAP crossing
Trendly weak or flipping often
no higher-timeframe agreement
What to do:
reduce size
wait for breakout and acceptance
avoid forcing trades inside value
D. Exhaustion
Signs:
price far from VWAP
price near DR2 / DH4 on upside
price near DS2 / DL4 on downside
candles become stretched
What to do:
do not chase
wait for reset
look for reaction back toward value
How to use each settings group
Master SR
Use this section to control which static levels appear.
Good usage
Keep Daily on for intraday trading
Keep Weekly on if market respects broader levels
Use Monthly when trading index futures or larger swing context
Turn off groups you do not need to reduce clutter
Static Levels Style
This controls how the static levels look.
Options
Transparency: make lines lighter
Width: thicker or thinner lines
Style: solid / dotted / dashed
Show Static Labels: turn labels on or off
Good usage
Use more transparency if chart is crowded
Use dotted or dashed lines for cleaner reading
Hide labels if you already know the map and want a cleaner screen
Limit Static Levels To Recent Bars
This is for decluttering.
What it does
Instead of drawing static levels across the whole chart, it only shows them for the last N bars.
Good usage
On fast intraday charts, use 30 to 100 bars
On slower charts, use a larger value
Turn this on when the chart starts looking too busy
Trendly ATR settings
These adjust Trendly sensitivity.
ATR Length
higher = smoother, slower
lower = faster, more reactive
ATR Factor
higher = fewer flips, wider trend line
lower = more flips, more sensitivity
Sensitivity
higher sensitivity = quicker reaction
lower sensitivity = steadier trend tracking
Good starting point
ATR Length: 14
ATR Factor: 2
Sensitivity: 0.5
ICT HTF Projections
Controls the higher-timeframe candle strip.
Number of Dynamic HTFs
How many higher timeframes to project.
Show Extra Daily HTF Strip
Adds daily strip separately.
Candles Per HTF
How many HTF candles you want to see.
Body Width / Spacing
Purely visual settings.
Good usage
Use 2 HTFs for balance
Use 5 candles for a clean read
Increase spacing if candles feel cramped
VWAP settings
Normally leave these near default unless you have a specific workflow.
Anchor Period
Session is best for intraday
Week / Month is useful for broader value context
How to actually trade with it
Long workflow
Check if price is above VWAP and above Daily Pivot
Check Trendly is bullish
Check HTF strip is not fighting the move
Wait for pullback into support:
VWAP
Pivot
DS1
Cam L3
Enter only after bullish response
Use Trendly or support failure as invalidation
Target next resistance level
Short workflow
Check if price is below VWAP and below Daily Pivot
Check Trendly is bearish
Check HTF strip is not fighting the move
Wait for rally into resistance:
VWAP
Pivot
DR1
Cam H3
Enter only after bearish response
Use Trendly or resistance reclaim as invalidation
Target next support level
Common mistakes
1. Trading inside value
If price is inside CPR and rotating near VWAP, edge is weak.
2. Chasing extension
If price is already stretched near DR2 / DH4 or DS2 / DL4, reward-to-risk is worse.
3. Ignoring higher timeframe
A lower-timeframe entry that fights HTF structure is lower quality.
4. Using Trendly alone
Trendly is strong as a filter, but best when combined with:
VWAP
Pivot
nearby static levels
candle behavior
Best setups summary
Highest quality long
above VWAP
above Daily Pivot
Trendly green
HTF aligned
pullback into support
bullish trigger candle
Highest quality short
below VWAP
below Daily Pivot
Trendly red
HTF aligned
rally into resistance
bearish trigger candle
Lowest quality environment
inside CPR
near VWAP
mixed HTF strip
weak candle closes
repeated back-and-forth Trendly interaction
Simple rule set for users
Bullish
Favor longs when:
price above VWAP
price above pivot
Trendly bullish
Bearish
Favor shorts when:
price below VWAP
price below pivot
Trendly bearish
No-trade
Stand aside when:
price is inside CPR
price repeatedly crosses VWAP
no clean HTF agreement
Take profit zones
Use:
DR1 / DR2 / Cam H3 / H4 for longs
DS1 / DS2 / Cam L3 / L4 for shorts
Invalidation
Use:
Trendly
failed support/resistance zone
reclaim/loss of pivot or VWAP
Best chart type for this indicator
This works especially well on:
index futures
liquid intraday instruments
trending sessions
structured markets that respect pivots and VWAP
Best execution timeframes are usually:
1m
3m
5m
15m
Final idea
Think of the indicator like this:
Static levels tell you where reactions should happen
VWAP tells you where value is
Trendly tells you who controls the move
HTF strip tells you whether bigger structure agrees
When all four align, the trade quality improves a lot.
ملاحظات الأخبار
VWAPTrendly
PIVOT POINTS
HTS canlde
ملاحظات الأخبار
New updates in identifying static levelsملاحظات الأخبار
Updated tablesملاحظات الأخبار
CleanerFaster to read
More “pro trader style”
Less mental overload
ملاحظات الأخبار
This is a market decision assistant.It combines:
Trend (Trendly)
Location (levels, VWAP, OB, FVG)
Structure (CHOCH, sweeps, etc.)
Momentum + maturity
Hidden confirmations
And converts all of that into a single compact decision box
ملاحظات الأخبار
MCD_PE — Market Context & Decision EngineThis indicator is a context-driven trading assistant designed to simplify decision-making by combining trend, structure, location, and risk into a single compact information box.
Instead of reacting to individual signals, it evaluates the market as a whole and answers:
What is the current bias?
Is this a good place to trade?
Is the trend strong or weak?
Is a reversal likely?
What should I do right now?
🔍 What it uses
The indicator integrates multiple layers of market logic:
Trend (Trendly-based regime)
VWAP and Pivot acceptance
CPR and key static levels
Order Blocks & Fair Value Gaps
Structure (BOS / CHoCH / internal flow)
Liquidity sweeps & rejection behavior
Momentum & expansion
Chop and compression detection
All of this is converted into a simple decision box.
🧠 What makes it different
This is not a signal indicator.
It is a decision engine that focuses on:
Avoiding bad trades
Timing good entries
Understanding market condition in real-time
Reducing emotional and impulsive decisions
📊 How to Read the Box
🟢 STATE
Shows current bias based on Trendly
BUY → look for longs only
SELL → look for shorts only
🎯 ENTRY
Setup quality based on multiple factors
Grade Meaning
A High-quality setup
B Tradable
C Weak
D Avoid
📈 TREND
Strength of the current move
High = strong continuation
Low = weak / choppy
🔄 PHASE
Where the market is in the move:
Phase Meaning
Pullback Best entry zone
Trend Normal continuation
Impulse Move already extended
Shift Possible transition
Exhaustion Late move
Chop No clear direction
⚠️ REV (Reversal Probability)
High = increased chance of reversal
Low = safer trend continuation
📍 LOC (Location)
Measures how good the price zone is
Based on VWAP, pivots, OB, FVG, etc.
⚖️ CONFLICT
Measures disagreement between signals
High conflict = unreliable conditions
⏳ MATURITY
How far the trend has progressed
Early → best
Late → risky
🧭 FLIP (Live Trend Strength)
Shows real-time probability of a new Trendly flip holding
Hold % → strong acceptance
Watch % → uncertain
Fail % → weak / likely rejection
👉 This is a live interpretation, not based on past confirmation.
✅ DO
What action to take in current conditions
🚫 AVOID
What mistakes to avoid right now
⛔ FILTER
Final decision gate
PASS → allowed to trade
BLOCK → avoid trading
📉 INVALID
Key invalidation level (Trendly-based)
If broken → bias is wrong
🧩 CONTEXT
Summary of overall market condition
Includes trend maturity, HTF alignment, and structure
🎯 How to Use (Simple Workflow)
Step 1 — Identify Bias
Follow STATE
Trade only in that direction
Step 2 — Check FILTER
BLOCK → skip
PASS → continue
Step 3 — Look at PHASE
Pullback → best entry
Impulse → wait
Chop → avoid
Step 4 — Check ENTRY
Trade only A or B setups
Step 5 — Confirm with FLIP
High Hold % → trend likely to continue
Low Hold % → weak flip / risk
Step 6 — Follow DO / AVOID
Use as execution guidance
⚡ Best Trade Conditions
Trade when:
STATE aligned
FILTER = PASS
ENTRY = A or B
PHASE = Pullback
FLIP shows strong hold
🚫 Avoid Trading When
FILTER = BLOCK
PHASE = Chop
ENTRY = D
FLIP shows low hold / fail
🧠 Final Note
This indicator is designed to:
Reduce noise
Improve timing
Keep you aligned with market structure
It does not predict price — it helps you read and respond to it better.

إخلاء المسؤولية
لا يُقصد بالمعلومات والمنشورات أن تكون، أو تشكل، أي نصيحة مالية أو استثمارية أو تجارية أو أنواع أخرى من النصائح أو التوصيات المقدمة أو المعتمدة من TradingView. اقرأ المزيد في شروط الاستخدام.
إخلاء المسؤولية
لا يُقصد بالمعلومات والمنشورات أن تكون، أو تشكل، أي نصيحة مالية أو استثمارية أو تجارية أو أنواع أخرى من النصائح أو التوصيات المقدمة أو المعتمدة من TradingView. اقرأ المزيد في شروط الاستخدام.