تم تحديثه
INVERSE PRESSURE ENGINE | Anonycryptous
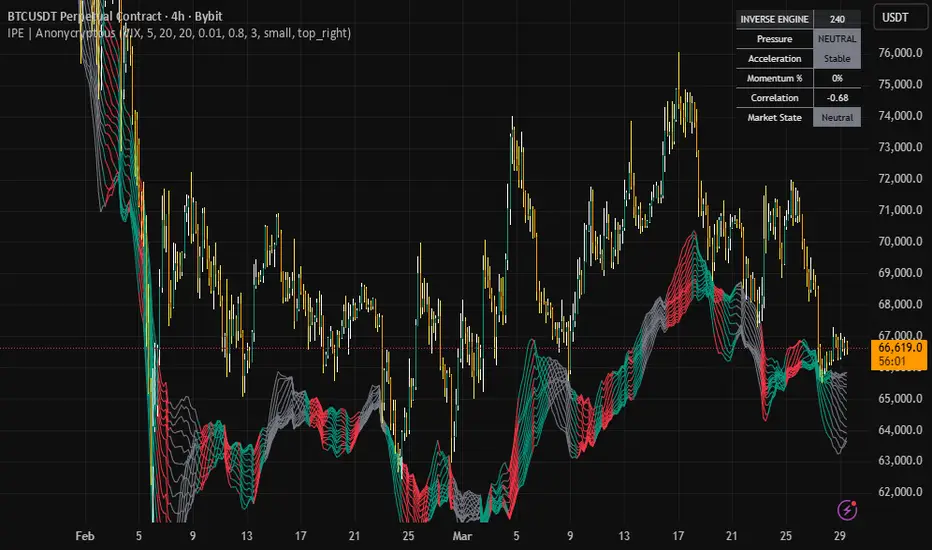
Inverse Pressure Engine by Anonycryptous
Technical Overview
The Inverse Pressure Engine is a high-speed intraday execution and correlation engine. While it is configured by default for Nasdaq (NQ) and the VIX, its modular design allows it to be used for any asset pair that exhibits an inverse correlation.
NOTE: The colors in the ribbon are negatively correlated! A red ribbon means that the correlated asset (e.g., VIX) is dumping. This implies that the asset you are trading (e.g., NQ) should normally rise!
Core Components & Logic
1. The 15-Line "Breathing" Ribbon
This visual system uses 15 smoothed lines (SMA 20 to SMA 48) anchored below the price action.
Expansion (Fanning Out): Indicates accelerating momentum in the secondary asset (e.g., VIX). Contraction (Tightening): Indicates the secondary asset's momentum is stalling, often preceding a trend reversal in the primary asset (e.g., NQ).
Dynamic ATR Offset: The ribbon maintains a consistent visual distance from your candles across all timeframes (1m, 5m, 15m), ensuring it never blocks your price action.
2. Fast Momentum & Correlation Engine
Momentum: Calculates the Linear Regression Slope to provide a "speedometer" of volatility shifts. It reacts significantly faster than standard moving average crosses.
Inverse Correlation: Continuously monitors the logarithmic returns between the two assets. A healthy inverse relationship typically shows a correlation between -0.70 and -1.0.
3. Divergence Detection
The indicator identifies when the two assets are moving in the same direction (e.g., NQ rises while VIX also rises). This is marked as a Divergence State (Orange), which issues a warning that the current trend may lack institutional support or become saturated.
Market States & Color Coding (Default Logic)
Secondary Asset Rising (Green): High pressure. For NQ/VIX, this is Bearish Pressure.
Secondary Asset Dumping (Red): High pressure. For NQ/VIX, this is Bullish Pressure.
Neutral (Gray): Momentum is flat; the market is likely in a range.
Divergence (Orange): The warning status. The two assets are moving together, indicating a potential bull/bear trap.
Core Calculation Settings:
Fully Adjustable Parameters
Secondary Ticker: Change the default "CBOE:VIX" to another asset (e.g., "DXY!" for Dollar or "MGC1! for gold").
Fast/Slow Lookbacks: Adjust the sensitivity of the momentum detection. Correlation Length: Adjust the window used to measure the strength of the relationship.
Sensitivity & Thresholds:
Momentum Sensitivity (%): The threshold for a movement to be considered "Rising" or "Dumping".
Divergence Threshold: Set how strict the correlation must be before an alert is triggered.
Visualization Settings:
Show Ribbon: Toggle the 15-line ribbon on/off.
Ribbon Offset (ATR Mult): Adjust how far below the candles the ribbon is positioned (Default: 6.0).
Full Color Control: Change the colors individually for all four market statuses.
Dashboard Settings:
Show/Hide Dashboard: Toggle the real-time data table on/off.
Dashboard Size: Choose between Tiny, Small, and Normal.
Dashboard Position: Move the table to one of the 4 corners or the bottom center. Versatility: Beyond NQ/VIX
Although optimized for NQ/VIX by default, you can adjust this tool for other markets:
Examples:
Gold Traders: Set the ticker to DXY to monitor the pressure of the US dollar on gold.
Crypto Traders: Set the ticker to DXY or USDT.D to monitor the pressure on Bitcoin.
Equity Traders: Set the ticker to VVIX for a "Volatility of Volatility" lead indicator.
Disclaimer & Risk Warning
This indicator is intended solely for educational and informational purposes. It does not provide financial advice, trading signals, or any guarantee of profit.
Trading in the Nasdaq 100 (NQ), VIX, and related financial instruments carries significant risks of loss and is not suitable for every investor. This tool is a decision-making aid, not an automated trading system. Performance can vary significantly by asset and timeframe. Always use good risk management, such as stop-loss orders, and never trade with capital that you cannot afford to lose.
Technical Overview
The Inverse Pressure Engine is a high-speed intraday execution and correlation engine. While it is configured by default for Nasdaq (NQ) and the VIX, its modular design allows it to be used for any asset pair that exhibits an inverse correlation.
NOTE: The colors in the ribbon are negatively correlated! A red ribbon means that the correlated asset (e.g., VIX) is dumping. This implies that the asset you are trading (e.g., NQ) should normally rise!
Core Components & Logic
1. The 15-Line "Breathing" Ribbon
This visual system uses 15 smoothed lines (SMA 20 to SMA 48) anchored below the price action.
Expansion (Fanning Out): Indicates accelerating momentum in the secondary asset (e.g., VIX). Contraction (Tightening): Indicates the secondary asset's momentum is stalling, often preceding a trend reversal in the primary asset (e.g., NQ).
Dynamic ATR Offset: The ribbon maintains a consistent visual distance from your candles across all timeframes (1m, 5m, 15m), ensuring it never blocks your price action.
2. Fast Momentum & Correlation Engine
Momentum: Calculates the Linear Regression Slope to provide a "speedometer" of volatility shifts. It reacts significantly faster than standard moving average crosses.
Inverse Correlation: Continuously monitors the logarithmic returns between the two assets. A healthy inverse relationship typically shows a correlation between -0.70 and -1.0.
3. Divergence Detection
The indicator identifies when the two assets are moving in the same direction (e.g., NQ rises while VIX also rises). This is marked as a Divergence State (Orange), which issues a warning that the current trend may lack institutional support or become saturated.
Market States & Color Coding (Default Logic)
Secondary Asset Rising (Green): High pressure. For NQ/VIX, this is Bearish Pressure.
Secondary Asset Dumping (Red): High pressure. For NQ/VIX, this is Bullish Pressure.
Neutral (Gray): Momentum is flat; the market is likely in a range.
Divergence (Orange): The warning status. The two assets are moving together, indicating a potential bull/bear trap.
Core Calculation Settings:
Fully Adjustable Parameters
Secondary Ticker: Change the default "CBOE:VIX" to another asset (e.g., "DXY!" for Dollar or "MGC1! for gold").
Fast/Slow Lookbacks: Adjust the sensitivity of the momentum detection. Correlation Length: Adjust the window used to measure the strength of the relationship.
Sensitivity & Thresholds:
Momentum Sensitivity (%): The threshold for a movement to be considered "Rising" or "Dumping".
Divergence Threshold: Set how strict the correlation must be before an alert is triggered.
Visualization Settings:
Show Ribbon: Toggle the 15-line ribbon on/off.
Ribbon Offset (ATR Mult): Adjust how far below the candles the ribbon is positioned (Default: 6.0).
Full Color Control: Change the colors individually for all four market statuses.
Dashboard Settings:
Show/Hide Dashboard: Toggle the real-time data table on/off.
Dashboard Size: Choose between Tiny, Small, and Normal.
Dashboard Position: Move the table to one of the 4 corners or the bottom center. Versatility: Beyond NQ/VIX
Although optimized for NQ/VIX by default, you can adjust this tool for other markets:
Examples:
Gold Traders: Set the ticker to DXY to monitor the pressure of the US dollar on gold.
Crypto Traders: Set the ticker to DXY or USDT.D to monitor the pressure on Bitcoin.
Equity Traders: Set the ticker to VVIX for a "Volatility of Volatility" lead indicator.
Disclaimer & Risk Warning
This indicator is intended solely for educational and informational purposes. It does not provide financial advice, trading signals, or any guarantee of profit.
Trading in the Nasdaq 100 (NQ), VIX, and related financial instruments carries significant risks of loss and is not suitable for every investor. This tool is a decision-making aid, not an automated trading system. Performance can vary significantly by asset and timeframe. Always use good risk management, such as stop-loss orders, and never trade with capital that you cannot afford to lose.
ملاحظات الأخبار
Update: Strategic Tuning for Scalping vs. Day TradingThe Inverse Pressure Engine is a modular system designed to adapt to your specific trading style. Whether you are scalping the 1-minute chart for quick "sweeps" or day trading the 15-minute trend, you can fine-tune the engine's sensitivity to match the market's current volatility.
Here is how to optimize the core settings for your specific strategy:
1. High-Speed Scalping (1m - 3m Charts)
Goal: Maximum activity, catching every minor momentum shift in the secondary asset (DXY/VIX).
Momentum Sensitivity (%): Set to 0.01 or 0.005.
Why: This creates a "hair-trigger" response. Even a tiny tick in the secondary asset will turn the ribbon Red or Green, virtually eliminating "Gray" neutral zones.
Divergence Threshold: Set to 0.85 or 0.90.
Why: For scalping, you don't want minor correlations to distract you. This setting keeps the ribbon in its momentum color unless the assets are moving in perfect lockstep, significantly reducing "Orange" warning zones.
Fast Lookback: Set to 3 or 5.
Why: A shorter lookback makes the momentum engine react within 1-2 bars of a shift, giving you the fastest possible bias.
2. Standard Day Trading (5m - 15m Charts)
Goal: Filtering out noise and identifying high-conviction trend moves.
Momentum Sensitivity (%): Set to 0.05 or 0.1.
Why: This ensures the ribbon only turns Red or Green when there is a significant move in the secondary asset. It keeps the ribbon "Gray" during choppy, low-volume periods to keep you out of bad trades.
Divergence Threshold: Set to 0.50 or 0.60.
Why: On higher timeframes, "Orange" warnings are more reliable. You want to know as soon as the inverse correlation starts to weaken so you can take profits or tighten your stop.
Fast Lookback: Set to 7 or 10.
Why: A slightly longer lookback smooths out the "breathing" ribbon, ensuring you stay in the trend for longer periods without getting "shaken out" by minor retracements.
Summary of Parameter Impact
Momentum Sensitivity (The "Gray Zone" Filter):
Lower value = More Red/Green (More active).
Higher value = More Gray (More conservative).
Divergence Threshold (The "Orange Zone" Filter):
Lower value = More Orange (More warnings).
Higher value = Less Orange (More trend focus).
Fast Lookback (The "Reaction Speed"):
Lower value = Faster reaction (Higher risk of noise).
Higher value = Smoother reaction (More reliable trends).
Trader's Note: There is no single "perfect" setting. We recommend starting with the default High-Activity settings (0.005 sensitivity) and slowly increasing the thresholds if you feel the ribbon is changing colors too frequently for your specific asset pair.
ملاحظات الأخبار
What's new:Acceleration Metric: The script now calculates the "slope of the slope." It tracks whether the current momentum is Increasing, Decreasing, or Flat.
Dashboard Integration: A new row titled "Acceleration" has been added to the dashboard.
Increasing (Bright Green): Momentum is gaining speed. This is your predictive signal that pressure is actively building before the ribbon might change.
Decreasing (Bright Red): Momentum is fading or reversing. This warns you that the current pressure is losing its "punch."
Flat (Gray): Momentum is stable or stagnant.
Predictive Value: If you see the ribbon is Gray (Neutral) but the Acceleration shows "Increasing," it means pressure is building under the surface and a color change is likely imminent.
ملاحظات الأخبار
Chart update!ملاحظات الأخبار
How to Use & Strategic Tuning for possible entry, tp levels or pullbacks.-IMPORTANT COLOR LOGIC: The ribbon follows the secondary asset's momentum!
-Red Ribbon (Support Up): Secondary asset is dumping $\rightarrow$ Bullish for your trade asset.
-Green Ribbon (Pressure Up): Secondary asset is rising $\rightarrow$ Bearish for your trade asset.
-Orange (Divergence): Warning. Assets are moving together.
-Gray (Neutral): Momentum is flat; stay on the sidelines.
-1. For Scalping (1m - 3m Charts)
Momentum Sensitivity: Set to 0.01 or 0.005 for "hair-trigger" reactions. (default 0.01)
Divergence Threshold: Set to 0.80+ to keep the ribbon in color longer and ignore minor noise. (Default 0.80)
Fast Lookback: Set to 3 or 5 for the fastest possible bias detection.
-2. For Day Trading (5m - 15m Charts)
Momentum Sensitivity: Set to 0.05 or 0.1 to filter out intraday "chop."
Divergence Threshold: Set to 0.50 or 0.60 to get early warnings when the inverse relationship weakens.
-Fast Lookback: Set to 7 or 10 for smoother, more reliable trend confirmation. (Default 5)
Disclaimer & Risk Warning
This indicator is for educational and informational purposes only. It does not provide financial advice or guaranteed trade signals. Trading involves significant risk of loss. The "Inverse Pressure Engine" is a decision-support tool; always use proper risk management and never trade with capital you cannot afford to lose.

إخلاء المسؤولية
لا يُقصد بالمعلومات والمنشورات أن تكون، أو تشكل، أي نصيحة مالية أو استثمارية أو تجارية أو أنواع أخرى من النصائح أو التوصيات المقدمة أو المعتمدة من TradingView. اقرأ المزيد في شروط الاستخدام.
إخلاء المسؤولية
لا يُقصد بالمعلومات والمنشورات أن تكون، أو تشكل، أي نصيحة مالية أو استثمارية أو تجارية أو أنواع أخرى من النصائح أو التوصيات المقدمة أو المعتمدة من TradingView. اقرأ المزيد في شروط الاستخدام.