OPEN-SOURCE SCRIPT
تم تحديثه QuantFlow: Precision Fibonacci VWAP

QuantFlow: Precision Fibonacci VWAP is a professional-grade institutional trading suite designed for traders who demand quantitative precision. By merging MIDAS (Multidaily Institutional Digital Analysis Support) volume-weighting with Gaussian statistical probability and Fibonacci expansion theory, this indicator provides a comprehensive map of market structure, volatility, and high-probability reversal zones.
█ The Quantitative Core
At the heart of QuantFlow Precison is a sophisticated calculation engine that goes beyond standard moving averages.
MIDAS Engine: Instead of a simple VWAP, QuantFlow Precision utilizes the MIDAS approach, calculating cumulative volume-weighted price from a specific "Anchor Point." This reveals the true average price where institutional orders are concentrated.
Adaptive Anchoring: The "Auto" mode intelligently detects your chart's timeframe to provide the most relevant anchor:
Scalping (1m–15m): Resets Daily to capture intraday liquidity flows.
Intraday (15m–1h): Resets Weekly to identify the current week's "Fair Value."
Swing (Daily+): Resets Monthly or Yearly for long-term trend benchmarks.
█ Strategic Volatility Bands
QuantFlow Precision generates 6 levels of Fibonacci-weighted bands based on volume-weighted standard deviation. These bands act as dynamic support and resistance that expand and contract with market volatility.
Inner Bands (Levels 1-2): Define the "Equilibrium Zone." Price remaining here indicates a ranging market or consolidation.
Expansion Bands (Levels 3-4): Represent confirmed trend momentum.
Extreme Bands (Levels 5-6): These are the 1.0 and 1.618 Fibonacci extensions. When price reaches these levels, it is entering a "statistical extreme," often preceding a sharp mean-reversion.
█ Gaussian Probability Dashboard
The real-time information table provides a professional "heads-up display" (HUD) of current market statistics:
Z-Score Analysis: Measures how many standard deviations the price has moved away from the mean. A Z-Score > 2.0 indicates a move that occurs less than 5% of the time, signaling a potential reversal.
Reversion Probability: Uses the 68-95-99.7 rule to estimate the statistical likelihood of price returning to the VWAP. When the probability hits 99%, the market is at a historical breaking point.
Distance %: Displays the exact percentage gap between current price and "Fair Value."
█ Visual Intelligence System
QuantFlow Precision is designed for high-speed decision-making with a high-contrast UI:
Fluor Green Candles: Confirmed bullish momentum (Price > Upper Fib 1).
Fluor Red Candles: Confirmed bearish momentum (Price < Lower Fib 1).
Grey Candles: Market is in "No-Man's Land" (Ranging within Fib 1/2).
Crossover Stars (★): Tiny star markers appear the moment price reclaims or loses the VWAP line, signaling an immediate shift in institutional control.
Extreme Sparkle Markers (✦): These high-contrast markers trigger when the price pierces the Level 6 (1.618) Fibonacci band. They represent statistical "exhaustion" points where the market has moved into the most extreme 1% of volatility, signaling a high-probability reversal zone.
Target Labels: Every Fibonacci level is labeled on the right side of the chart with its specific level and current price.
█ Trading Applications
The Scalper: Uses the Daily Auto Anchor to trade mean-reversions at the Level 6 sparkle (✦) markers during high-volatility sessions.
The Trend Trader: Enters on a Fluor Green/Red candle change and uses the MIDAS VWAP as a dynamic trailing stop.
The Swing Trader: Sets a Manual Anchor Date on a major news event (e.g., FOMC or Earnings) to track the long-term institutional volume profile.
This indicator is intended for educational and informational purposes only and should not be considered financial advice. Trading involves significant risk, and you should consult with a financial advisor before making any trading decisions. The performance of this indicator is not guaranteed, and past results do not predict future performance. Use at your own risk.
█ The Quantitative Core
At the heart of QuantFlow Precison is a sophisticated calculation engine that goes beyond standard moving averages.
MIDAS Engine: Instead of a simple VWAP, QuantFlow Precision utilizes the MIDAS approach, calculating cumulative volume-weighted price from a specific "Anchor Point." This reveals the true average price where institutional orders are concentrated.
Adaptive Anchoring: The "Auto" mode intelligently detects your chart's timeframe to provide the most relevant anchor:
Scalping (1m–15m): Resets Daily to capture intraday liquidity flows.
Intraday (15m–1h): Resets Weekly to identify the current week's "Fair Value."
Swing (Daily+): Resets Monthly or Yearly for long-term trend benchmarks.
█ Strategic Volatility Bands
QuantFlow Precision generates 6 levels of Fibonacci-weighted bands based on volume-weighted standard deviation. These bands act as dynamic support and resistance that expand and contract with market volatility.
Inner Bands (Levels 1-2): Define the "Equilibrium Zone." Price remaining here indicates a ranging market or consolidation.
Expansion Bands (Levels 3-4): Represent confirmed trend momentum.
Extreme Bands (Levels 5-6): These are the 1.0 and 1.618 Fibonacci extensions. When price reaches these levels, it is entering a "statistical extreme," often preceding a sharp mean-reversion.
█ Gaussian Probability Dashboard
The real-time information table provides a professional "heads-up display" (HUD) of current market statistics:
Z-Score Analysis: Measures how many standard deviations the price has moved away from the mean. A Z-Score > 2.0 indicates a move that occurs less than 5% of the time, signaling a potential reversal.
Reversion Probability: Uses the 68-95-99.7 rule to estimate the statistical likelihood of price returning to the VWAP. When the probability hits 99%, the market is at a historical breaking point.
Distance %: Displays the exact percentage gap between current price and "Fair Value."
█ Visual Intelligence System
QuantFlow Precision is designed for high-speed decision-making with a high-contrast UI:
Fluor Green Candles: Confirmed bullish momentum (Price > Upper Fib 1).
Fluor Red Candles: Confirmed bearish momentum (Price < Lower Fib 1).
Grey Candles: Market is in "No-Man's Land" (Ranging within Fib 1/2).
Crossover Stars (★): Tiny star markers appear the moment price reclaims or loses the VWAP line, signaling an immediate shift in institutional control.
Extreme Sparkle Markers (✦): These high-contrast markers trigger when the price pierces the Level 6 (1.618) Fibonacci band. They represent statistical "exhaustion" points where the market has moved into the most extreme 1% of volatility, signaling a high-probability reversal zone.
Target Labels: Every Fibonacci level is labeled on the right side of the chart with its specific level and current price.
█ Trading Applications
The Scalper: Uses the Daily Auto Anchor to trade mean-reversions at the Level 6 sparkle (✦) markers during high-volatility sessions.
The Trend Trader: Enters on a Fluor Green/Red candle change and uses the MIDAS VWAP as a dynamic trailing stop.
The Swing Trader: Sets a Manual Anchor Date on a major news event (e.g., FOMC or Earnings) to track the long-term institutional volume profile.
This indicator is intended for educational and informational purposes only and should not be considered financial advice. Trading involves significant risk, and you should consult with a financial advisor before making any trading decisions. The performance of this indicator is not guaranteed, and past results do not predict future performance. Use at your own risk.
ملاحظات الأخبار
Chart update!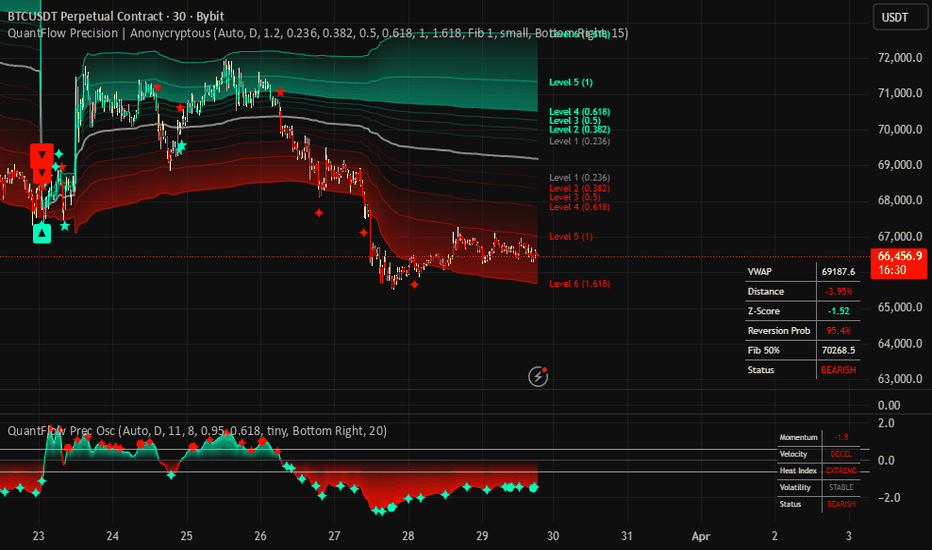
Usefull Oscillator as standalone confluence or combined with the Quantflow: Precision Fibonacci VWAP
ملاحظات الأخبار
Chart update!!ملاحظات الأخبار
How to use: █ Institutional Fair Value & Velocity Analysis
The QuantFlow VWAP is a dual-purpose engine. On Lower Timeframes (LTF), it acts as a high-speed mean-reversion tool. On Higher Timeframes (HTF), it serves as the ultimate institutional trend benchmark.
█ Lower Timeframe Strategy (1m – 15m)
Scalping and Intraday Momentum
The Entry Confirmation (★): On the 1m–5m charts, look for the Bullish/Bearish Star (★). This signals that price has reclaimed the "Institutional Fair Value" (VWAP) with volume. Confirm the candle has flipped to Fluor Green/Red.
The Reversion Play (✦): If price hits the Level 6 (1.618) Fibonacci Band and a Sparkle (✦) appears, check the Dashboard. If Reversion Prob is >99%, expect a snap-back move to the VWAP line.
Avoiding the Chop: If the candles are Grey, the market is in equilibrium. Do not enter new trades; wait for a breakout star (★) to confirm a direction.
█ Higher Timeframe Strategy (1H – Daily)
Swing Trading and Macro Trend Identification
Determining the Bias: If candles are Fluor Green and staying above the VWAP, the macro bias is bullish. Institutional players are "buying the dip" at the VWAP line.
The Institutional Anchor: For long-term moves, set your Anchor Method to "Auto" or a specific Manual Date (like the start of the Month or Year). This shows you the true volume-weighted cost basis for the entire period.
Risk Management: Use the MIDAS VWAP line as your definitive stop-loss or "Trend Invalidation" level. As long as price remains above/below the line, the trend is technically intact.
Macro Targets: Use the Level 5 (1.0) and Level 6 (1.618) bands as your ultimate Take-Profit zones for swing positions.
█ Dashboard HUD: Professional Decision Making
Z-Score: If Z-Score is >2.0 or <-2.0, the move is statistically rare. Prepare for a trend pause.
Reversion Prob: Use this to filter out bad entries. Never go long if the prob is >95% (Fluor Red) at the top bands; you are buying the statistical peak.
Status: Instantly tells you if the market is BULLISH, BEARISH, or RANGING based on the 0.236 Fibonacci "Filter Zone."
Summary:
LTF: Trade the Sparks and Stars for quick entries/exits.
HTF: Use the Candle Colors and VWAP Line to ride macro institutional flows combinated with the sparks and stars.
نص برمجي مفتوح المصدر
بروح TradingView الحقيقية، قام مبتكر هذا النص البرمجي بجعله مفتوح المصدر، بحيث يمكن للمتداولين مراجعة وظائفه والتحقق منها. شكرا للمؤلف! بينما يمكنك استخدامه مجانًا، تذكر أن إعادة نشر الكود يخضع لقواعد الموقع الخاصة بنا.

إخلاء المسؤولية
لا يُقصد بالمعلومات والمنشورات أن تكون، أو تشكل، أي نصيحة مالية أو استثمارية أو تجارية أو أنواع أخرى من النصائح أو التوصيات المقدمة أو المعتمدة من TradingView. اقرأ المزيد في شروط الاستخدام.
نص برمجي مفتوح المصدر
بروح TradingView الحقيقية، قام مبتكر هذا النص البرمجي بجعله مفتوح المصدر، بحيث يمكن للمتداولين مراجعة وظائفه والتحقق منها. شكرا للمؤلف! بينما يمكنك استخدامه مجانًا، تذكر أن إعادة نشر الكود يخضع لقواعد الموقع الخاصة بنا.
إخلاء المسؤولية
لا يُقصد بالمعلومات والمنشورات أن تكون، أو تشكل، أي نصيحة مالية أو استثمارية أو تجارية أو أنواع أخرى من النصائح أو التوصيات المقدمة أو المعتمدة من TradingView. اقرأ المزيد في شروط الاستخدام.