Cost-to-Range Gauge [BSL]
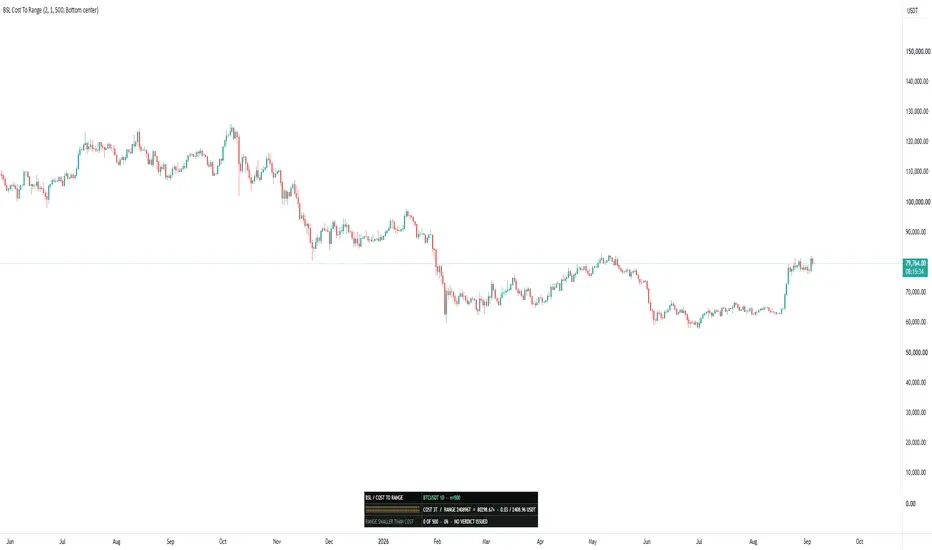
Before asking whether a method works on this chart, there is an earlier
question that almost nobody asks: can a result exist here at all?
Cost-to-Range Gauge [BSL] answers it with one drawing. A twenty-cell bar
represents the typical range of the last 500 confirmed bars. The filled part
of it is your round-trip cost. If the fill takes up a quarter of the bar, the
typical bar is four round trips wide. If it fills the whole thing, the typical
bar cannot pay for a single trade.
Under the drawing sits the number that goes with it: how many bars in the
window could not have covered one round turn at all.
WHY THE COST IS DRAWN AND NOT DESCRIBED
"Your cost is 3 ticks and the typical range is 12.6 ticks" is a sentence you
have to do arithmetic on. A bar with a quarter of it filled is a picture you
have already understood.
The ratio is printed as well, and it goes range divided by cost: above 1, the
typical bar covers a round turn. At or below 1 the drawing fills completely
and turns red, and the panel adds that the cost exceeds the typical range,
because a full bar on its own could be read as the drawing running out of room
rather than as the answer.
A bar whose entire range is smaller than the cost could not have paid for a
trade taken inside it, whichever direction that trade went. That is what the
count underneath is counting.
BOTH INPUTS ARE IN TICKS, ON PURPOSE
Every instrument on TradingView has a tick size, so ticks convert to price
everywhere. Not every instrument has a currency value per point. That figure
is missing for whole classes of symbol.
If the commission were entered in currency, the entire gauge would go dark on
any symbol without one. Taking both inputs in ticks means the price-space
reading always works, and the currency line is the only thing ever withheld.
It is withheld rather than guessed, and the panel says so where it would
otherwise have appeared.
If you have a figure in currency, divide it by the currency value of one tick.
The commission field is the WHOLE ROUND TURN, not one side. Enter one side and
you have halved your own cost; the script cannot detect it and will faithfully
report a flattering number.
The cost is your declaration. Nothing here can verify it.
A total cost of zero is refused. A ratio against zero is not a large number,
it is not a number, and the panel asks for a cost instead of printing
infinity.
WHAT THE RATIO LOOKS LIKE ON A DAILY CHART
Large. A daily bar is worth many round trips on any liquid instrument, so the
drawing fills a sliver and the ratio runs into the hundreds or thousands. That
is the correct answer to the question, and it is the answer you want before
committing to a timeframe. The gauge earns its keep further down, on the
intraday charts where a bar and a round trip are comparable and the fill is no
longer a sliver.
WHAT IS IN THE WINDOW
Confirmed bars only. The bar still forming is left out and named as pending.
Every reading on this panel is complete the moment a bar closes: a bar's range
is finished at its close, and none of these numbers is waiting on an outcome.
That means all rows share one cutoff, the last confirmed bar, and the only
unfinished observation on the whole chart is the bar still open.
That is the simplest possible case of a rule this family applies everywhere,
and it is stated rather than skipped. A rule mentioned only when it bites is a
rule you cannot check.
Below 100 bars the whole gauge is faded and prints its own sample size, so a
reading taken over 40 bars never looks as solid as one taken over 500.
WHAT YOU ENTER
- Spread: 2.0 ticks
- Commission per round turn: 1.0 ticks
- Window: 500 confirmed bars
- Panel position: Bottom center
Six positions are available and the gauge begins at the bottom center. Both
left corners are spoken for by the platform, the legend above and the
TradingView logo below, and the right is where the price scale and most other
panels crowd.
A BRICK'S RANGE IS A SETTING, NOT A FACT
A Renko brick has the range you told it to have. Its size is a setting, not a
market fact, so a cost-to-range ratio measured against it is a ratio against
your own configuration. The same applies to Heikin Ashi, Kagi, Point & Figure
and Range charts.
On those chart types the drawing, the ratio and the published values all stop.
THREE VALUES FOR OTHER SCRIPTS
Three values are published for other indicators to pick up in their Source
setting: the range-to-cost ratio, the share of bars under cost, and the sample
size. All three are descriptions, not events. They change gradually and mean
something on every bar, rather than firing at a moment. Before the gauge has
an opinion they carry no value at all, which is not the same as a value of
zero.
The alert condition is listed beside them and is not a reading. The gauge
draws only its table, which cannot be selected, so these three are the whole
readable surface.
WHAT IT WILL NOT TELL YOU
No verdict. Not "tradeable", not "avoid", not a traffic light. The single
colour change on the panel, the drawing turning red, restates the number
beside it and adds no judgement to it, because the judgement depends on a
method this script has never seen.
It issues no events and stamps nothing at an event bar. It is a screen you run
before a method, and calling any of its readings a signal would be the exact
overreach it exists to argue against.
It contains no equity curve, no fill model and no slippage simulation. What
costs do to a result under realistic fills belongs to Execution-Aware Trend
[BSL]; how a hit rate responds to a cost belongs to Signal Audit Lab [BSL].
This answers only whether a result can exist at all, and that is asked before
either of them.
This tool compares a cost you declare against typical bar size. It does not
predict price, guarantee performance or provide trading advice. Validate the
behaviour on your own symbols, timeframes and execution assumptions before
making decisions.
Open-source Pine Script® v6. Educational use only.
question that almost nobody asks: can a result exist here at all?
Cost-to-Range Gauge [BSL] answers it with one drawing. A twenty-cell bar
represents the typical range of the last 500 confirmed bars. The filled part
of it is your round-trip cost. If the fill takes up a quarter of the bar, the
typical bar is four round trips wide. If it fills the whole thing, the typical
bar cannot pay for a single trade.
Under the drawing sits the number that goes with it: how many bars in the
window could not have covered one round turn at all.
WHY THE COST IS DRAWN AND NOT DESCRIBED
"Your cost is 3 ticks and the typical range is 12.6 ticks" is a sentence you
have to do arithmetic on. A bar with a quarter of it filled is a picture you
have already understood.
The ratio is printed as well, and it goes range divided by cost: above 1, the
typical bar covers a round turn. At or below 1 the drawing fills completely
and turns red, and the panel adds that the cost exceeds the typical range,
because a full bar on its own could be read as the drawing running out of room
rather than as the answer.
A bar whose entire range is smaller than the cost could not have paid for a
trade taken inside it, whichever direction that trade went. That is what the
count underneath is counting.
BOTH INPUTS ARE IN TICKS, ON PURPOSE
Every instrument on TradingView has a tick size, so ticks convert to price
everywhere. Not every instrument has a currency value per point. That figure
is missing for whole classes of symbol.
If the commission were entered in currency, the entire gauge would go dark on
any symbol without one. Taking both inputs in ticks means the price-space
reading always works, and the currency line is the only thing ever withheld.
It is withheld rather than guessed, and the panel says so where it would
otherwise have appeared.
If you have a figure in currency, divide it by the currency value of one tick.
The commission field is the WHOLE ROUND TURN, not one side. Enter one side and
you have halved your own cost; the script cannot detect it and will faithfully
report a flattering number.
The cost is your declaration. Nothing here can verify it.
A total cost of zero is refused. A ratio against zero is not a large number,
it is not a number, and the panel asks for a cost instead of printing
infinity.
WHAT THE RATIO LOOKS LIKE ON A DAILY CHART
Large. A daily bar is worth many round trips on any liquid instrument, so the
drawing fills a sliver and the ratio runs into the hundreds or thousands. That
is the correct answer to the question, and it is the answer you want before
committing to a timeframe. The gauge earns its keep further down, on the
intraday charts where a bar and a round trip are comparable and the fill is no
longer a sliver.
WHAT IS IN THE WINDOW
Confirmed bars only. The bar still forming is left out and named as pending.
Every reading on this panel is complete the moment a bar closes: a bar's range
is finished at its close, and none of these numbers is waiting on an outcome.
That means all rows share one cutoff, the last confirmed bar, and the only
unfinished observation on the whole chart is the bar still open.
That is the simplest possible case of a rule this family applies everywhere,
and it is stated rather than skipped. A rule mentioned only when it bites is a
rule you cannot check.
Below 100 bars the whole gauge is faded and prints its own sample size, so a
reading taken over 40 bars never looks as solid as one taken over 500.
WHAT YOU ENTER
- Spread: 2.0 ticks
- Commission per round turn: 1.0 ticks
- Window: 500 confirmed bars
- Panel position: Bottom center
Six positions are available and the gauge begins at the bottom center. Both
left corners are spoken for by the platform, the legend above and the
TradingView logo below, and the right is where the price scale and most other
panels crowd.
A BRICK'S RANGE IS A SETTING, NOT A FACT
A Renko brick has the range you told it to have. Its size is a setting, not a
market fact, so a cost-to-range ratio measured against it is a ratio against
your own configuration. The same applies to Heikin Ashi, Kagi, Point & Figure
and Range charts.
On those chart types the drawing, the ratio and the published values all stop.
THREE VALUES FOR OTHER SCRIPTS
Three values are published for other indicators to pick up in their Source
setting: the range-to-cost ratio, the share of bars under cost, and the sample
size. All three are descriptions, not events. They change gradually and mean
something on every bar, rather than firing at a moment. Before the gauge has
an opinion they carry no value at all, which is not the same as a value of
zero.
The alert condition is listed beside them and is not a reading. The gauge
draws only its table, which cannot be selected, so these three are the whole
readable surface.
WHAT IT WILL NOT TELL YOU
No verdict. Not "tradeable", not "avoid", not a traffic light. The single
colour change on the panel, the drawing turning red, restates the number
beside it and adds no judgement to it, because the judgement depends on a
method this script has never seen.
It issues no events and stamps nothing at an event bar. It is a screen you run
before a method, and calling any of its readings a signal would be the exact
overreach it exists to argue against.
It contains no equity curve, no fill model and no slippage simulation. What
costs do to a result under realistic fills belongs to Execution-Aware Trend
[BSL]; how a hit rate responds to a cost belongs to Signal Audit Lab [BSL].
This answers only whether a result can exist at all, and that is asked before
either of them.
This tool compares a cost you declare against typical bar size. It does not
predict price, guarantee performance or provide trading advice. Validate the
behaviour on your own symbols, timeframes and execution assumptions before
making decisions.
Open-source Pine Script® v6. Educational use only.

إخلاء المسؤولية
لا يُقصد بالمعلومات والمنشورات أن تكون، أو تشكل، أي نصيحة مالية أو استثمارية أو تجارية أو أنواع أخرى من النصائح أو التوصيات المقدمة أو المعتمدة من TradingView. اقرأ المزيد في شروط الاستخدام.
إخلاء المسؤولية
لا يُقصد بالمعلومات والمنشورات أن تكون، أو تشكل، أي نصيحة مالية أو استثمارية أو تجارية أو أنواع أخرى من النصائح أو التوصيات المقدمة أو المعتمدة من TradingView. اقرأ المزيد في شروط الاستخدام.