Financials Dashboard - Financials Margins
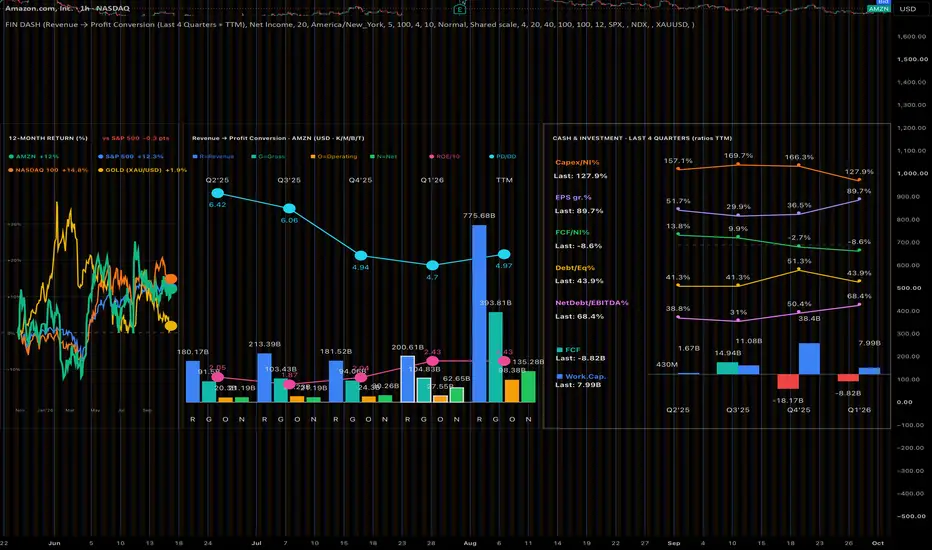
FINANCIALS DASHBOARD · Returns + Financials + Margins
■ WHAT IS THIS?
A one-glance health check for a stock: three small dashboards in one pane under your chart:
1) Is the stock beating the market, the currency and gold?
2) How are revenue and profit developing, quarter by quarter?
3) Is the company turning profit into cash, and how heavy is its debt?
■ AIM
It turns reported numbers (revenue, net income, free cash flow, debt...) into simple columns and lines so you can see a company's direction at a glance. No buy/sell signals, nothing drawn on the price itself.
■ WHAT YOU SEE (left to right)
LEFT – Returns chart: the stock and three comparison assets (default: S&P 500, Nasdaq 100, Gold XAU/USD) all start at 0% N months ago (default 12). The lines show cumulative % return, so you see who is ahead. The label at the top right shows how many points the stock is ahead of / behind Comparison 1.
MIDDLE – Financial columns:
• View 1: four groups Q1, Q2, Q3, Q4 – each shows the last 3 years of the same quarter side by side (oldest to newest), plus a TTM column (trailing twelve months). Choose what to show with "Metric": Revenue, Gross Profit, Operating Income, Pre-tax Income, EBITDA, Net Income, Free Cash Flow, or margins (Gross, Operating, EBITDA, Net, Net/Operating).
• View 2: the last 4 quarters, each with Revenue / Gross / Operating / Net columns, so you can see how much of the revenue survives down to net profit.
• Two lines: ROE/10 (profitability on equity) and P/B (price to book).
RIGHT – Cash & investment (last 2-8 quarters):
• Columns: Free Cash Flow and Net Working Capital (current assets minus current liabilities).
• Lines (each in its own band): Capex / Net Income % · EPS growth % (year over year) · FCF / Net Income % · Debt / Equity % · Net Debt / EBITDA %.
Large numbers: K = thousand, M = million, B = billion, T = trillion.
■ QUICK START
1. Open a STOCK chart (Daily or Weekly works best – the script needs enough chart history to see past reports).
2. Add the indicator. It opens in its own pane; drag the pane taller to read the labels comfortably.
3. Scroll/zoom to the area you want; the dashboard stretches to the visible bars (if it does not refresh, toggle the indicator off/on once).
4. Open Settings and adjust only what you need.
■ SETTINGS IN PLAIN WORDS
View: choose View 1 or View 2, the Metric (View 1), the Reporting lag and the Time zone.
• Reporting lag (days): companies publish results some weeks after a quarter ends. The script uses this lag to decide which quarter a number belongs to. Default 20 is a good start; if the Q labels look one quarter off, change it (try -15 if the data shows on the quarter-end date).
• Time zone: used for dates and month labels (default America/New_York – set yours).
Style / Colors: stretch to screen, column width, gaps, label size, value labels, colors.
Lines (ROE/10 and P/B): show or hide each line; "Separate bands" keeps both readable, "Shared scale" compares their real levels.
Right Panel: show or hide, number of quarters (2-8), colors, value labels.
Layout: width of the left and middle panels (the rest goes to the right panel).
Returns Chart: on/off, lookback months, and the three comparison symbols (click the symbol box and pick any index, currency, commodity or crypto). Leave the name box empty for an automatic name.
■ KEEP IT AT THE BOTTOM OF THE MAIN CHART (optional)
By default the dashboard lives in its own pane. To put it on the main chart, pinned to the bottom of the screen at any zoom or scroll:
1. Click the indicator's "..." (More) menu > Move to > Existing pane above (main pane).
2. Open the "Pin to scale" menu on the indicator and choose "No scale". The dashboard no longer depends on the price scale.
3. In the settings > Layout set "Dashboard height (% of pane)" to about 30-40 and lower the "Panel background transparency" to 10-30.
4. Chart settings > Scales and lines > Scale margins > Bottom: set about the same % so candles stay above the dashboard.
To draw it above other indicators: "..." menu > Visual order > Bring to front.
■ GOOD TO KNOW
• Data comes from TradingView's financial data (request.financial). Some symbols have missing or delayed items – then that column or line is simply empty. ETFs, crypto and forex have no financial statements and will show "No financial data found".
• ROE here = EPS (TTM) / Book value per share × 100, drawn divided by 10 so it fits the columns. P/B = close / book value per share.
• Defaults: S&P 500 (SP:SPX), Nasdaq 100 (NASDAQ:NDX) and XAU/USD, time zone America/New_York. The dashboard works for any stock with financial data on TradingView – just change the comparison symbols and the time zone.
• No alerts or signals. Education only, not financial advice.
■ SUMMARY
Three panels, one pane: returns vs benchmarks, quarterly financials with margins, and cash/debt quality. Use it to quickly judge whether a company is growing, profitable, cash-generating and not over-indebted.
■ WHAT IS THIS?
A one-glance health check for a stock: three small dashboards in one pane under your chart:
1) Is the stock beating the market, the currency and gold?
2) How are revenue and profit developing, quarter by quarter?
3) Is the company turning profit into cash, and how heavy is its debt?
■ AIM
It turns reported numbers (revenue, net income, free cash flow, debt...) into simple columns and lines so you can see a company's direction at a glance. No buy/sell signals, nothing drawn on the price itself.
■ WHAT YOU SEE (left to right)
LEFT – Returns chart: the stock and three comparison assets (default: S&P 500, Nasdaq 100, Gold XAU/USD) all start at 0% N months ago (default 12). The lines show cumulative % return, so you see who is ahead. The label at the top right shows how many points the stock is ahead of / behind Comparison 1.
MIDDLE – Financial columns:
• View 1: four groups Q1, Q2, Q3, Q4 – each shows the last 3 years of the same quarter side by side (oldest to newest), plus a TTM column (trailing twelve months). Choose what to show with "Metric": Revenue, Gross Profit, Operating Income, Pre-tax Income, EBITDA, Net Income, Free Cash Flow, or margins (Gross, Operating, EBITDA, Net, Net/Operating).
• View 2: the last 4 quarters, each with Revenue / Gross / Operating / Net columns, so you can see how much of the revenue survives down to net profit.
• Two lines: ROE/10 (profitability on equity) and P/B (price to book).
RIGHT – Cash & investment (last 2-8 quarters):
• Columns: Free Cash Flow and Net Working Capital (current assets minus current liabilities).
• Lines (each in its own band): Capex / Net Income % · EPS growth % (year over year) · FCF / Net Income % · Debt / Equity % · Net Debt / EBITDA %.
Large numbers: K = thousand, M = million, B = billion, T = trillion.
■ QUICK START
1. Open a STOCK chart (Daily or Weekly works best – the script needs enough chart history to see past reports).
2. Add the indicator. It opens in its own pane; drag the pane taller to read the labels comfortably.
3. Scroll/zoom to the area you want; the dashboard stretches to the visible bars (if it does not refresh, toggle the indicator off/on once).
4. Open Settings and adjust only what you need.
■ SETTINGS IN PLAIN WORDS
View: choose View 1 or View 2, the Metric (View 1), the Reporting lag and the Time zone.
• Reporting lag (days): companies publish results some weeks after a quarter ends. The script uses this lag to decide which quarter a number belongs to. Default 20 is a good start; if the Q labels look one quarter off, change it (try -15 if the data shows on the quarter-end date).
• Time zone: used for dates and month labels (default America/New_York – set yours).
Style / Colors: stretch to screen, column width, gaps, label size, value labels, colors.
Lines (ROE/10 and P/B): show or hide each line; "Separate bands" keeps both readable, "Shared scale" compares their real levels.
Right Panel: show or hide, number of quarters (2-8), colors, value labels.
Layout: width of the left and middle panels (the rest goes to the right panel).
Returns Chart: on/off, lookback months, and the three comparison symbols (click the symbol box and pick any index, currency, commodity or crypto). Leave the name box empty for an automatic name.
■ KEEP IT AT THE BOTTOM OF THE MAIN CHART (optional)
By default the dashboard lives in its own pane. To put it on the main chart, pinned to the bottom of the screen at any zoom or scroll:
1. Click the indicator's "..." (More) menu > Move to > Existing pane above (main pane).
2. Open the "Pin to scale" menu on the indicator and choose "No scale". The dashboard no longer depends on the price scale.
3. In the settings > Layout set "Dashboard height (% of pane)" to about 30-40 and lower the "Panel background transparency" to 10-30.
4. Chart settings > Scales and lines > Scale margins > Bottom: set about the same % so candles stay above the dashboard.
To draw it above other indicators: "..." menu > Visual order > Bring to front.
■ GOOD TO KNOW
• Data comes from TradingView's financial data (request.financial). Some symbols have missing or delayed items – then that column or line is simply empty. ETFs, crypto and forex have no financial statements and will show "No financial data found".
• ROE here = EPS (TTM) / Book value per share × 100, drawn divided by 10 so it fits the columns. P/B = close / book value per share.
• Defaults: S&P 500 (SP:SPX), Nasdaq 100 (NASDAQ:NDX) and XAU/USD, time zone America/New_York. The dashboard works for any stock with financial data on TradingView – just change the comparison symbols and the time zone.
• No alerts or signals. Education only, not financial advice.
■ SUMMARY
Three panels, one pane: returns vs benchmarks, quarterly financials with margins, and cash/debt quality. Use it to quickly judge whether a company is growing, profitable, cash-generating and not over-indebted.

إخلاء المسؤولية
لا يُقصد بالمعلومات والمنشورات أن تكون، أو تشكل، أي نصيحة مالية أو استثمارية أو تجارية أو أنواع أخرى من النصائح أو التوصيات المقدمة أو المعتمدة من TradingView. اقرأ المزيد في شروط الاستخدام.
إخلاء المسؤولية
لا يُقصد بالمعلومات والمنشورات أن تكون، أو تشكل، أي نصيحة مالية أو استثمارية أو تجارية أو أنواع أخرى من النصائح أو التوصيات المقدمة أو المعتمدة من TradingView. اقرأ المزيد في شروط الاستخدام.