High-Probability Entry System by Dahhans,DfirstX
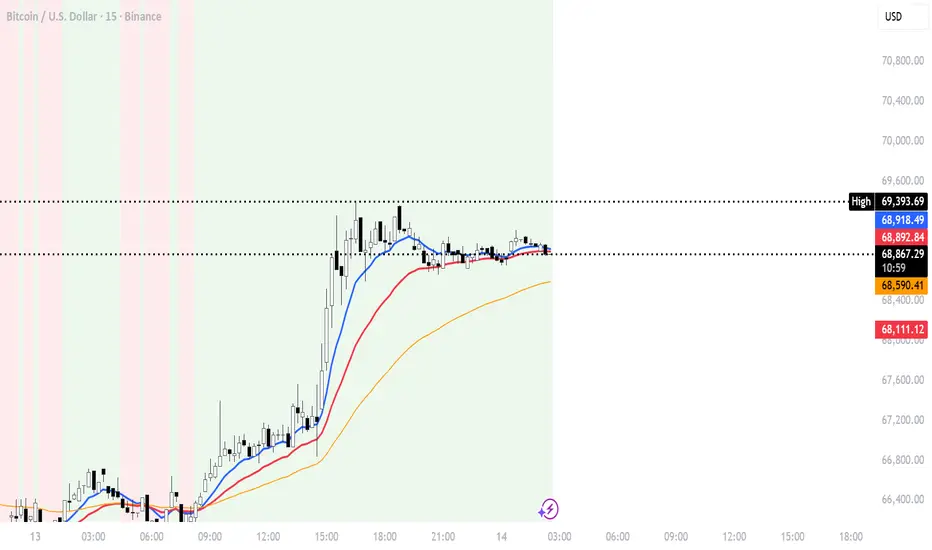
🎯 WHAT IT DOES
This indicator combines 4 different factors to identify high-probability trade entries. It only shows a signal when ALL conditions align, filtering out weak setups.
🔧 HOW IT WORKS (4 FACTORS)
| Factor | What It Measures | Long Signal | Short Signal |
| --------------- | --------------------- | ---------------------------- | -------------------------------- |
| 1. Trend | Price vs 50 EMA | Price > 50 EMA ✅ | Price < 50 EMA ✅ |
| 2. EMA Cross | 9 EMA crossing 21 EMA | 9 crosses ABOVE 21 ✅ | 9 crosses BELOW 21 ✅ |
| 3. RSI Momentum | RSI direction | RSI turning UP from oversold | RSI turning DOWN from overbought |
| 4. Confirmation | Price vs both EMAs | Price > both EMAs | Price < both EMAs |
📈 VISUALS
| Visual | Meaning |
| ---------------- | --------------------------------------------- |
| Green Background | Uptrend (price above 50 EMA) |
| Red Background | Downtrend (price below 50 EMA) |
| BUY Label | All 4 conditions met - high probability long |
| SELL Label | All 4 conditions met - high probability short |
| Red Line | Stop loss level |
| Blue Line | 9 EMA (fast) |
| Red Line | 21 EMA (slow) |
| Orange Line | 50 EMA (trend) |
🎯 SCORE SYSTEM (0-4)
| Score | Meaning |
| ----- | -------------------------------------- |
| 4/4 | Perfect alignment - HIGH probability |
| 3/4 | Strong setup - good to trade |
| 2/4 | Weak setup - avoid or smaller position |
| 0-1/4 | No trade |
Only trade when score is 3 or 4.
🛑 RISK MANAGEMENT
• Stop Loss: Automatically calculated using ATR (2x ATR below entry for longs)
• Position Sizing: Risk 1-2% per trade
• Never trade against the trend
⚠️ WHEN IT FAILS
| Market Condition | Why It Fails |
| ---------------- | ------------------------------------ |
| Sideways/Choppy | EMA crosses but no trend |
| Low Volume | Signals but no follow-through |
| News Events | Gap moves skip stop loss |
| Over-optimized | Works on historical data, not future |
📋 EXAMPLE TRADE
BTC at $67,000
├── Price > 50 EMA ($65,000) ✅ TREND
├── 9 EMA crosses above 21 EMA ✅ CROSS
├── RSI turning up from 35 ✅ MOMENTUM
└── Price > both EMAs ✅ CONFIRMATION
RESULT: BUY signal at $67,000
STOP: $64,500 (2x ATR)
TARGET: $70,000+
🎯 BEST TIMEFRAMES
| Timeframe | Quality |
| --------- | -------------------------------- |
| Daily | Best signals (less noise) |
| 4H | Good balance |
| 1H | More signals, more false signals |
📚 KEY CONCEPTS USED
| Concept | Explanation |
| ------------- | ------------------------------------------------------ |
| EMA (9/21/50) | Moving averages - 9 is fast, 21 is medium, 50 is trend |
| RSI | Momentum oscillator - measures overbought/oversold |
| ATR | Volatility measure - used for stop loss |
| Confluence | Multiple factors agreeing = higher probability |
This indicator is designed to filter out noise and only show you trades when the odds are in your favor.
This indicator combines 4 different factors to identify high-probability trade entries. It only shows a signal when ALL conditions align, filtering out weak setups.
🔧 HOW IT WORKS (4 FACTORS)
| Factor | What It Measures | Long Signal | Short Signal |
| --------------- | --------------------- | ---------------------------- | -------------------------------- |
| 1. Trend | Price vs 50 EMA | Price > 50 EMA ✅ | Price < 50 EMA ✅ |
| 2. EMA Cross | 9 EMA crossing 21 EMA | 9 crosses ABOVE 21 ✅ | 9 crosses BELOW 21 ✅ |
| 3. RSI Momentum | RSI direction | RSI turning UP from oversold | RSI turning DOWN from overbought |
| 4. Confirmation | Price vs both EMAs | Price > both EMAs | Price < both EMAs |
📈 VISUALS
| Visual | Meaning |
| ---------------- | --------------------------------------------- |
| Green Background | Uptrend (price above 50 EMA) |
| Red Background | Downtrend (price below 50 EMA) |
| BUY Label | All 4 conditions met - high probability long |
| SELL Label | All 4 conditions met - high probability short |
| Red Line | Stop loss level |
| Blue Line | 9 EMA (fast) |
| Red Line | 21 EMA (slow) |
| Orange Line | 50 EMA (trend) |
🎯 SCORE SYSTEM (0-4)
| Score | Meaning |
| ----- | -------------------------------------- |
| 4/4 | Perfect alignment - HIGH probability |
| 3/4 | Strong setup - good to trade |
| 2/4 | Weak setup - avoid or smaller position |
| 0-1/4 | No trade |
Only trade when score is 3 or 4.
🛑 RISK MANAGEMENT
• Stop Loss: Automatically calculated using ATR (2x ATR below entry for longs)
• Position Sizing: Risk 1-2% per trade
• Never trade against the trend
⚠️ WHEN IT FAILS
| Market Condition | Why It Fails |
| ---------------- | ------------------------------------ |
| Sideways/Choppy | EMA crosses but no trend |
| Low Volume | Signals but no follow-through |
| News Events | Gap moves skip stop loss |
| Over-optimized | Works on historical data, not future |
📋 EXAMPLE TRADE
BTC at $67,000
├── Price > 50 EMA ($65,000) ✅ TREND
├── 9 EMA crosses above 21 EMA ✅ CROSS
├── RSI turning up from 35 ✅ MOMENTUM
└── Price > both EMAs ✅ CONFIRMATION
RESULT: BUY signal at $67,000
STOP: $64,500 (2x ATR)
TARGET: $70,000+
🎯 BEST TIMEFRAMES
| Timeframe | Quality |
| --------- | -------------------------------- |
| Daily | Best signals (less noise) |
| 4H | Good balance |
| 1H | More signals, more false signals |
📚 KEY CONCEPTS USED
| Concept | Explanation |
| ------------- | ------------------------------------------------------ |
| EMA (9/21/50) | Moving averages - 9 is fast, 21 is medium, 50 is trend |
| RSI | Momentum oscillator - measures overbought/oversold |
| ATR | Volatility measure - used for stop loss |
| Confluence | Multiple factors agreeing = higher probability |
This indicator is designed to filter out noise and only show you trades when the odds are in your favor.

إخلاء المسؤولية
لا يُقصد بالمعلومات والمنشورات أن تكون، أو تشكل، أي نصيحة مالية أو استثمارية أو تجارية أو أنواع أخرى من النصائح أو التوصيات المقدمة أو المعتمدة من TradingView. اقرأ المزيد في شروط الاستخدام.
إخلاء المسؤولية
لا يُقصد بالمعلومات والمنشورات أن تكون، أو تشكل، أي نصيحة مالية أو استثمارية أو تجارية أو أنواع أخرى من النصائح أو التوصيات المقدمة أو المعتمدة من TradingView. اقرأ المزيد في شروط الاستخدام.