OPEN-SOURCE SCRIPT
Prism Orderflow Detector [JOAT]
Prism Orderflow Detector [JOAT]
Introduction
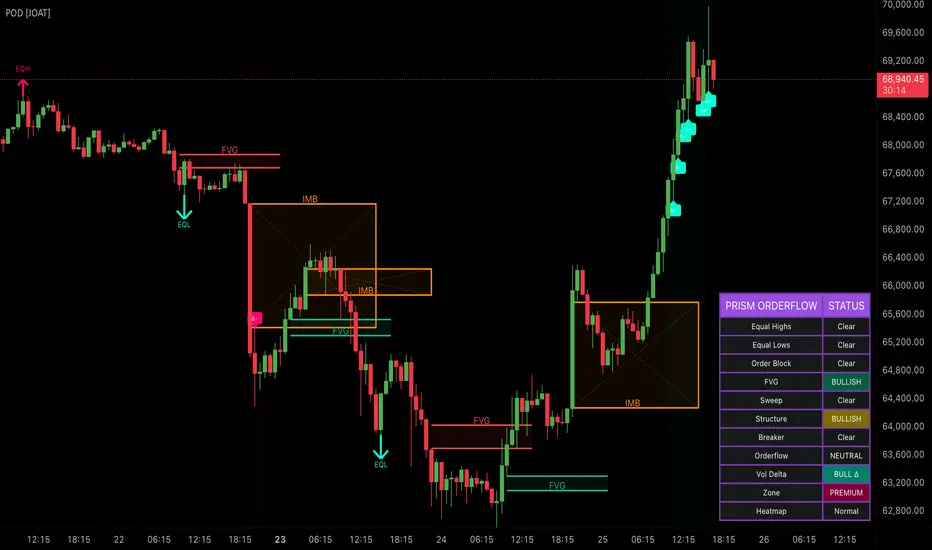
The Prism Orderflow Detector is an open-source institutional liquidity and order flow system that combines Smart Money Concepts (SMC), liquidity pool detection, Fair Value Gap analysis, Order Block identification, and advanced orderflow strength measurement into a unified overlay indicator. This comprehensive system integrates multiple proven institutional trading methodologies to identify high-probability zones where smart money positioning and retail liquidity intersect.
The indicator is designed for traders who understand that institutional players move markets by targeting liquidity pools, creating imbalances, and establishing positions through Order Blocks. By synthesizing liquidity detection, Fair Value Gaps, Order Blocks, Breaker Blocks, market structure analysis, and real-time orderflow strength measurement, this tool helps identify structural market inflection points with institutional-grade precision.
Why This Integration Exists
This indicator combines eight distinct institutional analysis frameworks that complement each other:

Each component addresses different aspects of institutional order flow. Liquidity detection reveals where stops are hunted, Order Blocks show where institutions positioned, Fair Value Gaps indicate rapid institutional moves, market structure provides trend context, and orderflow strength quantifies current institutional pressure. Together, they create a comprehensive view of smart money activity and retail liquidity targeting.
Core Components Explained
1. Advanced Liquidity Detection System
The system identifies multiple types of liquidity pools:
Equal Highs (Buy-Side Liquidity):
Pine Script®
Equal Lows (Sell-Side Liquidity):
Pine Script®
Liquidity Sweeps:
- Bullish Sweep: Price breaks below recent lows but closes back above
- Bearish Sweep: Price breaks above recent highs but closes back below
These sweeps often precede significant moves as institutions trigger retail stops before establishing positions.
2. Order Block Detection Engine
Order Blocks represent the last opposite-direction move before a strong impulse:
Bullish Order Block:
Pine Script®
Bearish Order Block:
Pine Script®
Order Blocks are displayed as gradient boxes with diagonal lines and extend forward to show ongoing relevance.
3. Fair Value Gap Analysis
Fair Value Gaps represent price inefficiencies where institutions moved price rapidly:
Bullish FVG:
Pine Script®
Bearish FVG:
Pine Script®
FVGs are displayed as horizontal lines with gradient fills and often get filled (retested) later.
4. Breaker Block System
Breaker Blocks are failed Order Blocks that become new support/resistance:
Bullish Breaker: Failed bearish Order Block that price breaks above
Bearish Breaker: Failed bullish Order Block that price breaks below
These represent significant shifts in market structure and often provide strong reversal zones.
5. Market Structure Analysis
Tracks institutional trend changes through structure breaks:
Break of Structure (BOS):
- Bullish BOS: New higher high with strong momentum
- Bearish BOS: New lower low with strong momentum
Change of Character (CHoCH):
- Bullish CHoCH: Lower low followed by higher high (trend change)
- Bearish CHoCH: Higher high followed by lower low (trend change)
6. Advanced Orderflow Features
Liquidity Heatmap:
Tracks liquidity concentration by counting touches at key levels over specified periods. High-intensity areas (>80% touch count) are highlighted as significant liquidity zones.
Volume Delta Analysis:
Pine Script®
Strong delta (>50) indicates institutional accumulation or distribution.
Imbalance Zone Detection:
Enhanced Fair Value Gap detection for larger inefficiencies:
Pine Script®
Premium/Discount Zones:
Pine Script®

7. Orderflow Strength Meter
Real-time quantification of institutional pressure:
Pine Script®
Strength classifications:
- Extreme Bull/Bear Pressure: >±60
- Strong Bull/Bear Pressure: >±30
Visual Elements
How Components Work Together
The integration creates a layered institutional analysis approach:
Layer 1 - Liquidity Mapping: Equal highs/lows and swing points reveal where retail stops cluster
Layer 2 - Institutional Positioning: Order Blocks show where smart money accumulated/distributed
Layer 3 - Price Inefficiencies: Fair Value Gaps indicate rapid institutional moves
Layer 4 - Structure Context: BOS/CHoCH provide trend and reversal context
Layer 5 - Failed Levels: Breaker Blocks show where previous levels failed
Layer 6 - Flow Analysis: Volume delta and heatmaps reveal current institutional pressure
Layer 7 - Strength Synthesis: Orderflow strength meter quantifies overall institutional activity
Example scenario: Price approaches equal lows (Layer 1) where a bullish Order Block exists (Layer 2), creating a Fair Value Gap on the move up (Layer 3), with bullish CHoCH confirming trend change (Layer 4), strong positive volume delta (Layer 6), and extreme bullish orderflow strength (Layer 7). This confluence suggests high-probability long opportunity.
Input Parameters
Liquidity Settings:
Order Block Settings:
Fair Value Gap Settings:
Breaker Block Settings:
Advanced Features:
How to Use This Indicator
Step 1: Identify Market Structure
Check for recent BOS or CHoCH to understand current trend context and potential reversal zones.
Step 2: Map Liquidity Pools
Locate equal highs/lows and swing points where retail stops are likely clustered.
Step 3: Find Order Blocks
Identify recent Order Blocks where institutions likely positioned for the next move.
Step 4: Check for Fair Value Gaps
Look for unfilled FVGs that price may return to test, especially near Order Blocks.
Step 5: Monitor Liquidity Sweeps
Watch for sweep arrows indicating stop hunting - these often precede strong moves in the opposite direction.
Step 6: Analyze Volume Delta
Confirm institutional flow direction through volume delta analysis - strong delta supports directional bias.
Step 7: Review Orderflow Strength
Check dashboard for current orderflow strength - extreme readings indicate high institutional activity.
Step 8: Wait for Confluence
Best setups occur when multiple factors align: liquidity pools + Order Blocks + structure + volume confirmation.
Best Practices
Indicator Limitations
Technical Implementation
Built with Pine Script v6 using:
The code is fully open-source and can be modified to suit individual trading styles and preferences.
Originality Statement
This indicator is original in its comprehensive SMC integration approach. While individual components (Order Blocks, Fair Value Gaps, liquidity detection, volume analysis) are established Smart Money Concepts, this integration is justified because:
Each component contributes unique institutional information: liquidity detection reveals stop hunting targets, Order Blocks show positioning zones, Fair Value Gaps indicate rapid moves, market structure provides context, and volume analysis confirms flow. The integration's value lies in presenting these complementary SMC perspectives simultaneously with quantified orderflow strength measurement.
Disclaimer
This indicator is provided for educational and informational purposes only. It is not financial advice or a recommendation to buy or sell any financial instrument. Trading involves substantial risk of loss and is not suitable for all investors.
Smart Money Concepts and institutional analysis are educational frameworks that do not guarantee future price movement. Past performance and backtested results do not guarantee future results. Market conditions change, and SMC patterns that worked historically may not work in the future.
Always use proper risk management, including stop losses and position sizing appropriate for your account size and risk tolerance. Never risk more than you can afford to lose. Consider consulting with a qualified financial advisor before making investment decisions.
The author is not responsible for any losses incurred from using this indicator. Users assume full responsibility for all trading decisions made using this tool.
-Made with passion by officialjackofalltrades
Introduction
The Prism Orderflow Detector is an open-source institutional liquidity and order flow system that combines Smart Money Concepts (SMC), liquidity pool detection, Fair Value Gap analysis, Order Block identification, and advanced orderflow strength measurement into a unified overlay indicator. This comprehensive system integrates multiple proven institutional trading methodologies to identify high-probability zones where smart money positioning and retail liquidity intersect.
The indicator is designed for traders who understand that institutional players move markets by targeting liquidity pools, creating imbalances, and establishing positions through Order Blocks. By synthesizing liquidity detection, Fair Value Gaps, Order Blocks, Breaker Blocks, market structure analysis, and real-time orderflow strength measurement, this tool helps identify structural market inflection points with institutional-grade precision.
Why This Integration Exists
This indicator combines eight distinct institutional analysis frameworks that complement each other:
- Liquidity Pool Detection: Identifies equal highs/lows and swing points where retail stops cluster
- Order Block Analysis: Tracks institutional accumulation and distribution zones
- Fair Value Gap Identification: Detects price inefficiencies created by rapid institutional moves
- Breaker Block Recognition: Identifies failed Order Blocks that become new support/resistance
- Market Structure Mapping: Tracks Break of Structure (BOS) and Change of Character (CHoCH)
- Liquidity Heatmap Analysis: Visualizes liquidity concentration across price levels
- Volume Delta Tracking: Measures real-time buying versus selling pressure
- Orderflow Strength Measurement: Quantifies institutional pressure across multiple factors
Each component addresses different aspects of institutional order flow. Liquidity detection reveals where stops are hunted, Order Blocks show where institutions positioned, Fair Value Gaps indicate rapid institutional moves, market structure provides trend context, and orderflow strength quantifies current institutional pressure. Together, they create a comprehensive view of smart money activity and retail liquidity targeting.
Core Components Explained
1. Advanced Liquidity Detection System
The system identifies multiple types of liquidity pools:
Equal Highs (Buy-Side Liquidity):
Equal Lows (Sell-Side Liquidity):
Liquidity Sweeps:
- Bullish Sweep: Price breaks below recent lows but closes back above
- Bearish Sweep: Price breaks above recent highs but closes back below
These sweeps often precede significant moves as institutions trigger retail stops before establishing positions.
2. Order Block Detection Engine
Order Blocks represent the last opposite-direction move before a strong impulse:
Bullish Order Block:
Bearish Order Block:
Order Blocks are displayed as gradient boxes with diagonal lines and extend forward to show ongoing relevance.
3. Fair Value Gap Analysis
Fair Value Gaps represent price inefficiencies where institutions moved price rapidly:
Bullish FVG:
Bearish FVG:
FVGs are displayed as horizontal lines with gradient fills and often get filled (retested) later.
4. Breaker Block System
Breaker Blocks are failed Order Blocks that become new support/resistance:
Bullish Breaker: Failed bearish Order Block that price breaks above
Bearish Breaker: Failed bullish Order Block that price breaks below
These represent significant shifts in market structure and often provide strong reversal zones.
5. Market Structure Analysis
Tracks institutional trend changes through structure breaks:
Break of Structure (BOS):
- Bullish BOS: New higher high with strong momentum
- Bearish BOS: New lower low with strong momentum
Change of Character (CHoCH):
- Bullish CHoCH: Lower low followed by higher high (trend change)
- Bearish CHoCH: Higher high followed by lower low (trend change)
6. Advanced Orderflow Features
Liquidity Heatmap:
Tracks liquidity concentration by counting touches at key levels over specified periods. High-intensity areas (>80% touch count) are highlighted as significant liquidity zones.
Volume Delta Analysis:
Strong delta (>50) indicates institutional accumulation or distribution.
Imbalance Zone Detection:
Enhanced Fair Value Gap detection for larger inefficiencies:
Premium/Discount Zones:
7. Orderflow Strength Meter
Real-time quantification of institutional pressure:
Strength classifications:
- Extreme Bull/Bear Pressure: >±60
- Strong Bull/Bear Pressure: >±30
Visual Elements
- Liquidity Arrows: Directional arrows for equal highs/lows with clean labels
- Liquidity Sweeps: Arrow lines showing sweep direction with "SWEEP" labels
- Order Block Boxes: Gradient boxes with diagonal lines and "OB" labels
- Fair Value Gap Lines: Horizontal lines with gradient fills and "FVG" labels
- Breaker Diamonds: Diamond markers for failed Order Blocks with "BRK" labels
- Structure Arrows: CHoCH arrows with directional labels
- Imbalance Zones: Boxes with crossing diagonal lines and "IMB" labels
- Liquidity Heatmap: Significant liquidity levels with "LIQ" labels
- Volume Delta Markers: "Δ+" and "Δ-" labels for extreme volume pressure
- Orderflow Background: Subtle background coloring for extreme pressure states
- Dashboard: Comprehensive real-time status of all orderflow components
How Components Work Together
The integration creates a layered institutional analysis approach:
Layer 1 - Liquidity Mapping: Equal highs/lows and swing points reveal where retail stops cluster
Layer 2 - Institutional Positioning: Order Blocks show where smart money accumulated/distributed
Layer 3 - Price Inefficiencies: Fair Value Gaps indicate rapid institutional moves
Layer 4 - Structure Context: BOS/CHoCH provide trend and reversal context
Layer 5 - Failed Levels: Breaker Blocks show where previous levels failed
Layer 6 - Flow Analysis: Volume delta and heatmaps reveal current institutional pressure
Layer 7 - Strength Synthesis: Orderflow strength meter quantifies overall institutional activity
Example scenario: Price approaches equal lows (Layer 1) where a bullish Order Block exists (Layer 2), creating a Fair Value Gap on the move up (Layer 3), with bullish CHoCH confirming trend change (Layer 4), strong positive volume delta (Layer 6), and extreme bullish orderflow strength (Layer 7). This confluence suggests high-probability long opportunity.
Input Parameters
Liquidity Settings:
- Show Equal Highs/Lows: Toggle liquidity pool display
- Equal Price Threshold: Percentage tolerance for equal levels (default: 0.1%)
- Liquidity Lookback: Period for liquidity level detection (default: 50)
Order Block Settings:
- Show Order Blocks: Toggle Order Block display
- Order Block Strength: ATR multiplier for OB validation (default: 3)
- Extend Order Blocks: Forward extension bars (default: 20)
Fair Value Gap Settings:
- Show Fair Value Gaps: Toggle FVG display
- Min FVG Size: Minimum gap size percentage (default: 0.1%)
Breaker Block Settings:
- Show Breaker Blocks: Toggle Breaker display
- Breaker Lookback: Period for Breaker detection (default: 20)
Advanced Features:
- Show Liquidity Heatmap: Toggle heatmap visualization
- Show Volume Delta: Toggle volume pressure display
- Show Imbalance Zones: Toggle imbalance detection
- Show Premium/Discount Zones: Toggle equilibrium analysis
- Show Orderflow Strength: Toggle strength background
- Heatmap Period: Lookback for liquidity concentration (default: 100)
How to Use This Indicator
Step 1: Identify Market Structure
Check for recent BOS or CHoCH to understand current trend context and potential reversal zones.
Step 2: Map Liquidity Pools
Locate equal highs/lows and swing points where retail stops are likely clustered.
Step 3: Find Order Blocks
Identify recent Order Blocks where institutions likely positioned for the next move.
Step 4: Check for Fair Value Gaps
Look for unfilled FVGs that price may return to test, especially near Order Blocks.
Step 5: Monitor Liquidity Sweeps
Watch for sweep arrows indicating stop hunting - these often precede strong moves in the opposite direction.
Step 6: Analyze Volume Delta
Confirm institutional flow direction through volume delta analysis - strong delta supports directional bias.
Step 7: Review Orderflow Strength
Check dashboard for current orderflow strength - extreme readings indicate high institutional activity.
Step 8: Wait for Confluence
Best setups occur when multiple factors align: liquidity pools + Order Blocks + structure + volume confirmation.
Best Practices
- Use on 15-minute to 4-hour timeframes for optimal institutional detection
- Focus on confluence zones where multiple SMC concepts align
- Liquidity sweeps provide excellent risk:reward when they fail to sustain
- Order Block retests often provide precise entry levels with tight stops
- Fair Value Gaps act as magnets - price often returns to fill them
- CHoCH signals are more significant than BOS for trend changes
- Volume delta confirmation adds conviction to SMC setups
- Premium/discount zones help time entries - buy discount, sell premium
Indicator Limitations
- Not all liquidity pools get targeted - institutional timing varies
- Order Blocks can fail if market structure changes significantly
- Fair Value Gaps may never get filled during strong trending moves
- Breaker Blocks don't always provide reliable support/resistance
- Volume delta can be misleading in low-liquidity conditions
- Orderflow strength is reactive, not predictive of future moves
- SMC concepts require understanding of institutional behavior
- Visual elements can clutter chart - adjust display settings as needed
Technical Implementation
Built with Pine Script v6 using:
- Advanced liquidity detection with percentage-based thresholds
- Real-time Order Block calculation with ATR-based validation
- Dynamic Fair Value Gap identification with size filtering
- Breaker Block tracking with lookback period management
- Market structure analysis with BOS/CHoCH detection
- Volume delta calculation with institutional bias measurement
- Orderflow strength meter with multi-factor scoring
- Anti-overlap filtering to prevent visual clutter
- Comprehensive dashboard with real-time status updates
The code is fully open-source and can be modified to suit individual trading styles and preferences.
Originality Statement
This indicator is original in its comprehensive SMC integration approach. While individual components (Order Blocks, Fair Value Gaps, liquidity detection, volume analysis) are established Smart Money Concepts, this integration is justified because:
- It synthesizes eight distinct SMC methodologies into a unified system
- The orderflow strength meter quantifies institutional pressure across multiple factors
- Advanced liquidity heatmap visualization shows concentration levels not available elsewhere
- Integrated volume delta analysis provides real-time institutional flow confirmation
- Premium/discount zone analysis adds equilibrium context to SMC setups
- Anti-overlap filtering and clean visual design reduce chart clutter while maintaining functionality
Each component contributes unique institutional information: liquidity detection reveals stop hunting targets, Order Blocks show positioning zones, Fair Value Gaps indicate rapid moves, market structure provides context, and volume analysis confirms flow. The integration's value lies in presenting these complementary SMC perspectives simultaneously with quantified orderflow strength measurement.
Disclaimer
This indicator is provided for educational and informational purposes only. It is not financial advice or a recommendation to buy or sell any financial instrument. Trading involves substantial risk of loss and is not suitable for all investors.
Smart Money Concepts and institutional analysis are educational frameworks that do not guarantee future price movement. Past performance and backtested results do not guarantee future results. Market conditions change, and SMC patterns that worked historically may not work in the future.
Always use proper risk management, including stop losses and position sizing appropriate for your account size and risk tolerance. Never risk more than you can afford to lose. Consider consulting with a qualified financial advisor before making investment decisions.
The author is not responsible for any losses incurred from using this indicator. Users assume full responsibility for all trading decisions made using this tool.
-Made with passion by officialjackofalltrades
نص برمجي مفتوح المصدر
بروح TradingView الحقيقية، قام مبتكر هذا النص البرمجي بجعله مفتوح المصدر، بحيث يمكن للمتداولين مراجعة وظائفه والتحقق منها. شكرا للمؤلف! بينما يمكنك استخدامه مجانًا، تذكر أن إعادة نشر الكود يخضع لقواعد الموقع الخاصة بنا.

The Institutional Grade Trading Ecosystem, Built to win trades 📈
Get Access 👇
jackofalltrades.vip 🌐
t.me/jackofalltradesvip 🃏
Get Access 👇
jackofalltrades.vip 🌐
t.me/jackofalltradesvip 🃏
إخلاء المسؤولية
لا يُقصد بالمعلومات والمنشورات أن تكون، أو تشكل، أي نصيحة مالية أو استثمارية أو تجارية أو أنواع أخرى من النصائح أو التوصيات المقدمة أو المعتمدة من TradingView. اقرأ المزيد في شروط الاستخدام.
نص برمجي مفتوح المصدر
بروح TradingView الحقيقية، قام مبتكر هذا النص البرمجي بجعله مفتوح المصدر، بحيث يمكن للمتداولين مراجعة وظائفه والتحقق منها. شكرا للمؤلف! بينما يمكنك استخدامه مجانًا، تذكر أن إعادة نشر الكود يخضع لقواعد الموقع الخاصة بنا.
The Institutional Grade Trading Ecosystem, Built to win trades 📈
Get Access 👇
jackofalltrades.vip 🌐
t.me/jackofalltradesvip 🃏
Get Access 👇
jackofalltrades.vip 🌐
t.me/jackofalltradesvip 🃏
إخلاء المسؤولية
لا يُقصد بالمعلومات والمنشورات أن تكون، أو تشكل، أي نصيحة مالية أو استثمارية أو تجارية أو أنواع أخرى من النصائح أو التوصيات المقدمة أو المعتمدة من TradingView. اقرأ المزيد في شروط الاستخدام.