OPEN-SOURCE SCRIPT
Trading Truth Volume
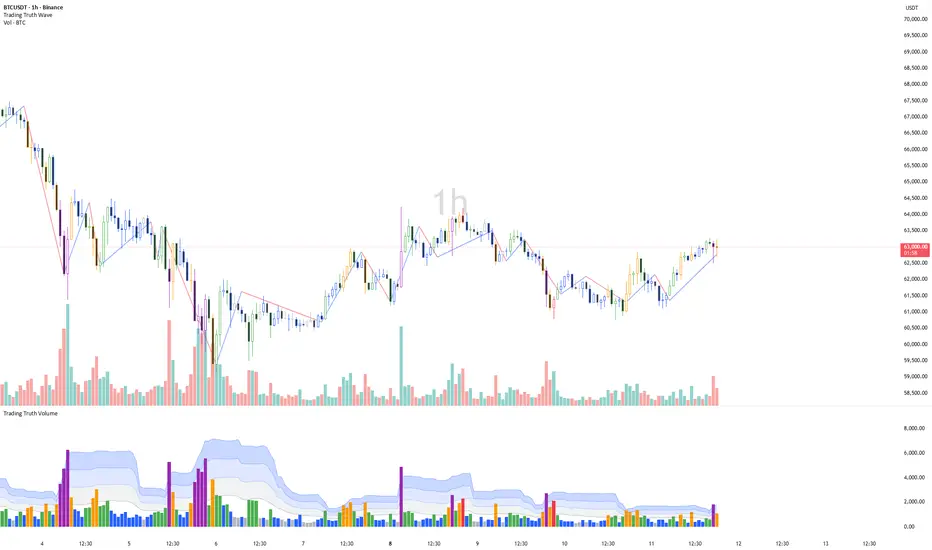
================================================================================
📊 Trading Truth Volume
🎯 Wave Volume Analysis & Volume Slope Detection
================================================================================
This companion indicator extends the Geometric Trading System by providing
advanced volume analysis—wave volume tracking, volume slope detection, and
multi-level standard deviation bands for identifying climax and exhaustion.
================================================================================
🔷 CORE VOLUME CLASSIFICATION SYSTEM
================================================================================
The system classifies each bar's volume relative to a Wilder's Moving Average,
creating a visual heatmap for instant volume intensity recognition.
--------------------------------------------------------------------------------
📊 VOLUME INTENSITY LEVELS
--------------------------------------------------------------------------------
💜 ULTRA HIGH VOLUME (2.2x+ avg)
→ Climax volume—major institutional activity or capitulation
→ Often marks reversals, breakouts, or exhaustion points
→ Color: Purple bars
🔴 VERY HIGH VOLUME (1.8x - 2.2x avg)
→ Strong institutional participation
→ Confirms major trend moves or distribution/accumulation
→ Color: Red bars
🟠 HIGH VOLUME (1.2x - 1.8x avg)
→ Above-average activity
→ Validates breakouts and trend continuation
→ Color: Orange bars
🟢 NORMAL VOLUME (0.8x - 1.2x avg)
→ Healthy trending volume
→ Standard market participation
→ Color: Green bars
🔵 LOW VOLUME (0.4x - 0.8x avg)
→ Weak conviction
→ Pullback or consolidation phase
→ Color: Blue bars
⚪ VERY LOW VOLUME (<0.4x avg)
→ Minimal liquidity—avoid entries
→ Holiday/weekend sessions or dead zones
→ Color: Silver bars
================================================================================
🌊 WAVE VOLUME TRACKING SYSTEM
================================================================================
The indicator tracks cumulative volume within each price wave using Renko-style
direction detection. This reveals whether buyers or sellers are in control.
--------------------------------------------------------------------------------
📈 UPWAVE VOLUME TRACKING
--------------------------------------------------------------------------------
When price creates higher highs (direction = UP):
→ Cumulative volume is tracked for the entire upwave
→ Labels show: [Volume]V (% change | bars)
→ Example: "15420V (2.35% | 12)" = 15420 volume, 2.35% move, 12 bars
--------------------------------------------------------------------------------
📉 DOWNWAVE VOLUME TRACKING
--------------------------------------------------------------------------------
When price creates lower lows (direction = DOWN):
→ Cumulative volume is tracked for the entire downwave
→ Same label format with direction context
→ Compare upwave vs downwave volume for trend strength
--------------------------------------------------------------------------------
🔄 DIRECTION CHANGE DETECTION
--------------------------------------------------------------------------------
The system uses configurable methods to detect wave direction changes:
ATR Method (Default)
→ Uses Average True Range to filter noise
→ Value = ATR period (default: 14)
→ Best for: Volatile markets, crypto
Traditional Method
→ Fixed point value for direction change
→ Value = minimum points to change direction
→ Best for: Stable markets, indices
Part of Price Method
→ Percentage-based direction change
→ Value = divisor (price / value = threshold)
→ Best for: Scaling across different price levels
================================================================================
📐 VOLUME SLOPE ANALYSIS (Advanced)
================================================================================
The slope analysis reveals whether volume is INCREASING or DECREASING within
each wave—critical for identifying climax vs exhaustion.
--------------------------------------------------------------------------------
📈 SLOPE DETECTION METHODS
--------------------------------------------------------------------------------
🔷 SIMPLE METHOD
→ Draws line from lowest volume bar to highest volume bar in wave
→ Shows clear volume trend direction
→ Best for: Quick visual assessment
🔷 LINEAR REGRESSION METHOD
→ Fits a regression line through all volume bars in wave
→ Smoother, more statistically robust
→ Best for: Precise volume trend analysis
--------------------------------------------------------------------------------
🎨 SLOPE INTERPRETATION
--------------------------------------------------------------------------------
🟢 UPWAVE + RISING VOLUME SLOPE
→ Buyers increasing commitment
→ Strong trend continuation signal
→ Look for: Breakout confirmations
🟢 UPWAVE + FALLING VOLUME SLOPE
→ Buyers losing steam
→ Potential exhaustion warning
→ Look for: Pullback or reversal setup
🔴 DOWNWAVE + RISING VOLUME SLOPE
→ Sellers increasing pressure
→ Strong distribution or panic
→ Look for: Capitulation bottoms
🔴 DOWNWAVE + FALLING VOLUME SLOPE
→ Selling pressure diminishing
→ Potential bottoming pattern
→ Look for: Reversal setups
================================================================================
📊 VOLUME STANDARD DEVIATION BANDS
================================================================================
The system plots statistical bands around the volume moving average to identify
abnormal volume spikes and exhaustion zones.
--------------------------------------------------------------------------------
📏 BAND LEVELS
--------------------------------------------------------------------------------
⚪ VOLUME MA (Gray Line)
→ Base average volume level
→ Center of the statistical distribution
🔵 STDDEV 1 BAND (Light Blue)
→ 1 standard deviation above MA
→ ~68% of volume bars fall below this level
→ Moderate volume spike threshold
🔵 STDDEV 2 BAND (Medium Blue)
→ 2 standard deviations above MA
→ ~95% of volume bars fall below this level
→ Significant volume spike threshold
🔵 STDDEV 3 BAND (Dark Blue)
→ 3 standard deviations above MA
→ ~99.7% of volume bars fall below this level
→ EXTREME volume—climax or capitulation zone
--------------------------------------------------------------------------------
🎯 BAND TRADING SIGNALS
--------------------------------------------------------------------------------
📊 Volume Touching StdDev 1
→ Above average activity
→ Confirms trend strength
→ Normal for breakouts
📊 Volume Touching StdDev 2
→ Unusual volume spike
→ Institutional activity likely
→ Watch for continuation OR reversal
📊 Volume Touching StdDev 3
→ EXTREME volume event
→ Often marks major turning points
→ Climax tops or capitulation bottoms
================================================================================
⚙️ TRADINGVIEW INPUT SETTINGS
================================================================================
📊 BASIC VOLUME SETTINGS
--------------------------------------------------------------------------------
☑️ Show Volume Moving Average
Default: OFF
→ Plots Wilder's MA line on volume
→ Useful for seeing the dynamic average
📏 Length of MA applied on Volume
Default: 20
Range: 1-200
→ Period for volume moving average calculation
→ Lower = more responsive, Higher = smoother
--------------------------------------------------------------------------------
📈 VOLUME RATIO THRESHOLDS
--------------------------------------------------------------------------------
These ratios define the volume classification boundaries:
🔢 Ultra High Volume Ratio
Default: 2.2
→ Volume >= 2.2x MA = Ultra High (Purple)
🔢 Very High Volume Ratio
Default: 1.8
→ Volume >= 1.8x MA = Very High (Red)
🔢 High Volume Ratio
Default: 1.2
→ Volume >= 1.2x MA = High (Orange)
🔢 Normal Volume Ratio
Default: 0.8
→ Volume >= 0.8x MA = Normal (Green)
🔢 Low Volume Ratio
Default: 0.4
→ Volume >= 0.4x MA = Low (Blue)
🔢 Very Low Volume Ratio
Default: 0.4
→ Volume < 0.4x MA = Very Low (Silver)
💡 TIP: Adjust ratios based on your market's volatility. Crypto may need
higher thresholds (2.5x, 2.0x), while forex may need lower (1.8x, 1.5x).
--------------------------------------------------------------------------------
🌊 WAVE VOLUME SETTINGS
--------------------------------------------------------------------------------
🎨 Up Volume Color
Default: Black
→ Color for upwave volume labels
🎨 Down Volume Color
Default: Black
→ Color for downwave volume labels
📏 Size of Wave Line
Options: 1, 2, 3
Default: 2
→ Line thickness for wave markers
☑️ Plot Wave Volume
Default: OFF
→ Enable to show wave volume labels on chart
→ Shows cumulative volume per wave with % change
--------------------------------------------------------------------------------
🔧 RENKO DIRECTION SETTINGS
--------------------------------------------------------------------------------
📐 Renko Assignment Method
Options: ATR, Traditional, Part of Price
Default: ATR
ATR: Uses Average True Range for direction detection
→ Value = ATR period (e.g., 14)
→ Best for: Adaptive to volatility
Traditional: Fixed point threshold
→ Value = minimum points to change direction
→ Best for: Consistent markets
Part of Price: Percentage-based
→ Value = divisor (price / value = threshold)
→ Best for: Multi-asset strategies
🔢 Value
Default: 14.0
→ Meaning depends on method selected above
📊 Price Source
Options: Close, Open / Close, High / Low
Default: Close
→ Which price to use for direction detection
🔄 Use True Range instead of Volume
Options: Always, Auto, Never
Default: Auto
→ Auto: Uses True Range when volume data unavailable
→ Useful for indices or assets without volume
--------------------------------------------------------------------------------
📏 VOLUME DISPLAY SETTINGS
--------------------------------------------------------------------------------
📐 Size
Options: Tiny, Small, Medium, Large, Huge
Default: Medium
→ Size of wave volume labels
🔢 Volume Scale Down Factor
Options: 1, 10, 100, 1000, ... 1000000000
Default: 1
→ Divides volume figures for readability
→ Use 1000 for stocks, 1000000 for crypto
☑️ Show Pivot Markers
Default: OFF
→ Shows arrow markers at wave pivots
🎨 High Pivot Color
Default: Gray
→ Color for swing high markers
🎨 Low Pivot Color
Default: Black (50% transparency)
→ Color for swing low markers
☑️ Show Volume Candles
Default: OFF
→ Colors candles based on volume intensity
→ Green shades for up candles, Red for down
🔢 Volume EMA Period
Default: 20
→ EMA period for volume candle coloring
--------------------------------------------------------------------------------
📐 VOLUME SLOPE ANALYSIS SETTINGS
--------------------------------------------------------------------------------
☑️ Enable Volume Slope Analysis
Default: ON
→ Master toggle for slope detection features
📊 Slope Method
Options: Simple, Linear Regression
Default: Simple
Simple: Line between swing low/high volume points
Linear Regression: Fitted line through all wave bars
☑️ Show Volume Std Dev Bands
Default: ON
→ Displays the statistical deviation bands
🔢 Volume Std Dev Period
Default: 20
→ Period for standard deviation calculation
📏 Slope Line Width
Options: 1, 2, 3, 4
Default: 2
→ Thickness of slope lines
🎨 Upwave Slope Color
Default: Green (30% transparency)
→ Color for rising wave slope lines
🎨 Downwave Slope Color
Default: Red (30% transparency)
→ Color for falling wave slope lines
================================================================================
🟢 BULLISH VOLUME SIGNALS
================================================================================
--------------------------------------------------------------------------------
Signal 1: Climax Volume at Support
--------------------------------------------------------------------------------
Setup: Ultra High volume (purple) at geometric support level
Interpretation: Capitulation selling—smart money absorbing supply
📥 Action: Look for bullish reversal candle
🎯 Target: Previous swing high or midpoint
📊 Confirmation: Volume slope turning up in new wave
--------------------------------------------------------------------------------
Signal 2: Rising Volume in Upwave
--------------------------------------------------------------------------------
Setup: Volume slope trending UP during upwave
Interpretation: Buyers increasing commitment—trend acceleration
📥 Action: Add to long positions on pullbacks
🎯 Target: Extended targets (TP3, TP4)
📊 Confirmation: Each swing low has higher volume than previous
--------------------------------------------------------------------------------
Signal 3: Decreasing Volume on Pullback
--------------------------------------------------------------------------------
Setup: Volume drops to Low/Very Low during downwave correction
Interpretation: Healthy profit-taking, no distribution
📥 Action: Prepare for continuation entry
🎯 Target: New highs
📊 Confirmation: Volume expands when uptrend resumes
================================================================================
🔴 BEARISH VOLUME SIGNALS
================================================================================
--------------------------------------------------------------------------------
Signal 1: Climax Volume at Resistance
--------------------------------------------------------------------------------
Setup: Ultra High volume (purple) at geometric resistance
Interpretation: Blow-off top—smart money distributing
📤 Action: Look for bearish reversal candle
🎯 Target: Previous swing low or midpoint
📊 Confirmation: Volume slope turning down in new wave
--------------------------------------------------------------------------------
Signal 2: Rising Volume in Downwave
--------------------------------------------------------------------------------
Setup: Volume slope trending UP during downwave
Interpretation: Panic selling—trend acceleration down
📤 Action: Add to short positions on rallies
🎯 Target: Extended targets (TP3, TP4)
📊 Confirmation: Each swing high has higher volume than previous
--------------------------------------------------------------------------------
Signal 3: Decreasing Volume on Rally
--------------------------------------------------------------------------------
Setup: Volume drops to Low/Very Low during upwave bounce
Interpretation: Weak buying, no accumulation
📤 Action: Prepare for continuation short entry
🎯 Target: New lows
📊 Confirmation: Volume expands when downtrend resumes
================================================================================
🎯 VOLUME + GEOMETRY CONFLUENCE
================================================================================
The Volume indicator works best when combined with the main Geometric Trading
System indicator. Look for these high-probability setups:
--------------------------------------------------------------------------------
💎 CONFLUENCE SETUP 1: Angle + Volume Spike
--------------------------------------------------------------------------------
Condition: Price touches 1x1 geometric angle
+ Ultra High or Very High volume bar
+ Volume slope diverging from price direction
= HIGH PROBABILITY REVERSAL
--------------------------------------------------------------------------------
💎 CONFLUENCE SETUP 2: Midpoint + Volume Climax
--------------------------------------------------------------------------------
Condition: Price at HTF midpoint level
+ Volume touching StdDev 3 band
+ Wave volume 2x+ previous wave
= MAJOR TURNING POINT
--------------------------------------------------------------------------------
💎 CONFLUENCE SETUP 3: Time Cycle + Volume Exhaustion
--------------------------------------------------------------------------------
Condition: Price at geometric time cycle vertical
+ Declining volume slope in current wave
+ Volume below StdDev 1 band
= TREND EXHAUSTION / REVERSAL ZONE
================================================================================
💎 PRO TRADING NOTES
================================================================================
🎯 VOLUME ANALYSIS HIERARCHY
1. StdDev Bands → Identify abnormal volume events
2. Wave Volume → Compare buying vs selling pressure
3. Volume Slope → Confirm trend strength or exhaustion
4. Color Classification → Quick visual assessment
--------------------------------------------------------------------------------
📊 VOLUME DIVERGENCE PATTERNS
--------------------------------------------------------------------------------
Price Higher High + Volume Lower High = BEARISH DIVERGENCE
→ Weakening buying pressure, potential top
Price Lower Low + Volume Lower Low = BULLISH DIVERGENCE
→ Weakening selling pressure, potential bottom
Price Flat + Volume Expanding = BREAKOUT IMMINENT
→ Accumulation or distribution complete
--------------------------------------------------------------------------------
🌊 WAVE VOLUME COMPARISONS
--------------------------------------------------------------------------------
Upwave Vol > Downwave Vol = BULLISH BIAS
→ Buyers more aggressive than sellers
Downwave Vol > Upwave Vol = BEARISH BIAS
→ Sellers more aggressive than buyers
Equal Wave Volumes = CONSOLIDATION
→ No clear winner, wait for breakout
--------------------------------------------------------------------------------
📈 VOLUME SLOPE STRATEGIES
--------------------------------------------------------------------------------
Rising Slope + Rising Price = STRONG TREND (ride it)
Falling Slope + Rising Price = EXHAUSTION (prepare exit)
Rising Slope + Falling Price = PANIC (look for bottom)
Falling Slope + Falling Price = WEAK SELLING (potential bounce)
================================================================================
🆘 TROUBLESHOOTING
================================================================================
Q: Volume bars not colored correctly?
A: - Check that volume data is available for your symbol
- Some indices don't have volume—use True Range option
- Adjust ratio thresholds if all bars are same color
Q: Wave volume labels not showing?
A: - Enable "Plot Wave Volume" in settings
- Check that wave colors are not transparent
- Reduce "Volume Scale Down Factor" if numbers are 0
Q: StdDev bands too wide/narrow?
A: - Adjust "Volume Std Dev Period" (higher = wider bands)
- Very volatile assets may need shorter period
- Stable assets may need longer period
Q: Volume slope not visible?
A: - Enable "Enable Volume Slope Analysis"
- Check slope line width is 2 or higher
- Ensure slope colors are not too transparent
Q: Different from main price chart volume?
A: - This indicator uses Wilder's MA (exponential smoothing)
- Built-in TradingView volume uses SMA
- Both are valid—this is more responsive
Q: Works on all markets?
A: - ✅ Crypto (24/7 volume)
- ✅ Stocks (regular hours volume)
- ✅ Futures (tick volume)
- ⚠️ Forex (tick volume, less reliable)
- ⚠️ Indices (may need True Range option)
Q: Best settings for scalping?
A: - Reduce MA Length to 10-14
- Lower StdDev Period to 14
- Use "Part of Price" method with value 100-200
Q: Best settings for swing trading?
A: - Increase MA Length to 30-50
- Higher StdDev Period to 30
- Use "ATR" method with value 20-30
================================================================================
📜 VERSION HISTORY
================================================================================
v1.0 (Current - January 2025)
✅ Volume classification system (6 levels)
✅ Wilder's Moving Average calculation
✅ Wave volume tracking with labels
✅ Renko-style direction detection
✅ Volume slope analysis (Simple & LinReg)
✅ Standard deviation bands (1, 2, 3 sigma)
✅ Customizable ratio thresholds
✅ Volume candle coloring option
✅ Multi-method direction detection
✅ Scale factor for large volume numbers
Planned v2.0
🔜 Volume profile integration
🔜 VWAP deviation bands
🔜 Volume-weighted wave analysis
🔜 Automated divergence detection
🔜 Volume alerts (climax, exhaustion)
================================================================================
🧠 THE SCIENCE BEHIND VOLUME ANALYSIS
================================================================================
Core Volume Principles Applied
1. Volume Precedes Price
→ Major moves are preceded by volume expansion
→ Climax volume marks turning points
2. Volume Confirms Trend
→ Healthy trends have rising volume in trend direction
→ Declining volume = weakening trend
3. Exhaustion Patterns
→ Ultra-high volume at extremes = capitulation
→ Low volume at extremes = no conviction
4. Wave Volume Comparison
→ Compare effort (volume) to result (price movement)
→ High effort + low result = potential reversal
5. Standard Deviation Context
→ Statistical framework for "abnormal" volume
→ 3 sigma events are rare and significant
WHY THIS WORKS
- Smart Money Footprint: Large players can't hide volume
- Confirmation Tool: Volume validates or invalidates price moves
- Early Warning: Volume divergences precede price reversals
- Universal: Same principles work across all markets
================================================================================
⚠️ RISK DISCLAIMER
================================================================================
This indicator is an EDUCATIONAL TOOL for volume analysis. It does NOT
guarantee profits. Markets involve substantial risk of loss.
- Volume analysis is ONE piece of the puzzle
- Always combine with price structure analysis
- Use proper position sizing (1-2% risk per trade)
- Backtest strategies before live trading
- No indicator is 100% accurate
================================================================================
🎓 LEARNING PATH
================================================================================
BEGINNER
1. Start with just the colored volume bars
2. Learn to identify Ultra High and Very High volume events
3. Notice how price reacts after volume spikes
4. Track wave volume to see buyer vs seller strength
INTERMEDIATE
5. Enable StdDev bands to quantify "abnormal" volume
6. Use volume slope to confirm trend strength
7. Compare wave volumes for bias direction
8. Look for volume divergences with price
ADVANCED
9. Combine with Geometric Trading System angles
10. Trade volume climax reversals at geometric levels
11. Use wave volume ratios for position sizing
12. Develop volume-based entry/exit rules
================================================================================
💬 FINAL WORDS FROM THE ARCHITECT
================================================================================
"Price tells you WHAT happened. Volume tells you WHO made it happen. When
smart money moves, volume reveals their footprint. Learn to read the
volume story, and you'll see the market's intentions before they unfold."
Volume is the fuel that drives price. Without volume, moves are suspect.
With volume, moves are confirmed. Master volume analysis, and you'll
trade with conviction.
================================================================================
📊 Volume is the Heartbeat of the Market
© 2025 AstroTrade_ | Invite-Only TradingView Script
================================================================================
📊 Trading Truth Volume
🎯 Wave Volume Analysis & Volume Slope Detection
================================================================================
This companion indicator extends the Geometric Trading System by providing
advanced volume analysis—wave volume tracking, volume slope detection, and
multi-level standard deviation bands for identifying climax and exhaustion.
================================================================================
🔷 CORE VOLUME CLASSIFICATION SYSTEM
================================================================================
The system classifies each bar's volume relative to a Wilder's Moving Average,
creating a visual heatmap for instant volume intensity recognition.
--------------------------------------------------------------------------------
📊 VOLUME INTENSITY LEVELS
--------------------------------------------------------------------------------
💜 ULTRA HIGH VOLUME (2.2x+ avg)
→ Climax volume—major institutional activity or capitulation
→ Often marks reversals, breakouts, or exhaustion points
→ Color: Purple bars
🔴 VERY HIGH VOLUME (1.8x - 2.2x avg)
→ Strong institutional participation
→ Confirms major trend moves or distribution/accumulation
→ Color: Red bars
🟠 HIGH VOLUME (1.2x - 1.8x avg)
→ Above-average activity
→ Validates breakouts and trend continuation
→ Color: Orange bars
🟢 NORMAL VOLUME (0.8x - 1.2x avg)
→ Healthy trending volume
→ Standard market participation
→ Color: Green bars
🔵 LOW VOLUME (0.4x - 0.8x avg)
→ Weak conviction
→ Pullback or consolidation phase
→ Color: Blue bars
⚪ VERY LOW VOLUME (<0.4x avg)
→ Minimal liquidity—avoid entries
→ Holiday/weekend sessions or dead zones
→ Color: Silver bars
================================================================================
🌊 WAVE VOLUME TRACKING SYSTEM
================================================================================
The indicator tracks cumulative volume within each price wave using Renko-style
direction detection. This reveals whether buyers or sellers are in control.
--------------------------------------------------------------------------------
📈 UPWAVE VOLUME TRACKING
--------------------------------------------------------------------------------
When price creates higher highs (direction = UP):
→ Cumulative volume is tracked for the entire upwave
→ Labels show: [Volume]V (% change | bars)
→ Example: "15420V (2.35% | 12)" = 15420 volume, 2.35% move, 12 bars
--------------------------------------------------------------------------------
📉 DOWNWAVE VOLUME TRACKING
--------------------------------------------------------------------------------
When price creates lower lows (direction = DOWN):
→ Cumulative volume is tracked for the entire downwave
→ Same label format with direction context
→ Compare upwave vs downwave volume for trend strength
--------------------------------------------------------------------------------
🔄 DIRECTION CHANGE DETECTION
--------------------------------------------------------------------------------
The system uses configurable methods to detect wave direction changes:
ATR Method (Default)
→ Uses Average True Range to filter noise
→ Value = ATR period (default: 14)
→ Best for: Volatile markets, crypto
Traditional Method
→ Fixed point value for direction change
→ Value = minimum points to change direction
→ Best for: Stable markets, indices
Part of Price Method
→ Percentage-based direction change
→ Value = divisor (price / value = threshold)
→ Best for: Scaling across different price levels
================================================================================
📐 VOLUME SLOPE ANALYSIS (Advanced)
================================================================================
The slope analysis reveals whether volume is INCREASING or DECREASING within
each wave—critical for identifying climax vs exhaustion.
--------------------------------------------------------------------------------
📈 SLOPE DETECTION METHODS
--------------------------------------------------------------------------------
🔷 SIMPLE METHOD
→ Draws line from lowest volume bar to highest volume bar in wave
→ Shows clear volume trend direction
→ Best for: Quick visual assessment
🔷 LINEAR REGRESSION METHOD
→ Fits a regression line through all volume bars in wave
→ Smoother, more statistically robust
→ Best for: Precise volume trend analysis
--------------------------------------------------------------------------------
🎨 SLOPE INTERPRETATION
--------------------------------------------------------------------------------
🟢 UPWAVE + RISING VOLUME SLOPE
→ Buyers increasing commitment
→ Strong trend continuation signal
→ Look for: Breakout confirmations
🟢 UPWAVE + FALLING VOLUME SLOPE
→ Buyers losing steam
→ Potential exhaustion warning
→ Look for: Pullback or reversal setup
🔴 DOWNWAVE + RISING VOLUME SLOPE
→ Sellers increasing pressure
→ Strong distribution or panic
→ Look for: Capitulation bottoms
🔴 DOWNWAVE + FALLING VOLUME SLOPE
→ Selling pressure diminishing
→ Potential bottoming pattern
→ Look for: Reversal setups
================================================================================
📊 VOLUME STANDARD DEVIATION BANDS
================================================================================
The system plots statistical bands around the volume moving average to identify
abnormal volume spikes and exhaustion zones.
--------------------------------------------------------------------------------
📏 BAND LEVELS
--------------------------------------------------------------------------------
⚪ VOLUME MA (Gray Line)
→ Base average volume level
→ Center of the statistical distribution
🔵 STDDEV 1 BAND (Light Blue)
→ 1 standard deviation above MA
→ ~68% of volume bars fall below this level
→ Moderate volume spike threshold
🔵 STDDEV 2 BAND (Medium Blue)
→ 2 standard deviations above MA
→ ~95% of volume bars fall below this level
→ Significant volume spike threshold
🔵 STDDEV 3 BAND (Dark Blue)
→ 3 standard deviations above MA
→ ~99.7% of volume bars fall below this level
→ EXTREME volume—climax or capitulation zone
--------------------------------------------------------------------------------
🎯 BAND TRADING SIGNALS
--------------------------------------------------------------------------------
📊 Volume Touching StdDev 1
→ Above average activity
→ Confirms trend strength
→ Normal for breakouts
📊 Volume Touching StdDev 2
→ Unusual volume spike
→ Institutional activity likely
→ Watch for continuation OR reversal
📊 Volume Touching StdDev 3
→ EXTREME volume event
→ Often marks major turning points
→ Climax tops or capitulation bottoms
================================================================================
⚙️ TRADINGVIEW INPUT SETTINGS
================================================================================
📊 BASIC VOLUME SETTINGS
--------------------------------------------------------------------------------
☑️ Show Volume Moving Average
Default: OFF
→ Plots Wilder's MA line on volume
→ Useful for seeing the dynamic average
📏 Length of MA applied on Volume
Default: 20
Range: 1-200
→ Period for volume moving average calculation
→ Lower = more responsive, Higher = smoother
--------------------------------------------------------------------------------
📈 VOLUME RATIO THRESHOLDS
--------------------------------------------------------------------------------
These ratios define the volume classification boundaries:
🔢 Ultra High Volume Ratio
Default: 2.2
→ Volume >= 2.2x MA = Ultra High (Purple)
🔢 Very High Volume Ratio
Default: 1.8
→ Volume >= 1.8x MA = Very High (Red)
🔢 High Volume Ratio
Default: 1.2
→ Volume >= 1.2x MA = High (Orange)
🔢 Normal Volume Ratio
Default: 0.8
→ Volume >= 0.8x MA = Normal (Green)
🔢 Low Volume Ratio
Default: 0.4
→ Volume >= 0.4x MA = Low (Blue)
🔢 Very Low Volume Ratio
Default: 0.4
→ Volume < 0.4x MA = Very Low (Silver)
💡 TIP: Adjust ratios based on your market's volatility. Crypto may need
higher thresholds (2.5x, 2.0x), while forex may need lower (1.8x, 1.5x).
--------------------------------------------------------------------------------
🌊 WAVE VOLUME SETTINGS
--------------------------------------------------------------------------------
🎨 Up Volume Color
Default: Black
→ Color for upwave volume labels
🎨 Down Volume Color
Default: Black
→ Color for downwave volume labels
📏 Size of Wave Line
Options: 1, 2, 3
Default: 2
→ Line thickness for wave markers
☑️ Plot Wave Volume
Default: OFF
→ Enable to show wave volume labels on chart
→ Shows cumulative volume per wave with % change
--------------------------------------------------------------------------------
🔧 RENKO DIRECTION SETTINGS
--------------------------------------------------------------------------------
📐 Renko Assignment Method
Options: ATR, Traditional, Part of Price
Default: ATR
ATR: Uses Average True Range for direction detection
→ Value = ATR period (e.g., 14)
→ Best for: Adaptive to volatility
Traditional: Fixed point threshold
→ Value = minimum points to change direction
→ Best for: Consistent markets
Part of Price: Percentage-based
→ Value = divisor (price / value = threshold)
→ Best for: Multi-asset strategies
🔢 Value
Default: 14.0
→ Meaning depends on method selected above
📊 Price Source
Options: Close, Open / Close, High / Low
Default: Close
→ Which price to use for direction detection
🔄 Use True Range instead of Volume
Options: Always, Auto, Never
Default: Auto
→ Auto: Uses True Range when volume data unavailable
→ Useful for indices or assets without volume
--------------------------------------------------------------------------------
📏 VOLUME DISPLAY SETTINGS
--------------------------------------------------------------------------------
📐 Size
Options: Tiny, Small, Medium, Large, Huge
Default: Medium
→ Size of wave volume labels
🔢 Volume Scale Down Factor
Options: 1, 10, 100, 1000, ... 1000000000
Default: 1
→ Divides volume figures for readability
→ Use 1000 for stocks, 1000000 for crypto
☑️ Show Pivot Markers
Default: OFF
→ Shows arrow markers at wave pivots
🎨 High Pivot Color
Default: Gray
→ Color for swing high markers
🎨 Low Pivot Color
Default: Black (50% transparency)
→ Color for swing low markers
☑️ Show Volume Candles
Default: OFF
→ Colors candles based on volume intensity
→ Green shades for up candles, Red for down
🔢 Volume EMA Period
Default: 20
→ EMA period for volume candle coloring
--------------------------------------------------------------------------------
📐 VOLUME SLOPE ANALYSIS SETTINGS
--------------------------------------------------------------------------------
☑️ Enable Volume Slope Analysis
Default: ON
→ Master toggle for slope detection features
📊 Slope Method
Options: Simple, Linear Regression
Default: Simple
Simple: Line between swing low/high volume points
Linear Regression: Fitted line through all wave bars
☑️ Show Volume Std Dev Bands
Default: ON
→ Displays the statistical deviation bands
🔢 Volume Std Dev Period
Default: 20
→ Period for standard deviation calculation
📏 Slope Line Width
Options: 1, 2, 3, 4
Default: 2
→ Thickness of slope lines
🎨 Upwave Slope Color
Default: Green (30% transparency)
→ Color for rising wave slope lines
🎨 Downwave Slope Color
Default: Red (30% transparency)
→ Color for falling wave slope lines
================================================================================
🟢 BULLISH VOLUME SIGNALS
================================================================================
--------------------------------------------------------------------------------
Signal 1: Climax Volume at Support
--------------------------------------------------------------------------------
Setup: Ultra High volume (purple) at geometric support level
Interpretation: Capitulation selling—smart money absorbing supply
📥 Action: Look for bullish reversal candle
🎯 Target: Previous swing high or midpoint
📊 Confirmation: Volume slope turning up in new wave
--------------------------------------------------------------------------------
Signal 2: Rising Volume in Upwave
--------------------------------------------------------------------------------
Setup: Volume slope trending UP during upwave
Interpretation: Buyers increasing commitment—trend acceleration
📥 Action: Add to long positions on pullbacks
🎯 Target: Extended targets (TP3, TP4)
📊 Confirmation: Each swing low has higher volume than previous
--------------------------------------------------------------------------------
Signal 3: Decreasing Volume on Pullback
--------------------------------------------------------------------------------
Setup: Volume drops to Low/Very Low during downwave correction
Interpretation: Healthy profit-taking, no distribution
📥 Action: Prepare for continuation entry
🎯 Target: New highs
📊 Confirmation: Volume expands when uptrend resumes
================================================================================
🔴 BEARISH VOLUME SIGNALS
================================================================================
--------------------------------------------------------------------------------
Signal 1: Climax Volume at Resistance
--------------------------------------------------------------------------------
Setup: Ultra High volume (purple) at geometric resistance
Interpretation: Blow-off top—smart money distributing
📤 Action: Look for bearish reversal candle
🎯 Target: Previous swing low or midpoint
📊 Confirmation: Volume slope turning down in new wave
--------------------------------------------------------------------------------
Signal 2: Rising Volume in Downwave
--------------------------------------------------------------------------------
Setup: Volume slope trending UP during downwave
Interpretation: Panic selling—trend acceleration down
📤 Action: Add to short positions on rallies
🎯 Target: Extended targets (TP3, TP4)
📊 Confirmation: Each swing high has higher volume than previous
--------------------------------------------------------------------------------
Signal 3: Decreasing Volume on Rally
--------------------------------------------------------------------------------
Setup: Volume drops to Low/Very Low during upwave bounce
Interpretation: Weak buying, no accumulation
📤 Action: Prepare for continuation short entry
🎯 Target: New lows
📊 Confirmation: Volume expands when downtrend resumes
================================================================================
🎯 VOLUME + GEOMETRY CONFLUENCE
================================================================================
The Volume indicator works best when combined with the main Geometric Trading
System indicator. Look for these high-probability setups:
--------------------------------------------------------------------------------
💎 CONFLUENCE SETUP 1: Angle + Volume Spike
--------------------------------------------------------------------------------
Condition: Price touches 1x1 geometric angle
+ Ultra High or Very High volume bar
+ Volume slope diverging from price direction
= HIGH PROBABILITY REVERSAL
--------------------------------------------------------------------------------
💎 CONFLUENCE SETUP 2: Midpoint + Volume Climax
--------------------------------------------------------------------------------
Condition: Price at HTF midpoint level
+ Volume touching StdDev 3 band
+ Wave volume 2x+ previous wave
= MAJOR TURNING POINT
--------------------------------------------------------------------------------
💎 CONFLUENCE SETUP 3: Time Cycle + Volume Exhaustion
--------------------------------------------------------------------------------
Condition: Price at geometric time cycle vertical
+ Declining volume slope in current wave
+ Volume below StdDev 1 band
= TREND EXHAUSTION / REVERSAL ZONE
================================================================================
💎 PRO TRADING NOTES
================================================================================
🎯 VOLUME ANALYSIS HIERARCHY
1. StdDev Bands → Identify abnormal volume events
2. Wave Volume → Compare buying vs selling pressure
3. Volume Slope → Confirm trend strength or exhaustion
4. Color Classification → Quick visual assessment
--------------------------------------------------------------------------------
📊 VOLUME DIVERGENCE PATTERNS
--------------------------------------------------------------------------------
Price Higher High + Volume Lower High = BEARISH DIVERGENCE
→ Weakening buying pressure, potential top
Price Lower Low + Volume Lower Low = BULLISH DIVERGENCE
→ Weakening selling pressure, potential bottom
Price Flat + Volume Expanding = BREAKOUT IMMINENT
→ Accumulation or distribution complete
--------------------------------------------------------------------------------
🌊 WAVE VOLUME COMPARISONS
--------------------------------------------------------------------------------
Upwave Vol > Downwave Vol = BULLISH BIAS
→ Buyers more aggressive than sellers
Downwave Vol > Upwave Vol = BEARISH BIAS
→ Sellers more aggressive than buyers
Equal Wave Volumes = CONSOLIDATION
→ No clear winner, wait for breakout
--------------------------------------------------------------------------------
📈 VOLUME SLOPE STRATEGIES
--------------------------------------------------------------------------------
Rising Slope + Rising Price = STRONG TREND (ride it)
Falling Slope + Rising Price = EXHAUSTION (prepare exit)
Rising Slope + Falling Price = PANIC (look for bottom)
Falling Slope + Falling Price = WEAK SELLING (potential bounce)
================================================================================
🆘 TROUBLESHOOTING
================================================================================
Q: Volume bars not colored correctly?
A: - Check that volume data is available for your symbol
- Some indices don't have volume—use True Range option
- Adjust ratio thresholds if all bars are same color
Q: Wave volume labels not showing?
A: - Enable "Plot Wave Volume" in settings
- Check that wave colors are not transparent
- Reduce "Volume Scale Down Factor" if numbers are 0
Q: StdDev bands too wide/narrow?
A: - Adjust "Volume Std Dev Period" (higher = wider bands)
- Very volatile assets may need shorter period
- Stable assets may need longer period
Q: Volume slope not visible?
A: - Enable "Enable Volume Slope Analysis"
- Check slope line width is 2 or higher
- Ensure slope colors are not too transparent
Q: Different from main price chart volume?
A: - This indicator uses Wilder's MA (exponential smoothing)
- Built-in TradingView volume uses SMA
- Both are valid—this is more responsive
Q: Works on all markets?
A: - ✅ Crypto (24/7 volume)
- ✅ Stocks (regular hours volume)
- ✅ Futures (tick volume)
- ⚠️ Forex (tick volume, less reliable)
- ⚠️ Indices (may need True Range option)
Q: Best settings for scalping?
A: - Reduce MA Length to 10-14
- Lower StdDev Period to 14
- Use "Part of Price" method with value 100-200
Q: Best settings for swing trading?
A: - Increase MA Length to 30-50
- Higher StdDev Period to 30
- Use "ATR" method with value 20-30
================================================================================
📜 VERSION HISTORY
================================================================================
v1.0 (Current - January 2025)
✅ Volume classification system (6 levels)
✅ Wilder's Moving Average calculation
✅ Wave volume tracking with labels
✅ Renko-style direction detection
✅ Volume slope analysis (Simple & LinReg)
✅ Standard deviation bands (1, 2, 3 sigma)
✅ Customizable ratio thresholds
✅ Volume candle coloring option
✅ Multi-method direction detection
✅ Scale factor for large volume numbers
Planned v2.0
🔜 Volume profile integration
🔜 VWAP deviation bands
🔜 Volume-weighted wave analysis
🔜 Automated divergence detection
🔜 Volume alerts (climax, exhaustion)
================================================================================
🧠 THE SCIENCE BEHIND VOLUME ANALYSIS
================================================================================
Core Volume Principles Applied
1. Volume Precedes Price
→ Major moves are preceded by volume expansion
→ Climax volume marks turning points
2. Volume Confirms Trend
→ Healthy trends have rising volume in trend direction
→ Declining volume = weakening trend
3. Exhaustion Patterns
→ Ultra-high volume at extremes = capitulation
→ Low volume at extremes = no conviction
4. Wave Volume Comparison
→ Compare effort (volume) to result (price movement)
→ High effort + low result = potential reversal
5. Standard Deviation Context
→ Statistical framework for "abnormal" volume
→ 3 sigma events are rare and significant
WHY THIS WORKS
- Smart Money Footprint: Large players can't hide volume
- Confirmation Tool: Volume validates or invalidates price moves
- Early Warning: Volume divergences precede price reversals
- Universal: Same principles work across all markets
================================================================================
⚠️ RISK DISCLAIMER
================================================================================
This indicator is an EDUCATIONAL TOOL for volume analysis. It does NOT
guarantee profits. Markets involve substantial risk of loss.
- Volume analysis is ONE piece of the puzzle
- Always combine with price structure analysis
- Use proper position sizing (1-2% risk per trade)
- Backtest strategies before live trading
- No indicator is 100% accurate
================================================================================
🎓 LEARNING PATH
================================================================================
BEGINNER
1. Start with just the colored volume bars
2. Learn to identify Ultra High and Very High volume events
3. Notice how price reacts after volume spikes
4. Track wave volume to see buyer vs seller strength
INTERMEDIATE
5. Enable StdDev bands to quantify "abnormal" volume
6. Use volume slope to confirm trend strength
7. Compare wave volumes for bias direction
8. Look for volume divergences with price
ADVANCED
9. Combine with Geometric Trading System angles
10. Trade volume climax reversals at geometric levels
11. Use wave volume ratios for position sizing
12. Develop volume-based entry/exit rules
================================================================================
💬 FINAL WORDS FROM THE ARCHITECT
================================================================================
"Price tells you WHAT happened. Volume tells you WHO made it happen. When
smart money moves, volume reveals their footprint. Learn to read the
volume story, and you'll see the market's intentions before they unfold."
Volume is the fuel that drives price. Without volume, moves are suspect.
With volume, moves are confirmed. Master volume analysis, and you'll
trade with conviction.
================================================================================
📊 Volume is the Heartbeat of the Market
© 2025 AstroTrade_ | Invite-Only TradingView Script
================================================================================
نص برمجي مفتوح المصدر
بروح TradingView الحقيقية، قام مبتكر هذا النص البرمجي بجعله مفتوح المصدر، بحيث يمكن للمتداولين مراجعة وظائفه والتحقق منها. شكرا للمؤلف! بينما يمكنك استخدامه مجانًا، تذكر أن إعادة نشر الكود يخضع لقواعد الموقع الخاصة بنا.

إخلاء المسؤولية
لا يُقصد بالمعلومات والمنشورات أن تكون، أو تشكل، أي نصيحة مالية أو استثمارية أو تجارية أو أنواع أخرى من النصائح أو التوصيات المقدمة أو المعتمدة من TradingView. اقرأ المزيد في شروط الاستخدام.
نص برمجي مفتوح المصدر
بروح TradingView الحقيقية، قام مبتكر هذا النص البرمجي بجعله مفتوح المصدر، بحيث يمكن للمتداولين مراجعة وظائفه والتحقق منها. شكرا للمؤلف! بينما يمكنك استخدامه مجانًا، تذكر أن إعادة نشر الكود يخضع لقواعد الموقع الخاصة بنا.
إخلاء المسؤولية
لا يُقصد بالمعلومات والمنشورات أن تكون، أو تشكل، أي نصيحة مالية أو استثمارية أو تجارية أو أنواع أخرى من النصائح أو التوصيات المقدمة أو المعتمدة من TradingView. اقرأ المزيد في شروط الاستخدام.