OPEN-SOURCE SCRIPT
تم تحديثه Trinity MA Ribbon with Trend Bias and VWAP
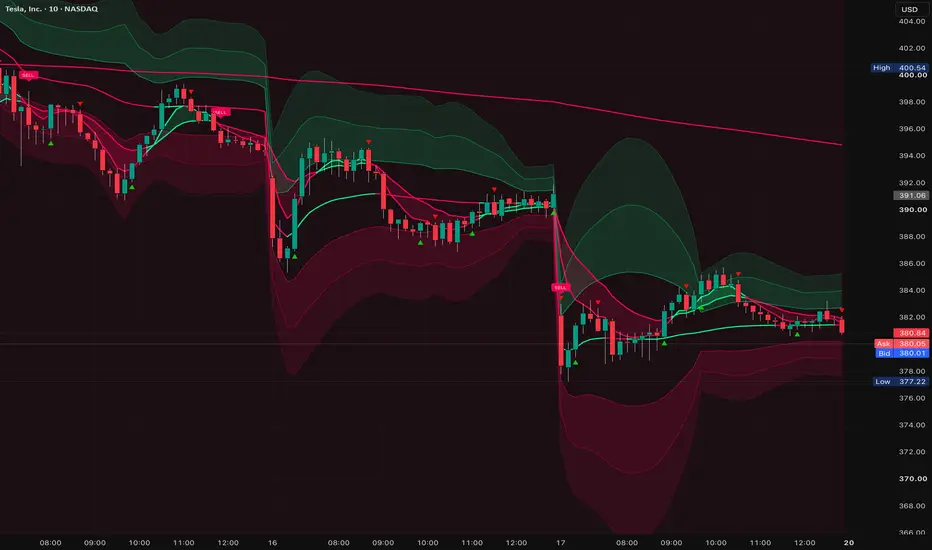
**TradingView User Guide: Trinity Buy and Sell Signals.
### Introduction
This simple indicator merges a short-term EMA/SMA ribbon for momentum, a long-term 350-period trend filter, and VWAP with customizable standard deviation bands. It is designed to give you clear trend direction, momentum timing, and dynamic support/resistance levels on one chart.
The **350 EMA/SMA** serves as the primary trend filter. It is especially effective because it captures the broader market structure while filtering out short-term noise. On intraday charts (like 5m or 15m), 350 periods roughly represents several days to a week of price action, making it an excellent anchor for determining the dominant bias. Trading in alignment with this filter significantly improves win rates by helping you avoid fighting the larger trend. You can toggle it on or off and adjust its length and type as needed.
### How to Add the Indicator
1. Open your chart on TradingView.
2. Click **Indicators** in the top toolbar.
3. Search for "**Trinity Buy and Sell Signals **".
4. Select and add it to your chart.
### Understanding the Visual Elements
The indicator displays several key elements with smart color coding:
- The **Trend MA (350)** appears as a thick line when enabled. It turns green when price is above it (bullish regime) and red when below it (bearish regime). This line acts as your main trend compass.
- The **Fast MA (10)** and **Slow MA (20)** create the ribbon. When the fast line is above the slow line, both turn green (bullish momentum). When the fast line is below the slow line, both turn red (bearish momentum).
- The **VWAP** line acts as a dynamic daily anchor. It turns green above VWAP and red below it.
- The **Standard Deviation Bands** (1st, 2nd, and 3rd) expand outward from VWAP. Upper bands use your chosen upper color (green by default) and lower bands use your chosen lower color (red by default). These bands highlight potential expansion or contraction zones.
- Small **BUY** and **SELL** labels appear on ribbon crossovers.
- The overall background tints light green in bullish trends and light red in bearish trends.
### Settings Explained
**Trend MA Group**
Toggle the 350 trend filter on or off, change its length, and choose between EMA or SMA. Keeping it on is recommended for most traders as it provides the core directional bias.
**Fast MA & Slow MA Groups**
Adjust the lengths and types of the ribbon lines.
**Labels Group**
Enable or disable the buy/sell crossover labels.
**VWAP Bands Group**
- Turn VWAP on or off.
- Individually toggle each deviation band (1SD, 2SD, or 3SD) so you can display only the levels you want.
- Set the standard deviation length and multipliers for band width.
**Colors Group**
Fully customize every major color in the indicator:
- Bullish Color (affects ribbon, trend MA, VWAP, labels, and background)
- Bearish Color
- Upper Bands Base Color
- Lower Bands Base Color
### How to Use This Indicator for Trading
Start by looking at the **background color and the 350 Trend MA**. This is your foundation. A green background and price above the 350 line means the overall trend is bullish — focus on long setups and avoid shorting. A red background and price below the 350 line signals a bearish environment — prioritize shorts and be cautious with longs.
This 350 filter is powerful because it keeps you aligned with institutional flow and reduces false signals from temporary noise. Many traders find that simply respecting this long-term line dramatically improves their results.
Next, use the **10/20 ribbon** for timing entries. A green ribbon confirms bullish momentum, while a red ribbon confirms bearish momentum. The best trades occur when the ribbon agrees with both the 350 trend and the VWAP position.
The **VWAP and deviation bands** provide excellent intraday and swing structure. Price above VWAP with green bands suggests bulls are in control. Price below VWAP with red bands suggests bears are dominant. Use the bands as dynamic targets — upper bands for profit-taking in uptrends and lower bands in downtrends. The area between bands can also help you place logical stop-losses.
**Practical Trading Workflow:**
- Check the background and 350 line first to determine allowed direction.
- Wait for the ribbon to flip in favor of the trend.
- Look for price interaction with VWAP or the deviation bands for precise entry.
- In strong trends, the price often respects the 1SD or 2SD bands as support or resistance.
### Pro Tips
- On lower timeframes, the 350 filter shines as a swing trend guide while VWAP bands work well for intraday mean reversion and breakouts.
- On higher timeframes, use the full setup for swing trading with the 350 as your primary trend decider.
- Hide outer bands (2SD or 3SD) during strong trends to reduce clutter.
- When price is stuck between the first upper and lower bands, the market is often ranging — wait for a decisive break.
- Always combine this indicator with clean price action and volume for the highest probability setups.
This indicator is highly flexible. Experiment with the settings to match your trading style, especially the individual band toggles and color customizations.
### Introduction
This simple indicator merges a short-term EMA/SMA ribbon for momentum, a long-term 350-period trend filter, and VWAP with customizable standard deviation bands. It is designed to give you clear trend direction, momentum timing, and dynamic support/resistance levels on one chart.
The **350 EMA/SMA** serves as the primary trend filter. It is especially effective because it captures the broader market structure while filtering out short-term noise. On intraday charts (like 5m or 15m), 350 periods roughly represents several days to a week of price action, making it an excellent anchor for determining the dominant bias. Trading in alignment with this filter significantly improves win rates by helping you avoid fighting the larger trend. You can toggle it on or off and adjust its length and type as needed.
### How to Add the Indicator
1. Open your chart on TradingView.
2. Click **Indicators** in the top toolbar.
3. Search for "**Trinity Buy and Sell Signals **".
4. Select and add it to your chart.
### Understanding the Visual Elements
The indicator displays several key elements with smart color coding:
- The **Trend MA (350)** appears as a thick line when enabled. It turns green when price is above it (bullish regime) and red when below it (bearish regime). This line acts as your main trend compass.
- The **Fast MA (10)** and **Slow MA (20)** create the ribbon. When the fast line is above the slow line, both turn green (bullish momentum). When the fast line is below the slow line, both turn red (bearish momentum).
- The **VWAP** line acts as a dynamic daily anchor. It turns green above VWAP and red below it.
- The **Standard Deviation Bands** (1st, 2nd, and 3rd) expand outward from VWAP. Upper bands use your chosen upper color (green by default) and lower bands use your chosen lower color (red by default). These bands highlight potential expansion or contraction zones.
- Small **BUY** and **SELL** labels appear on ribbon crossovers.
- The overall background tints light green in bullish trends and light red in bearish trends.
### Settings Explained
**Trend MA Group**
Toggle the 350 trend filter on or off, change its length, and choose between EMA or SMA. Keeping it on is recommended for most traders as it provides the core directional bias.
**Fast MA & Slow MA Groups**
Adjust the lengths and types of the ribbon lines.
**Labels Group**
Enable or disable the buy/sell crossover labels.
**VWAP Bands Group**
- Turn VWAP on or off.
- Individually toggle each deviation band (1SD, 2SD, or 3SD) so you can display only the levels you want.
- Set the standard deviation length and multipliers for band width.
**Colors Group**
Fully customize every major color in the indicator:
- Bullish Color (affects ribbon, trend MA, VWAP, labels, and background)
- Bearish Color
- Upper Bands Base Color
- Lower Bands Base Color
### How to Use This Indicator for Trading
Start by looking at the **background color and the 350 Trend MA**. This is your foundation. A green background and price above the 350 line means the overall trend is bullish — focus on long setups and avoid shorting. A red background and price below the 350 line signals a bearish environment — prioritize shorts and be cautious with longs.
This 350 filter is powerful because it keeps you aligned with institutional flow and reduces false signals from temporary noise. Many traders find that simply respecting this long-term line dramatically improves their results.
Next, use the **10/20 ribbon** for timing entries. A green ribbon confirms bullish momentum, while a red ribbon confirms bearish momentum. The best trades occur when the ribbon agrees with both the 350 trend and the VWAP position.
The **VWAP and deviation bands** provide excellent intraday and swing structure. Price above VWAP with green bands suggests bulls are in control. Price below VWAP with red bands suggests bears are dominant. Use the bands as dynamic targets — upper bands for profit-taking in uptrends and lower bands in downtrends. The area between bands can also help you place logical stop-losses.
**Practical Trading Workflow:**
- Check the background and 350 line first to determine allowed direction.
- Wait for the ribbon to flip in favor of the trend.
- Look for price interaction with VWAP or the deviation bands for precise entry.
- In strong trends, the price often respects the 1SD or 2SD bands as support or resistance.
### Pro Tips
- On lower timeframes, the 350 filter shines as a swing trend guide while VWAP bands work well for intraday mean reversion and breakouts.
- On higher timeframes, use the full setup for swing trading with the 350 as your primary trend decider.
- Hide outer bands (2SD or 3SD) during strong trends to reduce clutter.
- When price is stuck between the first upper and lower bands, the market is often ranging — wait for a decisive break.
- Always combine this indicator with clean price action and volume for the highest probability setups.
This indicator is highly flexible. Experiment with the settings to match your trading style, especially the individual band toggles and color customizations.
ملاحظات الأخبار
Updated for some major new upgrades. 1. Default Settings You Changed:
- **Fast MA** → **5** (was 10)
- **Slow MA** → **13** (was 20)
This creates a faster, more responsive ribbon ideal for scalping and short-term momentum trading (especially on 1m–15m charts).
2. Added new Trinity Flip Engine
**What is Trinity Flip?**
It’s a **momentum flip detector** based on candle structure.
**Logic (Simple Version):**
- Tracks whether the market is in a "Bull Control" or "Bear Control" state.
- **Bull Flip** (Green Triangle ↑): Triggered when price breaks above the previous bar’s high after being in bear control.
- **Bear Flip** (Red Triangle ↓): Triggered when price breaks below the previous bar’s low after being in bull control.
This is excellent for catching **early momentum shifts** and explosive moves.
**How to use Trinity Flip:**
- Turn on **"Use Trinity Flip Signals"**
- You will see **small colored triangles** only (no text labels)
- Green triangle below bar = Potential bullish momentum flip → good for long entries
- Red triangle above bar = Potential bearish momentum flip → good for short entries
**Pro Tip**: use Trinity Flip as a **confirmation** or **standalone aggressive signal** together with the 5/13 ribbon.
3. Added VWAP, higher MA and additional RSI to filter signals, each of these has a toggle to enable or disable if you dont want to use them as filter, but this will generate more noise and more signals. TIP: enable the RSI filter as the main signal filter.
نص برمجي مفتوح المصدر
بروح TradingView الحقيقية، قام مبتكر هذا النص البرمجي بجعله مفتوح المصدر، بحيث يمكن للمتداولين مراجعة وظائفه والتحقق منها. شكرا للمؤلف! بينما يمكنك استخدامه مجانًا، تذكر أن إعادة نشر الكود يخضع لقواعد الموقع الخاصة بنا.

إخلاء المسؤولية
لا يُقصد بالمعلومات والمنشورات أن تكون، أو تشكل، أي نصيحة مالية أو استثمارية أو تجارية أو أنواع أخرى من النصائح أو التوصيات المقدمة أو المعتمدة من TradingView. اقرأ المزيد في شروط الاستخدام.
نص برمجي مفتوح المصدر
بروح TradingView الحقيقية، قام مبتكر هذا النص البرمجي بجعله مفتوح المصدر، بحيث يمكن للمتداولين مراجعة وظائفه والتحقق منها. شكرا للمؤلف! بينما يمكنك استخدامه مجانًا، تذكر أن إعادة نشر الكود يخضع لقواعد الموقع الخاصة بنا.
إخلاء المسؤولية
لا يُقصد بالمعلومات والمنشورات أن تكون، أو تشكل، أي نصيحة مالية أو استثمارية أو تجارية أو أنواع أخرى من النصائح أو التوصيات المقدمة أو المعتمدة من TradingView. اقرأ المزيد في شروط الاستخدام.