OPEN-SOURCE SCRIPT
Yield Curve Regime
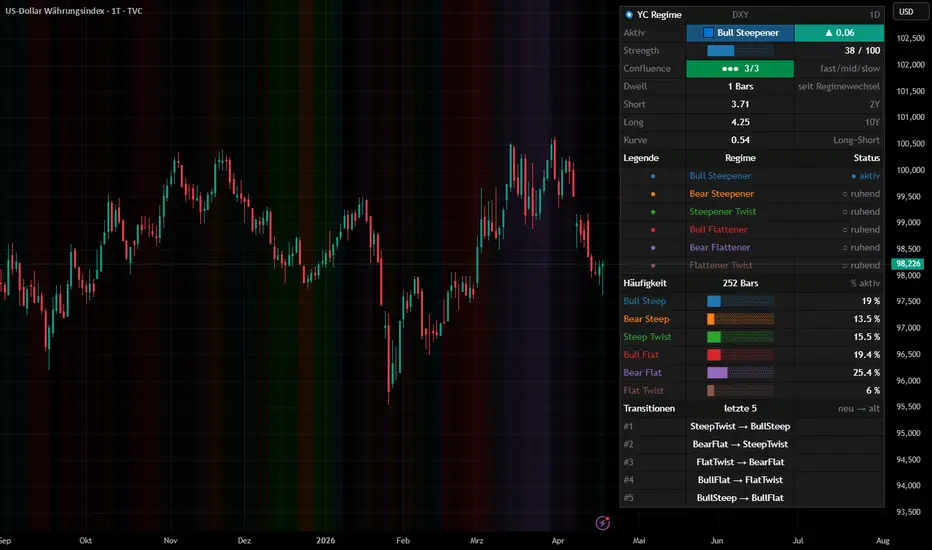
Yield Curve Regime – Pro Edition
=== WHAT IT DOES ===
This indicator classifies the U.S. Treasury yield curve into six canonical
regimes by comparing the current behavior of a short-maturity yield
(default 2Y) and a long-maturity yield (default 10Y) against their values
N bars ago. It paints the chart background (or bar color) with the
regime color and renders a modular on-chart dashboard showing the active
regime, a curve-delta trend arrow, live yield snapshots, a quantitative
strength score, multi-horizon confluence, dwell-time, rolling regime
frequencies, and a transition log.
=== WHY IT IS DIFFERENT ===
Most public yield-curve scripts plot the 10Y-2Y spread or flag a single
inversion event. This script decomposes every curve move into the two
dimensions that actually matter for fixed-income interpretation:
1) Curve direction : did the spread steepen or flatten?
2) Yield direction : did short and long yields rise or fall?
Crossing these dimensions produces six distinct regimes, each with a
different macro meaning. A +10 bp move in the 2s10s spread can be a
"Bull Steepener" (Fed easing – risk-on friendly) or a "Bear Steepener"
(inflation / term-premium driven – risk-off friendly). Flagging only
the spread hides that distinction; the six-regime framework exposes it.
On top of that six-regime base, this indicator adds four analytical
layers that, to the best of our knowledge, are not combined in any
existing public yield-curve script:
• A Z-score-based Strength score (0–100) that quantifies *how
convincing* each regime is instead of treating it as a binary flag.
Calibrated so |Z| = 2.0 (the 95 % confidence band) maps to 100.
• A Multi-Horizon Confluence score (0/3, 1/3, 2/3, 3/3) computed by
running the same regime detection on three independent offsets
(fast / mid / slow) and measuring agreement across horizons.
• A Dwell-Time counter plus a rolling history of the last N regime
transitions, so the viewer can see not just the current regime
but its persistence and transition path.
• A rolling Regime-Frequency statistic showing what percentage of
the last freqLen bars each regime occupied, rendered as an inline
bar and a precise percentage in a dedicated dashboard block.
These are genuine additions to the calculation – not cosmetics.
All of them are visualized in the on-chart dashboard so the reader
can consume the extra information at a glance.
=== THE SIX REGIMES (core logic) ===
Let curve = longRate - shortRate, compared against its value "offset"
bars ago. A regime fires when all three conditions hold simultaneously:
Bull Steepener : curve widens, short falls, long falls
(short falls faster – classic early easing cycle)
Bear Steepener : curve widens, short rises, long rises
(long rises faster – inflation / term premium / supply)
Steepener Twist : curve widens, short falls, long rises
(reflation pivot / policy-vs-inflation divergence)
Bull Flattener : curve narrows, short falls, long falls
(long falls faster – flight to quality / recession bid)
Bear Flattener : curve narrows, short rises, long rises
(short rises faster – aggressive Fed tightening)
Flattener Twist : curve narrows, short rises, long falls
(stagflation signal / tightening into weakness)
Exactly one regime fires per bar (the six conditions are mutually
exclusive by construction). When none triggers, the background stays
clean.
=== HOW TO READ THE DASHBOARD ===
• Header row – ticker + timeframe context.
• Active row – the regime currently firing, tinted in its own
color, with a ▲ / ▼ / ▬ arrow showing the signed
change of the curve over the fast offset window.
• Strength bar – █-fill from 0 to 100 plus the exact score.
• Confluence row – ●●● / ●●○ / ●○○ / ○○○ plus score 0/3 … 3/3.
• Dwell row – bars elapsed inside the current regime.
• Yields block – live short, long, and curve values.
• Legend block – every enabled regime with a colored dot and a
live "● aktiv" / "○ ruhend" status.
• Frequency block – each regime's share of the last freqLen bars,
shown as a 10-step bar plus exact percentage.
• Transitions – a log of the most recent regime changes
(newest first).
• Background/bars – tinted in the active regime's color, optionally
dimmed when Strength is low.
=== HOW TO READ THE ANALYTICAL LAYERS ===
• Strength bar (█████░░░░░ 65 / 100) – the farther right it fills,
the more statistically significant the regime move is relative to
its rolling volatility. Calibrated so a Z-aggregate of 2.0 (roughly
the 95 % band of a normal distribution) maps to a score of 100.
• Confluence (●●○ 2/3) – how many of the three horizons confirm the
fast-horizon regime. 3/3 is a strong multi-timeframe signal; 1/3 is
fast-only; 0/3 means no active regime on any horizon.
• Dwell – bars elapsed inside the current regime. Useful for spotting
exhausted vs. freshly-started regimes.
• Frequency – every regime's rolling share of the freqLen window,
letting you see at a glance which regime has dominated the current
macro cycle.
• Transitions – a compact log of the most recent regime changes.
=== SETTINGS (all inputs are grouped and collapsible) ===
• Symbols & Offset – pick any two yield tickers plus three lookback
windows (fast / mid / slow) for confluence.
• Detection – rolling window for frequency statistics,
maximum stored transitions.
• Display – background vs. bar coloring, transparency,
optional strength-coupled transparency.
• Regime selection– enable/disable any subset of the six regimes.
• Color palette – fully user-overridable regime colors.
• Dashboard – master toggle, compact mode (active regime only),
independent per-section toggles for header,
active+strength, confluence, dwell, yields,
legend, frequency, and transitions, plus
configurable position and text size.
=== HOW TO USE IT ===
• As a macro / risk-regime filter on SPX, NDX, DXY, TLT, HYG, BTC,
gold or any risk-sensitive instrument: the regime in force often
explains why cross-asset correlations are behaving the way they are.
• To disambiguate yield-curve headlines: a "curve is steepening"
print means something very different if it is a Bull Steepener vs.
a Bear Steepener; this indicator answers that question at a glance.
• To study historical regime transitions: switch background mode on
and scroll back through past cycles to see how regimes clustered
around recessions, pivots, and inflation shocks.
• The offset inputs let you tune sensitivity: 1 bar for intraday
regime nowcasting, 5–20 bars for swing and macro framing.
=== NOTES & LIMITATIONS ===
• Defaults to US02Y and US10Y but accepts any two yield symbols –
not hard-coded to U.S. Treasuries; works on Bund, Gilt, JGB curves
if the data is available on your plan.
• Regimes are evaluated on bar-close comparisons and can flip
intrabar on lower timeframes; use daily or weekly for stable macro
readings.
• The Strength score relies on rolling standard deviations over a
50-bar window. On low-liquidity / low-frequency data the σ estimate
can be unstable for the first 50 bars after loading.
• Multi-Horizon Confluence runs the raw regime detection on mid and
slow offsets, so slower horizons can confirm a faster signal even
when their Δcurve is small – this is by design, not a bug.
• The Steepener Twist and Flattener Twist cases are structurally
rarer than the four main regimes and often mark transitions rather
than trends – treat them as context, not as standalone signals.
• This is an analytical / visual tool, not a buy/sell system. It does
not generate entries, exits, or forecasts.
=== WHAT IT DOES ===
This indicator classifies the U.S. Treasury yield curve into six canonical
regimes by comparing the current behavior of a short-maturity yield
(default 2Y) and a long-maturity yield (default 10Y) against their values
N bars ago. It paints the chart background (or bar color) with the
regime color and renders a modular on-chart dashboard showing the active
regime, a curve-delta trend arrow, live yield snapshots, a quantitative
strength score, multi-horizon confluence, dwell-time, rolling regime
frequencies, and a transition log.
=== WHY IT IS DIFFERENT ===
Most public yield-curve scripts plot the 10Y-2Y spread or flag a single
inversion event. This script decomposes every curve move into the two
dimensions that actually matter for fixed-income interpretation:
1) Curve direction : did the spread steepen or flatten?
2) Yield direction : did short and long yields rise or fall?
Crossing these dimensions produces six distinct regimes, each with a
different macro meaning. A +10 bp move in the 2s10s spread can be a
"Bull Steepener" (Fed easing – risk-on friendly) or a "Bear Steepener"
(inflation / term-premium driven – risk-off friendly). Flagging only
the spread hides that distinction; the six-regime framework exposes it.
On top of that six-regime base, this indicator adds four analytical
layers that, to the best of our knowledge, are not combined in any
existing public yield-curve script:
• A Z-score-based Strength score (0–100) that quantifies *how
convincing* each regime is instead of treating it as a binary flag.
Calibrated so |Z| = 2.0 (the 95 % confidence band) maps to 100.
• A Multi-Horizon Confluence score (0/3, 1/3, 2/3, 3/3) computed by
running the same regime detection on three independent offsets
(fast / mid / slow) and measuring agreement across horizons.
• A Dwell-Time counter plus a rolling history of the last N regime
transitions, so the viewer can see not just the current regime
but its persistence and transition path.
• A rolling Regime-Frequency statistic showing what percentage of
the last freqLen bars each regime occupied, rendered as an inline
bar and a precise percentage in a dedicated dashboard block.
These are genuine additions to the calculation – not cosmetics.
All of them are visualized in the on-chart dashboard so the reader
can consume the extra information at a glance.
=== THE SIX REGIMES (core logic) ===
Let curve = longRate - shortRate, compared against its value "offset"
bars ago. A regime fires when all three conditions hold simultaneously:
Bull Steepener : curve widens, short falls, long falls
(short falls faster – classic early easing cycle)
Bear Steepener : curve widens, short rises, long rises
(long rises faster – inflation / term premium / supply)
Steepener Twist : curve widens, short falls, long rises
(reflation pivot / policy-vs-inflation divergence)
Bull Flattener : curve narrows, short falls, long falls
(long falls faster – flight to quality / recession bid)
Bear Flattener : curve narrows, short rises, long rises
(short rises faster – aggressive Fed tightening)
Flattener Twist : curve narrows, short rises, long falls
(stagflation signal / tightening into weakness)
Exactly one regime fires per bar (the six conditions are mutually
exclusive by construction). When none triggers, the background stays
clean.
=== HOW TO READ THE DASHBOARD ===
• Header row – ticker + timeframe context.
• Active row – the regime currently firing, tinted in its own
color, with a ▲ / ▼ / ▬ arrow showing the signed
change of the curve over the fast offset window.
• Strength bar – █-fill from 0 to 100 plus the exact score.
• Confluence row – ●●● / ●●○ / ●○○ / ○○○ plus score 0/3 … 3/3.
• Dwell row – bars elapsed inside the current regime.
• Yields block – live short, long, and curve values.
• Legend block – every enabled regime with a colored dot and a
live "● aktiv" / "○ ruhend" status.
• Frequency block – each regime's share of the last freqLen bars,
shown as a 10-step bar plus exact percentage.
• Transitions – a log of the most recent regime changes
(newest first).
• Background/bars – tinted in the active regime's color, optionally
dimmed when Strength is low.
=== HOW TO READ THE ANALYTICAL LAYERS ===
• Strength bar (█████░░░░░ 65 / 100) – the farther right it fills,
the more statistically significant the regime move is relative to
its rolling volatility. Calibrated so a Z-aggregate of 2.0 (roughly
the 95 % band of a normal distribution) maps to a score of 100.
• Confluence (●●○ 2/3) – how many of the three horizons confirm the
fast-horizon regime. 3/3 is a strong multi-timeframe signal; 1/3 is
fast-only; 0/3 means no active regime on any horizon.
• Dwell – bars elapsed inside the current regime. Useful for spotting
exhausted vs. freshly-started regimes.
• Frequency – every regime's rolling share of the freqLen window,
letting you see at a glance which regime has dominated the current
macro cycle.
• Transitions – a compact log of the most recent regime changes.
=== SETTINGS (all inputs are grouped and collapsible) ===
• Symbols & Offset – pick any two yield tickers plus three lookback
windows (fast / mid / slow) for confluence.
• Detection – rolling window for frequency statistics,
maximum stored transitions.
• Display – background vs. bar coloring, transparency,
optional strength-coupled transparency.
• Regime selection– enable/disable any subset of the six regimes.
• Color palette – fully user-overridable regime colors.
• Dashboard – master toggle, compact mode (active regime only),
independent per-section toggles for header,
active+strength, confluence, dwell, yields,
legend, frequency, and transitions, plus
configurable position and text size.
=== HOW TO USE IT ===
• As a macro / risk-regime filter on SPX, NDX, DXY, TLT, HYG, BTC,
gold or any risk-sensitive instrument: the regime in force often
explains why cross-asset correlations are behaving the way they are.
• To disambiguate yield-curve headlines: a "curve is steepening"
print means something very different if it is a Bull Steepener vs.
a Bear Steepener; this indicator answers that question at a glance.
• To study historical regime transitions: switch background mode on
and scroll back through past cycles to see how regimes clustered
around recessions, pivots, and inflation shocks.
• The offset inputs let you tune sensitivity: 1 bar for intraday
regime nowcasting, 5–20 bars for swing and macro framing.
=== NOTES & LIMITATIONS ===
• Defaults to US02Y and US10Y but accepts any two yield symbols –
not hard-coded to U.S. Treasuries; works on Bund, Gilt, JGB curves
if the data is available on your plan.
• Regimes are evaluated on bar-close comparisons and can flip
intrabar on lower timeframes; use daily or weekly for stable macro
readings.
• The Strength score relies on rolling standard deviations over a
50-bar window. On low-liquidity / low-frequency data the σ estimate
can be unstable for the first 50 bars after loading.
• Multi-Horizon Confluence runs the raw regime detection on mid and
slow offsets, so slower horizons can confirm a faster signal even
when their Δcurve is small – this is by design, not a bug.
• The Steepener Twist and Flattener Twist cases are structurally
rarer than the four main regimes and often mark transitions rather
than trends – treat them as context, not as standalone signals.
• This is an analytical / visual tool, not a buy/sell system. It does
not generate entries, exits, or forecasts.
نص برمجي مفتوح المصدر
بروح TradingView الحقيقية، قام مبتكر هذا النص البرمجي بجعله مفتوح المصدر، بحيث يمكن للمتداولين مراجعة وظائفه والتحقق منها. شكرا للمؤلف! بينما يمكنك استخدامه مجانًا، تذكر أن إعادة نشر الكود يخضع لقواعد الموقع الخاصة بنا.

إخلاء المسؤولية
لا يُقصد بالمعلومات والمنشورات أن تكون، أو تشكل، أي نصيحة مالية أو استثمارية أو تجارية أو أنواع أخرى من النصائح أو التوصيات المقدمة أو المعتمدة من TradingView. اقرأ المزيد في شروط الاستخدام.
نص برمجي مفتوح المصدر
بروح TradingView الحقيقية، قام مبتكر هذا النص البرمجي بجعله مفتوح المصدر، بحيث يمكن للمتداولين مراجعة وظائفه والتحقق منها. شكرا للمؤلف! بينما يمكنك استخدامه مجانًا، تذكر أن إعادة نشر الكود يخضع لقواعد الموقع الخاصة بنا.
إخلاء المسؤولية
لا يُقصد بالمعلومات والمنشورات أن تكون، أو تشكل، أي نصيحة مالية أو استثمارية أو تجارية أو أنواع أخرى من النصائح أو التوصيات المقدمة أو المعتمدة من TradingView. اقرأ المزيد في شروط الاستخدام.