Gold-Silver Ratio Monitor - Light
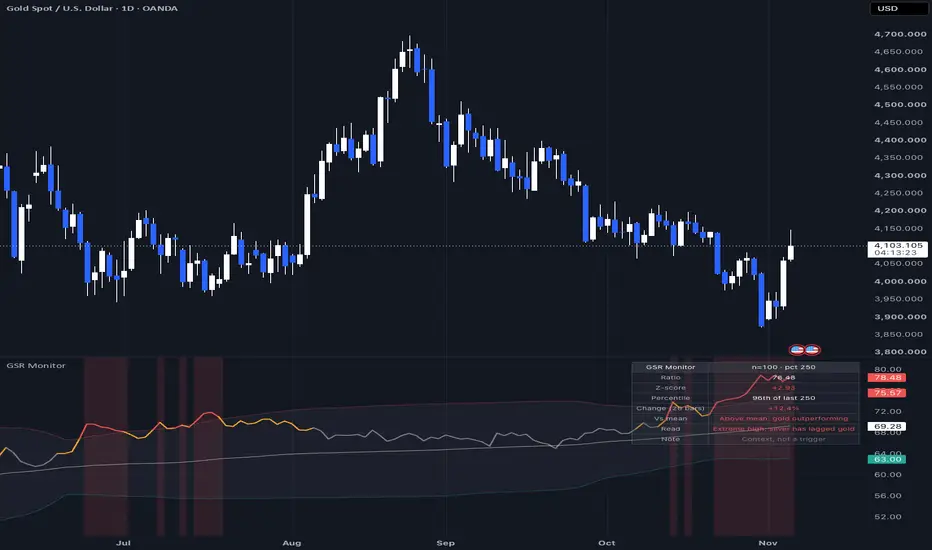
The gold-silver ratio — how many ounces of silver one ounce of gold buys — read against its own recent history: a rolling mean, z-score bands, a one-year percentile and a compact dashboard that says in plain words whether silver is lagging or outrunning gold.
WHAT IT DOES
• Computes the ratio from two symbols of your choice (default: gold spot / silver spot), on the chart timeframe or on a fixed one (daily is the classic reading).
• Plots the ratio, its rolling mean and ± z-score bands; the line changes colour as the ratio moves from normal to stretched to extreme, and the background is tinted at extremes.
• Dashboard (top right): ratio, z-score, percentile over the last N bars, change over the last 20 bars, position versus the mean, and a one-line read ("Extreme high: silver has lagged gold", "Normal range", …).
• Six alerts, all on transitions: z-score crossing above/below the extreme threshold, coming back inside, and the ratio crossing its mean in either direction.
HOW TO READ IT
A high ratio means silver is cheap relative to gold; a low ratio means silver has outrun gold. The z-score tells you how unusual the current level is versus the window you chose, and the percentile tells you where it sits over roughly a year. These are descriptions of the present. A stretched ratio can stay stretched for months; the tool does not say when, or whether, it will revert.
HOW TO USE
1. Add to any chart. The default symbols are OANDA:XAUUSD and OANDA:XAGUSD; change them if you trade futures or CFDs, or tick "Use current chart as gold".
2. Pick the timeframe. Daily with a 100-bar mean and a 250-bar percentile is a sensible default; intraday readings are noisier.
3. Use the read line as context for your gold or silver trade, not as a trigger. If you want notifications, enable the alerts.
SETTINGS
Gold symbol · Silver symbol · Use current chart as gold · Timeframe · Mean / z-score length (100) · Percentile length (250) · Change lookback (20) · Stretched threshold (1.0) · Extreme threshold (2.0) · mean, bands, background tint, dashboard position and size.
NOTES
Both series are requested without lookahead; nothing repaints. Division is guarded (no value when silver data is missing or zero). Pine Script v6, compiles with zero warnings. Open-source so you can audit every line.
No indicator is infallible. Nothing here is financial advice — every trading decision is your own.
WHAT IT DOES
• Computes the ratio from two symbols of your choice (default: gold spot / silver spot), on the chart timeframe or on a fixed one (daily is the classic reading).
• Plots the ratio, its rolling mean and ± z-score bands; the line changes colour as the ratio moves from normal to stretched to extreme, and the background is tinted at extremes.
• Dashboard (top right): ratio, z-score, percentile over the last N bars, change over the last 20 bars, position versus the mean, and a one-line read ("Extreme high: silver has lagged gold", "Normal range", …).
• Six alerts, all on transitions: z-score crossing above/below the extreme threshold, coming back inside, and the ratio crossing its mean in either direction.
HOW TO READ IT
A high ratio means silver is cheap relative to gold; a low ratio means silver has outrun gold. The z-score tells you how unusual the current level is versus the window you chose, and the percentile tells you where it sits over roughly a year. These are descriptions of the present. A stretched ratio can stay stretched for months; the tool does not say when, or whether, it will revert.
HOW TO USE
1. Add to any chart. The default symbols are OANDA:XAUUSD and OANDA:XAGUSD; change them if you trade futures or CFDs, or tick "Use current chart as gold".
2. Pick the timeframe. Daily with a 100-bar mean and a 250-bar percentile is a sensible default; intraday readings are noisier.
3. Use the read line as context for your gold or silver trade, not as a trigger. If you want notifications, enable the alerts.
SETTINGS
Gold symbol · Silver symbol · Use current chart as gold · Timeframe · Mean / z-score length (100) · Percentile length (250) · Change lookback (20) · Stretched threshold (1.0) · Extreme threshold (2.0) · mean, bands, background tint, dashboard position and size.
NOTES
Both series are requested without lookahead; nothing repaints. Division is guarded (no value when silver data is missing or zero). Pine Script v6, compiles with zero warnings. Open-source so you can audit every line.
No indicator is infallible. Nothing here is financial advice — every trading decision is your own.

Measured, not assumed. Full studies with sample sizes and confidence intervals: deltaterminal.io/research
إخلاء المسؤولية
لا يُقصد بالمعلومات والمنشورات أن تكون، أو تشكل، أي نصيحة مالية أو استثمارية أو تجارية أو أنواع أخرى من النصائح أو التوصيات المقدمة أو المعتمدة من TradingView. اقرأ المزيد في شروط الاستخدام.
Measured, not assumed. Full studies with sample sizes and confidence intervals: deltaterminal.io/research
إخلاء المسؤولية
لا يُقصد بالمعلومات والمنشورات أن تكون، أو تشكل، أي نصيحة مالية أو استثمارية أو تجارية أو أنواع أخرى من النصائح أو التوصيات المقدمة أو المعتمدة من TradingView. اقرأ المزيد في شروط الاستخدام.