تم تحديثه
MOVE vs VIX - 1-Year Range Position
MOVE vs VIX - 1-Year Range Position compares how elevated Treasury-bond and equity volatility are within their own recent daily closing-value ranges.
MOVE and VIX have different scales, so subtracting their raw index levels does not make a useful like-for-like comparison. This indicator first expresses each index on the same 0-100 range-position scale, then subtracts VIX's position from MOVE's.
CALCULATION
For each index:
Range position = 100 x (latest daily close - lowest daily close in the window) / (highest daily close in the window - lowest daily close in the window).
The default window is 252 daily observations, including the evaluated day's close and the preceding 251 source sessions. This approximates one trading year. The extremes use daily CLOSING values, not intraday highs and lows.
Difference = MOVE range position - VIX range position.
A positive difference means MOVE is higher within its own recent range than VIX is within its own range. A negative difference means the reverse. For example, MOVE at 87% and VIX at 10% gives a difference of +77 percentage points.
This is range normalization, not statistical percentile rank. A reading of 87% means 87% of the distance from the lowest close to the highest close; it does not mean the reading exceeds 87% of historical observations.
SETUP AND DISPLAY
Use a standard 1D chart of TVC:MOVE. The default requested sources are TVC:MOVE and CBOE:VIX.
For the three-panel layout, add this same indicator three times. Set Panel to MOVE on the first instance, VIX on the second, and Difference on the third. Keep the symbols and window length identical across the instances.
The default fractional display uses 0-1: 0.87 means 87%. Disable Use 0-1 scale to show 0-100 units instead. The difference can be negative. The table always displays percentages and percentage points and shows the date of the latest matched pair.
Green columns show a positive difference; red columns show a negative difference. The orange reference defaults to +60 percentage points, displayed as 0.60 on the fractional scale. Orange marks on the price chart identify upward crossings of that threshold on consecutive valid chart bars. The threshold is a visual reference, not a calibrated trading signal.
The publication chart also shows the raw MOVE and VIX lines. To recreate those lines, use MOVE as the main chart and add VIX with TradingView's Compare function on a separate price scale. The Pine script supplies the normalized panels and table; it does not add the raw comparison line automatically.
DATA HANDLING AND LIMITATIONS
This implementation combines separate daily-source calculations, matching-trading-date checks, a dated summary table, and three selectable views. Each window is calculated in its index's own daily context. Missing values are not replaced by zero or forward-filled into the difference. An incomplete window or an unchanged, zero-width range returns no value.
Source trading dates must match each other and the chart bar. The table can retain an older complete pair during an interruption; check its As of date. The source windows can cover slightly different calendar spans, and VIX-only sessions do not appear on a MOVE chart even though they count in VIX's own window.
A session is plotted once its scheduled close has passed when the script runs. Pine runs when the chart updates, so a newly closed session and its crossing mark may require a chart reload. Data feeds can be delayed or revised. Crossing marks are not drawn across missing bars. Only standard daily charts are supported.
The indicator describes relative positions in historical ranges. It does not predict that one index will catch up with the other and contains no trade execution or tested trading strategy.
MOVE and VIX have different scales, so subtracting their raw index levels does not make a useful like-for-like comparison. This indicator first expresses each index on the same 0-100 range-position scale, then subtracts VIX's position from MOVE's.
CALCULATION
For each index:
Range position = 100 x (latest daily close - lowest daily close in the window) / (highest daily close in the window - lowest daily close in the window).
The default window is 252 daily observations, including the evaluated day's close and the preceding 251 source sessions. This approximates one trading year. The extremes use daily CLOSING values, not intraday highs and lows.
Difference = MOVE range position - VIX range position.
A positive difference means MOVE is higher within its own recent range than VIX is within its own range. A negative difference means the reverse. For example, MOVE at 87% and VIX at 10% gives a difference of +77 percentage points.
This is range normalization, not statistical percentile rank. A reading of 87% means 87% of the distance from the lowest close to the highest close; it does not mean the reading exceeds 87% of historical observations.
SETUP AND DISPLAY
Use a standard 1D chart of TVC:MOVE. The default requested sources are TVC:MOVE and CBOE:VIX.
For the three-panel layout, add this same indicator three times. Set Panel to MOVE on the first instance, VIX on the second, and Difference on the third. Keep the symbols and window length identical across the instances.
The default fractional display uses 0-1: 0.87 means 87%. Disable Use 0-1 scale to show 0-100 units instead. The difference can be negative. The table always displays percentages and percentage points and shows the date of the latest matched pair.
Green columns show a positive difference; red columns show a negative difference. The orange reference defaults to +60 percentage points, displayed as 0.60 on the fractional scale. Orange marks on the price chart identify upward crossings of that threshold on consecutive valid chart bars. The threshold is a visual reference, not a calibrated trading signal.
The publication chart also shows the raw MOVE and VIX lines. To recreate those lines, use MOVE as the main chart and add VIX with TradingView's Compare function on a separate price scale. The Pine script supplies the normalized panels and table; it does not add the raw comparison line automatically.
DATA HANDLING AND LIMITATIONS
This implementation combines separate daily-source calculations, matching-trading-date checks, a dated summary table, and three selectable views. Each window is calculated in its index's own daily context. Missing values are not replaced by zero or forward-filled into the difference. An incomplete window or an unchanged, zero-width range returns no value.
Source trading dates must match each other and the chart bar. The table can retain an older complete pair during an interruption; check its As of date. The source windows can cover slightly different calendar spans, and VIX-only sessions do not appear on a MOVE chart even though they count in VIX's own window.
A session is plotted once its scheduled close has passed when the script runs. Pine runs when the chart updates, so a newly closed session and its crossing mark may require a chart reload. Data feeds can be delayed or revised. Crossing marks are not drawn across missing bars. Only standard daily charts are supported.
The indicator describes relative positions in historical ranges. It does not predict that one index will catch up with the other and contains no trade execution or tested trading strategy.
ملاحظات الأخبار
Use this indicator on TVC:MOVE or the native MOVE/VIX ratio chart. Other chart symbols with different trading sessions can show earlier source dates or even blank daily panels.Added support for standard time-based chart intervals, including daily, weekly and monthly, while keeping the original 252 DAILY-close low/high range calculation. The original MOVE, VIX and Difference panel options and colours are preserved.
Weekly/monthly views sample the latest available matched, completed daily pair for each displayed period. The source trading date is shown in the table and Data Window. Different exchange closing hours can select an earlier session; source-date checks now avoid blanking a weekly/monthly value just because an index feed closes later than the chart.
Timing: intraday charts map daily snapshots and can lag by a session depending on feed/session alignment. Pine also needs a chart update to refresh. Check the table’s As of date after market close and reload if stale. Daily or weekly views are recommended for current comparison.
Threshold highlights use the displayed samples. Weekly/monthly charts can omit daily crossings that occurred between samples; use D to inspect all daily crossings.
The calculation remains position in each index’s trailing daily-close range, not statistical percentile rank. No orders or strategies were added.
ملاحظات الأخبار
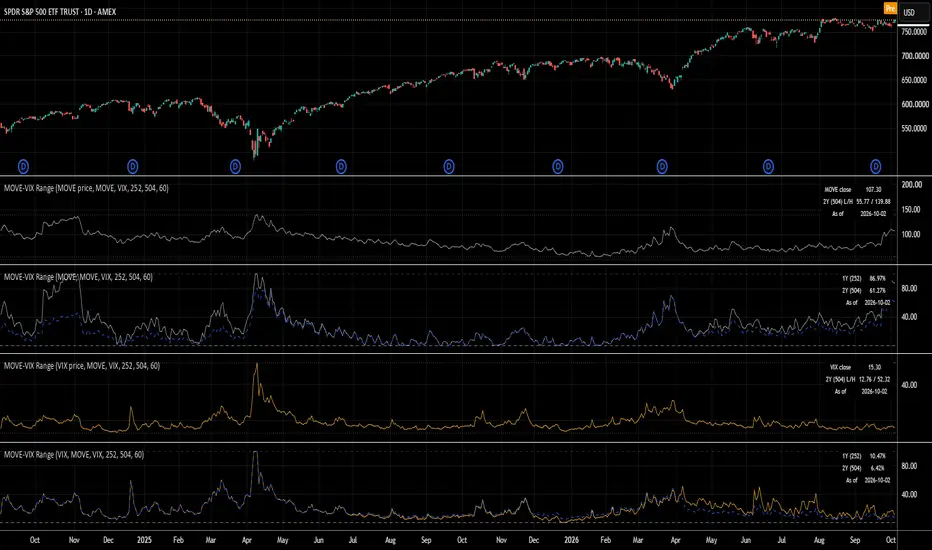
Added actual index charts and one-year / two-year range context.Use four copies beneath your main trading chart, with Panel set to MOVE price, MOVE, VIX price, and VIX. The price views show actual matched daily closes with the latest comparison-window low/high guides and a dated readout. The MOVE and VIX oscillators each show a solid primary-window line and a dashed blue comparison-window line.
Defaults are 252 and 504 daily closing observations, approximately one and two trading years. Turn off Use 0-1 scale for 0-100 oscillator values. Both windows remain configurable, and the labels show their actual lengths. Price panes always use index units.
Range position = 100 * (close - lowest close) / (highest close - lowest close), including the sampled close. It measures distance along a low/high range, not statistical percentile rank. A longer window adds context but can still be dominated by an older extreme. The raw index chart helps show that context.
The existing Difference and MOVE + VIX views keep the primary-window comparison. Default source feeds are TVC:MOVE and TVC:VIX. Calculations use their own daily histories on standard time-based charts; changing your chart symbol does not substitute its prices.
Price, bounds, and range positions use the same completed matching source dates. Unmatched sessions hold the preceding valid pair and its date. An earlier-closing host market may show a previous index session; check As of in the readouts. A stopped chart may need a tick or reload after a source close. Incomplete history or a flat range leaves the affected position undefined.
Saved example layout: tradingview.com/chart/k4oJQOFY/

إخلاء المسؤولية
لا يُقصد بالمعلومات والمنشورات أن تكون، أو تشكل، أي نصيحة مالية أو استثمارية أو تجارية أو أنواع أخرى من النصائح أو التوصيات المقدمة أو المعتمدة من TradingView. اقرأ المزيد في شروط الاستخدام.
إخلاء المسؤولية
لا يُقصد بالمعلومات والمنشورات أن تكون، أو تشكل، أي نصيحة مالية أو استثمارية أو تجارية أو أنواع أخرى من النصائح أو التوصيات المقدمة أو المعتمدة من TradingView. اقرأ المزيد في شروط الاستخدام.