OPEN-SOURCE SCRIPT
Sector Relative Strength (DTR)
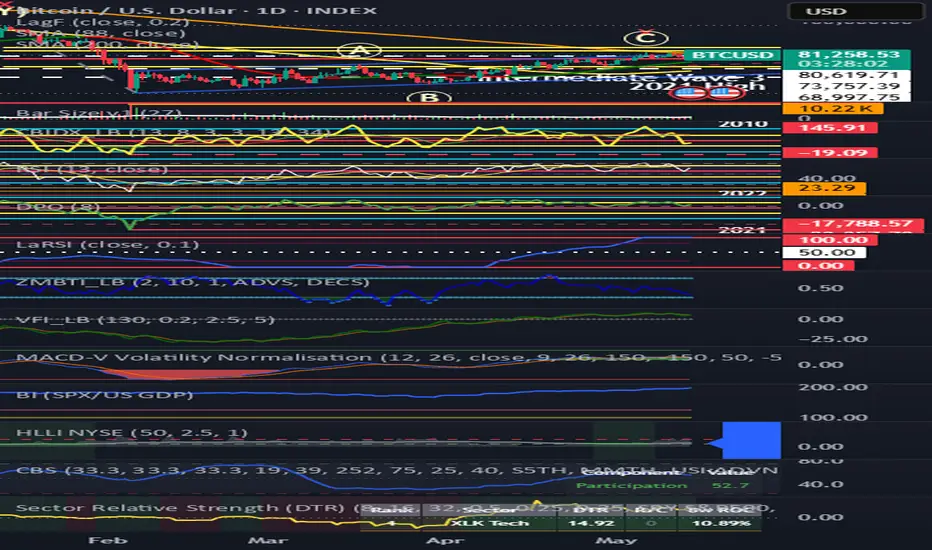
█ OVERVIEW
This indicator ranks the eleven SPDR sector ETFs (plus SPY as a benchmark) by a weighted multi-timeframe rate-of-change composite, plotted as a single line with an accompanying ranking table. The approach replicates a well-known sector rotation framework that uses three overlapping momentum windows to identify which sectors are gaining or losing relative strength on a weekly basis.
The composite score (labeled "DTR") weights a short-term, medium-term, and long-term rate of change so that the effective center of the measurement sits at approximately sixteen weeks. Sectors are ranked by this score each week and the rank change column (R/C) tracks rotational momentum: which sectors are climbing or falling in the standings.
█ HOW IT WORKS
The DTR score for each sector is computed as:
Pine Script®
where each ROC is a simple percent change (current weekly close versus the close N weeks ago), and the default weights are 50% / 25% / 25%. This weighting places half the emphasis on recent momentum while anchoring the composite with longer-term trend context. The weighted average lookback under default settings is:
Pine Script®
All price data is forced to weekly resolution via request.security, so the indicator produces identical results regardless of the chart timeframe. The twelve sectors are ranked in descending order by DTR score each week.
█ SECTOR UNIVERSE
The indicator tracks twelve symbols:
• XLK Technology
• XLV Health Care
• XLE Energy
• XLF Financials
• XLC Communication Services
• XLY Consumer Discretionary
• XLP Consumer Staples
• XLI Industrials
• XLB Materials
• XLRE Real Estate
• XLU Utilities
• SPY S&P 500 (benchmark)
SPY is included as the twelfth entry so you can see where the broad market sits relative to individual sectors. A sector ranked above SPY is outperforming the market on the composite momentum measure; a sector ranked below SPY is underperforming.
█ READING THE CHART
Plotted line
The yellow line shows the DTR score for one selected sector. When the chart symbol is one of the twelve tracked ETFs, that sector is plotted automatically. When the chart symbol is anything else (an individual stock, a futures contract, crypto), the indicator plots whichever sector is selected in the "Plot Sector" dropdown, which defaults to SPY.
• DTR above zero: the selected sector has positive weighted momentum across the composite lookback
• DTR below zero: negative weighted momentum
• DTR rising: momentum is accelerating
• DTR falling: momentum is decelerating, even if still positive
The green/red background shading reflects the sign of the plotted DTR score.
Ranking table
The table (toggled via settings) displays all twelve symbols sorted by DTR score, with five columns:
• Rank: current position (1 = strongest)
• Sector: ticker and sector name
• DTR: the composite score
• R/C: rank change from the prior week (positive = improving, shown in green; negative = deteriorating, shown in red)
• 8w ROC: the short-term rate of change alone, for additional context
The currently plotted sector is highlighted with a yellow background in the table. Rows with positive DTR scores have green-tinted backgrounds; negative scores have red-tinted backgrounds.
What to look for
• Sectors at the top of the table with positive and rising R/C values are in strong rotational momentum. These are the sectors institutional capital is flowing into.
• Sectors falling in rank (negative R/C) even while DTR is still positive are showing early deceleration. This is often where rotation out of a sector begins before price breaks down.
• When SPY sits in the bottom half of the rankings, most sectors are outperforming the broad market, which can indicate a broad-based rally. When SPY is near the top, few sectors are keeping up, suggesting narrow market leadership.
• Clusters of defensive sectors (XLU, XLP, XLV) rising in rank while cyclicals (XLK, XLY, XLI) fall is a classic late-cycle rotation signal.
█ INPUTS
• Short / Medium / Long ROC (weeks): the three lookback periods, defaulting to 8, 16, and 32 weeks
• Weight: Short / Medium / Long ROC: the weight applied to each period, defaulting to 0.50, 0.25, 0.25. These should sum to 1.0 for a properly scaled composite, though the script does not enforce this, allowing deliberate over- or under-weighting
• Plot Sector: which sector's DTR score to plot when the chart symbol is not in the universe. Ignored when the chart symbol matches one of the twelve tracked ETFs
• Show Ranking Table: toggle the table on or off
• Table Position: corner placement of the ranking table
█ LIMITATIONS AND NOTES
• The indicator requires at least 32 weeks of weekly data history to compute the longest default ROC. On symbols or exchanges with limited history, early bars will show na values.
• All data is pulled at weekly resolution. The DTR score updates once per week at the weekly close. Intraweek movements are not reflected until the current weekly bar closes.
• The sector universe is hardcoded to the eleven SPDR Select Sector ETFs plus SPY. These ETFs use the GICS classification system. Some sectors (notably XLC, which replaced the old Telecom sector in 2018) have limited history prior to their inception date.
• The R/C column compares the current week's rank to the prior week's rank. A single week of rank change can be noisy; persistent rank trends over multiple weeks are more informative.
• The weights are user-configurable but the "centered at N weeks" interpretation only holds when weights sum to 1.0.
█ METHODOLOGY NOTES
This approach to sector relative strength analysis is well-established in the technical analysis community. The multi-timeframe weighted ROC method has been used by practitioners including Tom Dorsey (Dorsey Wright & Associates) and other relative strength analysts for decades. The specific weighting scheme implemented here (50% short / 25% medium / 25% long, centered at approximately 16 weeks) comes from a publicly shared analysis of Fidelity sector fund rankings at the time of the March 2000 dot-com peak, which demonstrated the framework's ability to capture sector rotation during a major market inflection.
The SPDR sector ETFs used in this implementation are the most liquid and widely tracked sector vehicles available on US exchanges, making them the natural modern equivalent of the Fidelity sector fund universe used in the original analysis.
═════════════════════════════════════════════════════════════════════════
Disclaimer: This script is provided for educational and informational purposes only. It is not financial advice. Past indicator behavior does not guarantee future results.
This indicator ranks the eleven SPDR sector ETFs (plus SPY as a benchmark) by a weighted multi-timeframe rate-of-change composite, plotted as a single line with an accompanying ranking table. The approach replicates a well-known sector rotation framework that uses three overlapping momentum windows to identify which sectors are gaining or losing relative strength on a weekly basis.
The composite score (labeled "DTR") weights a short-term, medium-term, and long-term rate of change so that the effective center of the measurement sits at approximately sixteen weeks. Sectors are ranked by this score each week and the rank change column (R/C) tracks rotational momentum: which sectors are climbing or falling in the standings.
█ HOW IT WORKS
The DTR score for each sector is computed as:
where each ROC is a simple percent change (current weekly close versus the close N weeks ago), and the default weights are 50% / 25% / 25%. This weighting places half the emphasis on recent momentum while anchoring the composite with longer-term trend context. The weighted average lookback under default settings is:
All price data is forced to weekly resolution via request.security, so the indicator produces identical results regardless of the chart timeframe. The twelve sectors are ranked in descending order by DTR score each week.
█ SECTOR UNIVERSE
The indicator tracks twelve symbols:
•
XLK Technology•
XLV Health Care•
XLE Energy•
XLF Financials•
XLC Communication Services•
XLY Consumer Discretionary•
XLP Consumer Staples•
XLI Industrials•
XLB Materials•
XLRE Real Estate•
XLU Utilities•
SPY S&P 500 (benchmark)SPY is included as the twelfth entry so you can see where the broad market sits relative to individual sectors. A sector ranked above SPY is outperforming the market on the composite momentum measure; a sector ranked below SPY is underperforming.
█ READING THE CHART
Plotted line
The yellow line shows the DTR score for one selected sector. When the chart symbol is one of the twelve tracked ETFs, that sector is plotted automatically. When the chart symbol is anything else (an individual stock, a futures contract, crypto), the indicator plots whichever sector is selected in the "Plot Sector" dropdown, which defaults to SPY.
• DTR above zero: the selected sector has positive weighted momentum across the composite lookback
• DTR below zero: negative weighted momentum
• DTR rising: momentum is accelerating
• DTR falling: momentum is decelerating, even if still positive
The green/red background shading reflects the sign of the plotted DTR score.
Ranking table
The table (toggled via settings) displays all twelve symbols sorted by DTR score, with five columns:
• Rank: current position (1 = strongest)
• Sector: ticker and sector name
• DTR: the composite score
• R/C: rank change from the prior week (positive = improving, shown in green; negative = deteriorating, shown in red)
• 8w ROC: the short-term rate of change alone, for additional context
The currently plotted sector is highlighted with a yellow background in the table. Rows with positive DTR scores have green-tinted backgrounds; negative scores have red-tinted backgrounds.
What to look for
• Sectors at the top of the table with positive and rising R/C values are in strong rotational momentum. These are the sectors institutional capital is flowing into.
• Sectors falling in rank (negative R/C) even while DTR is still positive are showing early deceleration. This is often where rotation out of a sector begins before price breaks down.
• When SPY sits in the bottom half of the rankings, most sectors are outperforming the broad market, which can indicate a broad-based rally. When SPY is near the top, few sectors are keeping up, suggesting narrow market leadership.
• Clusters of defensive sectors (XLU, XLP, XLV) rising in rank while cyclicals (XLK, XLY, XLI) fall is a classic late-cycle rotation signal.
█ INPUTS
• Short / Medium / Long ROC (weeks): the three lookback periods, defaulting to 8, 16, and 32 weeks
• Weight: Short / Medium / Long ROC: the weight applied to each period, defaulting to 0.50, 0.25, 0.25. These should sum to 1.0 for a properly scaled composite, though the script does not enforce this, allowing deliberate over- or under-weighting
• Plot Sector: which sector's DTR score to plot when the chart symbol is not in the universe. Ignored when the chart symbol matches one of the twelve tracked ETFs
• Show Ranking Table: toggle the table on or off
• Table Position: corner placement of the ranking table
█ LIMITATIONS AND NOTES
• The indicator requires at least 32 weeks of weekly data history to compute the longest default ROC. On symbols or exchanges with limited history, early bars will show na values.
• All data is pulled at weekly resolution. The DTR score updates once per week at the weekly close. Intraweek movements are not reflected until the current weekly bar closes.
• The sector universe is hardcoded to the eleven SPDR Select Sector ETFs plus SPY. These ETFs use the GICS classification system. Some sectors (notably XLC, which replaced the old Telecom sector in 2018) have limited history prior to their inception date.
• The R/C column compares the current week's rank to the prior week's rank. A single week of rank change can be noisy; persistent rank trends over multiple weeks are more informative.
• The weights are user-configurable but the "centered at N weeks" interpretation only holds when weights sum to 1.0.
█ METHODOLOGY NOTES
This approach to sector relative strength analysis is well-established in the technical analysis community. The multi-timeframe weighted ROC method has been used by practitioners including Tom Dorsey (Dorsey Wright & Associates) and other relative strength analysts for decades. The specific weighting scheme implemented here (50% short / 25% medium / 25% long, centered at approximately 16 weeks) comes from a publicly shared analysis of Fidelity sector fund rankings at the time of the March 2000 dot-com peak, which demonstrated the framework's ability to capture sector rotation during a major market inflection.
The SPDR sector ETFs used in this implementation are the most liquid and widely tracked sector vehicles available on US exchanges, making them the natural modern equivalent of the Fidelity sector fund universe used in the original analysis.
═════════════════════════════════════════════════════════════════════════
Disclaimer: This script is provided for educational and informational purposes only. It is not financial advice. Past indicator behavior does not guarantee future results.
نص برمجي مفتوح المصدر
بروح TradingView الحقيقية، قام مبتكر هذا النص البرمجي بجعله مفتوح المصدر، بحيث يمكن للمتداولين مراجعة وظائفه والتحقق منها. شكرا للمؤلف! بينما يمكنك استخدامه مجانًا، تذكر أن إعادة نشر الكود يخضع لقواعد الموقع الخاصة بنا.

إخلاء المسؤولية
لا يُقصد بالمعلومات والمنشورات أن تكون، أو تشكل، أي نصيحة مالية أو استثمارية أو تجارية أو أنواع أخرى من النصائح أو التوصيات المقدمة أو المعتمدة من TradingView. اقرأ المزيد في شروط الاستخدام.
نص برمجي مفتوح المصدر
بروح TradingView الحقيقية، قام مبتكر هذا النص البرمجي بجعله مفتوح المصدر، بحيث يمكن للمتداولين مراجعة وظائفه والتحقق منها. شكرا للمؤلف! بينما يمكنك استخدامه مجانًا، تذكر أن إعادة نشر الكود يخضع لقواعد الموقع الخاصة بنا.
إخلاء المسؤولية
لا يُقصد بالمعلومات والمنشورات أن تكون، أو تشكل، أي نصيحة مالية أو استثمارية أو تجارية أو أنواع أخرى من النصائح أو التوصيات المقدمة أو المعتمدة من TradingView. اقرأ المزيد في شروط الاستخدام.