OPEN-SOURCE SCRIPT
BTC Logarithmic Regression Quantile Bands | Astral Vision
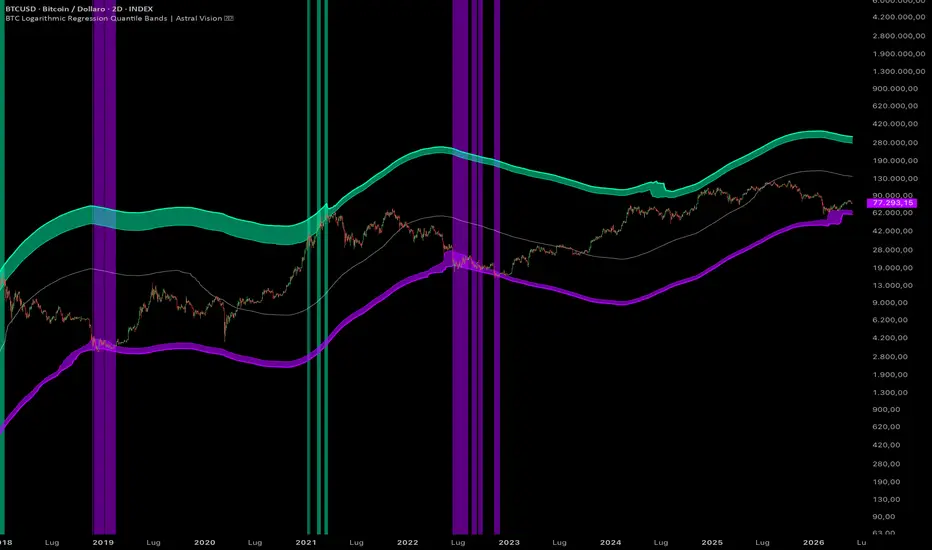
Bitcoin Anchored Regression Quantile Bands | Astral Vision 🌠💠
This indicator fits a log-linear regression to Bitcoin's price from a configurable anchor date forward, then constructs a dynamic price channel by mapping the historical quantiles of the regression residuals back into price space. The result is a set of bands that adapt to the actual statistical distribution of how far Bitcoin's price has historically deviated above and below its own long-term trend line, rather than using fixed multipliers or standard deviations.
Calculation ⚙️
The natural logarithm of close is taken for each bar from the anchor date onward. A linear regression is fitted to this log-price series over the full accumulated history from the anchor date up to a configurable maximum bar count, producing a trend line that represents Bitcoin's long-term log-linear growth trajectory from the chosen starting point. Working in log space is essential: Bitcoin's price has expanded across six orders of magnitude, and a linear regression on raw prices would be dominated entirely by recent data. In log space, proportional moves are treated equally across all price levels and all time periods.
The residual at each bar is the difference between the actual log price and the regression trend value: residual = log(close) - trend. This measures in log-space how far price sits above or below its fitted trend at any given moment. A positive residual means price is above trend; a negative residual means price is below trend.
Five quantiles of the residual distribution are then computed over the active history from the anchor date: the 1st and 99th percentiles forming the outer channel, a configurable inner pair (default 5th and 95th) forming the inner channel, and the 50th percentile as the median. Each quantile is converted back to a price level by exponentiating the sum of the trend value and the quantile: band price = exp(trend + quantile). This inversion ensures the bands are always anchored to the current regression trend and scale proportionally with price.
The 50th percentile band represents the median regression price, where historically half of all price observations have been above and half below. The inner bands mark the zone within which the configurable percentage of historical price observations have occurred. The outer 1st and 99th percentile bands mark the historical extremes, where price has spent only 1% of its time beyond each boundary.
Plots 📊
Inputs 🎛️
Colors 🎨
5 Astral Vision presets + custom override. Default: Futura.
Purpose 🎯
Standard Bollinger Bands use a fixed lookback window and assume a normal distribution of price deviations, which does not hold for Bitcoin's log-price residuals. This indicator uses actual empirical quantiles of the full historical residual distribution from the anchor date, making each band level statistically precise: the 99th percentile band has been exceeded by price exactly 1% of the time since the anchor date, which is a more meaningful and verifiable statement than a fixed 2-standard-deviation level. The anchor date architecture also means the bands incorporate the full available price history rather than only a recent rolling window, making them structurally stable references for long-term cycle analysis.
Disclaimer ⭕️
This indicator is for informational and educational purposes only. It does not constitute financial advice. Past performance is not indicative of future results. Always do your own research before making investment decisions.
This indicator fits a log-linear regression to Bitcoin's price from a configurable anchor date forward, then constructs a dynamic price channel by mapping the historical quantiles of the regression residuals back into price space. The result is a set of bands that adapt to the actual statistical distribution of how far Bitcoin's price has historically deviated above and below its own long-term trend line, rather than using fixed multipliers or standard deviations.
Calculation ⚙️
The natural logarithm of close is taken for each bar from the anchor date onward. A linear regression is fitted to this log-price series over the full accumulated history from the anchor date up to a configurable maximum bar count, producing a trend line that represents Bitcoin's long-term log-linear growth trajectory from the chosen starting point. Working in log space is essential: Bitcoin's price has expanded across six orders of magnitude, and a linear regression on raw prices would be dominated entirely by recent data. In log space, proportional moves are treated equally across all price levels and all time periods.
The residual at each bar is the difference between the actual log price and the regression trend value: residual = log(close) - trend. This measures in log-space how far price sits above or below its fitted trend at any given moment. A positive residual means price is above trend; a negative residual means price is below trend.
Five quantiles of the residual distribution are then computed over the active history from the anchor date: the 1st and 99th percentiles forming the outer channel, a configurable inner pair (default 5th and 95th) forming the inner channel, and the 50th percentile as the median. Each quantile is converted back to a price level by exponentiating the sum of the trend value and the quantile: band price = exp(trend + quantile). This inversion ensures the bands are always anchored to the current regression trend and scale proportionally with price.
The 50th percentile band represents the median regression price, where historically half of all price observations have been above and half below. The inner bands mark the zone within which the configurable percentage of historical price observations have occurred. The outer 1st and 99th percentile bands mark the historical extremes, where price has spent only 1% of its time beyond each boundary.
Plots 📊
- Outer upper band at the 99th percentile of residuals
- Inner upper band at the configurable upper quantile
- Median band at the 50th percentile
- Inner lower band at the configurable lower quantile
- Outer lower band at the 1st percentile of residuals
- Fills between outer and inner bands on both sides
- Background color when price is outside the inner band pair
- Bar coloring with six gradient levels reflecting position within the channel
Inputs 🎛️
- Anchor Date: starting point for the regression, all quantiles are computed from this date forward
- Regression Length: maximum bar count used in the regression and quantile computation
- Show Fills: toggle the fill between outer and inner bands
- Inner Quantile Pair: percentile level for the inner band pair, symmetric around 50
Colors 🎨
5 Astral Vision presets + custom override. Default: Futura.
Purpose 🎯
Standard Bollinger Bands use a fixed lookback window and assume a normal distribution of price deviations, which does not hold for Bitcoin's log-price residuals. This indicator uses actual empirical quantiles of the full historical residual distribution from the anchor date, making each band level statistically precise: the 99th percentile band has been exceeded by price exactly 1% of the time since the anchor date, which is a more meaningful and verifiable statement than a fixed 2-standard-deviation level. The anchor date architecture also means the bands incorporate the full available price history rather than only a recent rolling window, making them structurally stable references for long-term cycle analysis.
Disclaimer ⭕️
This indicator is for informational and educational purposes only. It does not constitute financial advice. Past performance is not indicative of future results. Always do your own research before making investment decisions.
نص برمجي مفتوح المصدر
بروح TradingView الحقيقية، قام مبتكر هذا النص البرمجي بجعله مفتوح المصدر، بحيث يمكن للمتداولين مراجعة وظائفه والتحقق منها. شكرا للمؤلف! بينما يمكنك استخدامه مجانًا، تذكر أن إعادة نشر الكود يخضع لقواعد الموقع الخاصة بنا.

My premium indicators are available on Whop:
whop.com/astralvision
Astral Vision 🌠💠
whop.com/astralvision
Astral Vision 🌠💠
إخلاء المسؤولية
لا يُقصد بالمعلومات والمنشورات أن تكون، أو تشكل، أي نصيحة مالية أو استثمارية أو تجارية أو أنواع أخرى من النصائح أو التوصيات المقدمة أو المعتمدة من TradingView. اقرأ المزيد في شروط الاستخدام.
نص برمجي مفتوح المصدر
بروح TradingView الحقيقية، قام مبتكر هذا النص البرمجي بجعله مفتوح المصدر، بحيث يمكن للمتداولين مراجعة وظائفه والتحقق منها. شكرا للمؤلف! بينما يمكنك استخدامه مجانًا، تذكر أن إعادة نشر الكود يخضع لقواعد الموقع الخاصة بنا.
My premium indicators are available on Whop:
whop.com/astralvision
Astral Vision 🌠💠
whop.com/astralvision
Astral Vision 🌠💠
إخلاء المسؤولية
لا يُقصد بالمعلومات والمنشورات أن تكون، أو تشكل، أي نصيحة مالية أو استثمارية أو تجارية أو أنواع أخرى من النصائح أو التوصيات المقدمة أو المعتمدة من TradingView. اقرأ المزيد في شروط الاستخدام.